本文系韩京清老师1995年论文发表在控制与决策的论文《一类不确定对象的扩张状态观测器》的解读与代码实现。
原理
状态观测器的作用是通过系统的输出估计系统的状态。
线性系统理论中状态观测器的设计一般要求系统的内部动态(A,B,C)是已知的。但这不符合工程实际,很多时候我们并不了解控制对象的内部动态。
自抗扰控制的框架中,把系统的未知动态和外部扰动合并成总扰动,并且用一个扩展状态来表示。
扩张状态观测器(Extended State Observer)的目的就是根据系统的输出 y y y 估计出这个扩张状态。
在形如
(
1
)
(1)
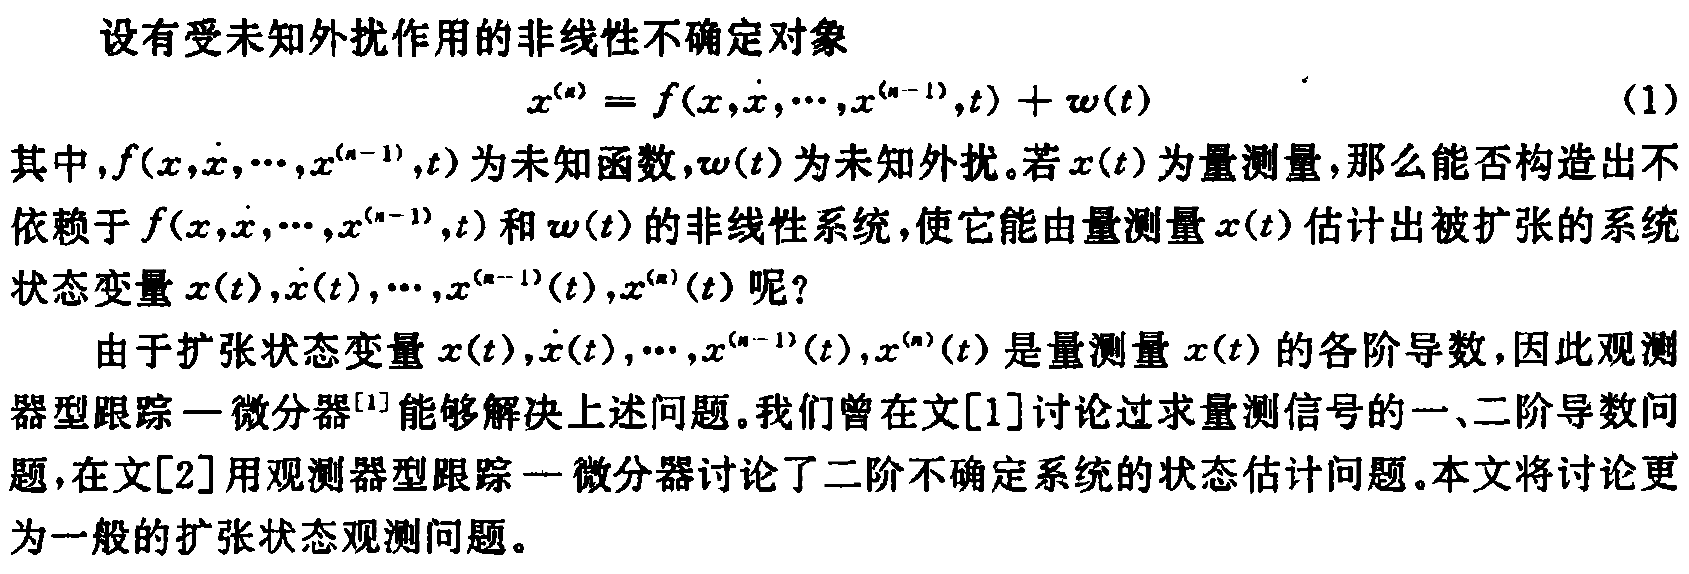
(1)式的一大类系统中,扩张状态的估计可以视为信号微分的估计:
举个简单的例子,根据空中移动的物体的轨迹把物体所受到的合外力(包含随机扰动)估计出来。当已知了物体原本的合外力,就可以对物体施加控制(力):控制量等于我们期望物体产生的运动所需要的力减去物体原来收到的合外力。这样物体就会按照我们控制的轨迹移动。
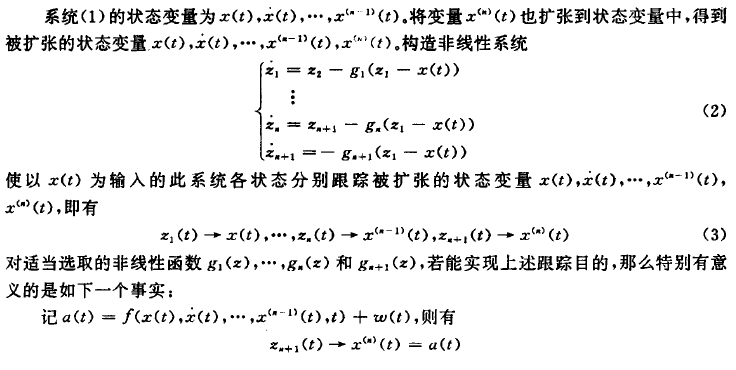
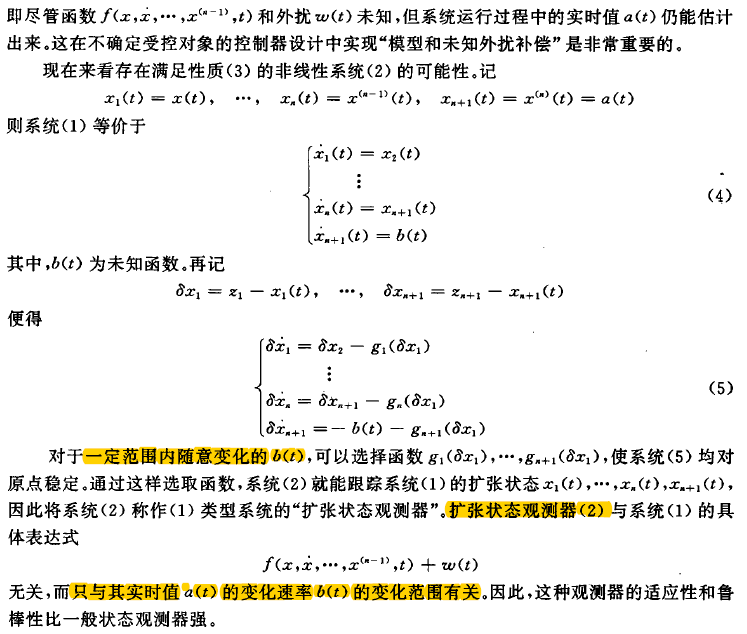
其实原理很简单,寥寥数行就讲得清楚明白。
g
g
g 的选取也很简单,对
(
5
)
(5)
(5)式做线性化处理:
[
δ
x
˙
1
δ
x
˙
2
⋮
δ
x
˙
n
δ
x
˙
n
+
1
]
=
[
−
g
1
′
1
0
⋯
0
−
g
2
′
0
1
⋯
0
⋮
⋮
⋮
−
g
1
′
0
⋯
1
−
g
n
+
1
′
0
⋯
0
]
[
δ
x
1
δ
x
2
⋮
δ
x
n
δ
x
n
+
1
]
+
[
0
0
⋮
0
−
b
(
t
)
]
left[begin{array}{c} delta dot{x}_1 \ delta dot{x}_2 \ vdots \ delta dot{x}_n \ delta dot{x}_{n+1} \ end{array}right] = left[begin{array}{c} -g_1' & 1 & 0 & cdots& 0\ -g_2' & 0 & 1 & cdots& 0\ vdots & vdots & & &vdots \ -g_1' & 0 & cdots & &1 \ -g_{n+1}' & 0 &cdots & &0\ end{array}right] left[begin{array}{c} delta x_1 \ delta x_2 \ vdots \ delta x_n \ delta x_{n+1} \ end{array}right] + left[begin{array}{c} 0 \ 0 \ vdots \ 0 \ -b(t) \ end{array}right]
⎣⎢⎢⎢⎢⎢⎡δx˙1δx˙2⋮δx˙nδx˙n+1⎦⎥⎥⎥⎥⎥⎤=⎣⎢⎢⎢⎢⎢⎡−g1′−g2′⋮−g1′−gn+1′10⋮0001⋯⋯⋯⋯00⋮10⎦⎥⎥⎥⎥⎥⎤⎣⎢⎢⎢⎢⎢⎡δx1δx2⋮δxnδxn+1⎦⎥⎥⎥⎥⎥⎤+⎣⎢⎢⎢⎢⎢⎡00⋮0−b(t)⎦⎥⎥⎥⎥⎥⎤
上式中的方阵是个友矩阵,很容易对它做极点配置。
只要 b b b 是有界的,就可以做到渐进跟踪。
代码
龙格库塔
import numpy as np
import matplotlib.pyplot as plt
%matplotlib inline
def dxdt(F, X, t, h=1e-2):
assert(len(F)==len(X))
X = np.array(X)
K1 = np.array([f(X, t) for f in F])
dX = h*K1/2
K2 = np.array([f(X+dX, t+h/2) for f in F])
dX = h*K2/2
K3 = np.array([f(X+dX, t+h/2) for f in F])
dX = h*K3
K4 = np.array([f(X+dX, t+h) for f in F])
dX = (K1 + 2*K2 + 2*K3 + K4)*h/6
return dX, np.array([f(X, t) for f in F])
def trajectory(F, initial_point, num_points=1e4, h=1e-2):
assert(len(F)==len(initial_point))
n = int(num_points)
dim = len(initial_point)
X = np.zeros([n,dim])
D = np.zeros([n,dim])
X[0,:] = initial_point
for k in range(1,n):
dX, D[k-1,:] = dxdt(F,X[k-1,:],h*(k-1),h)
X[k,:] = X[k-1,:] + dX
return X.T, D.T
构造被观测系统

论文中的实验结果
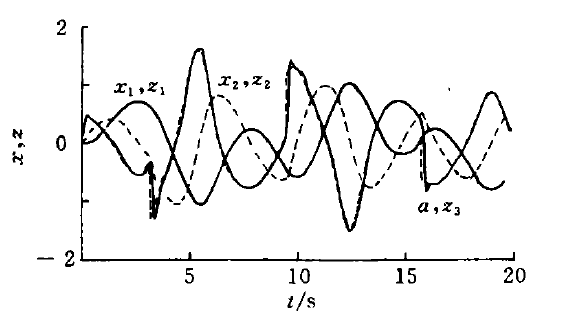
代码复现:
def f1(X, t):
x, y = X[0], X[1]
return y
def f2(X, t):
x, y = X[0], X[1]
return -x*x*x - x -0.2*y + v(t)
def v(t):
return 0.5 * np.sign(np.cos(t/2))
h = 1e-2
N = 2000
x,d = trajectory([f1,f2],(0,0),N,h)
fig = plt.figure()
plt.plot(x[0], color='red', label='original')
plt.plot(x[1], color='blue', label='1st order')
plt.plot(d[1], color='black', label='2nd order')
plt.legend()
plt.show()
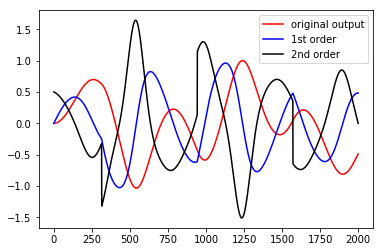
下面我们将上述生成信号(红线)作为状态观测器的输入,并期望ESO可以把黑线重构出来。
v0 = x[0]
def v(t):
return v0[int(t/h)]
# 极点配置
p = np.poly1d([-15,-15,-15],True)
_, b1, b2, b3 = tuple(p.coef)
def g1(X, t):
x1,x2,x3 = X[0], X[1], X[2]
return x2 - b1 * nle(x1 - v(t))
def g2(X, t):
x1, x2, x3 = X[0], X[1], X[2]
return x3 - b2 * nle(x1 - v(t))
def g3(X, t):
x1, x2, x3 = X[0], X[1], X[2]
return -b3 * nle(x1 - v(t))
# 论文中使用非线性误差,这里实验用线性的
def nle(e):
# nonlinear error
# return
np.sign(e)*np.sqrt(np.abs(e))
return e
N = 2000
z,_ = trajectory([g1,g2,g3],(0,0,0),N,h)
fig = plt.figure()
plt.plot(z[0], color='red', label='tracking')
plt.plot(z[1], color='blue', label='1st order')
plt.plot(z[2], color='black', label='2nd order')
plt.legend()
plt.show()
跟踪结果以及二阶导数
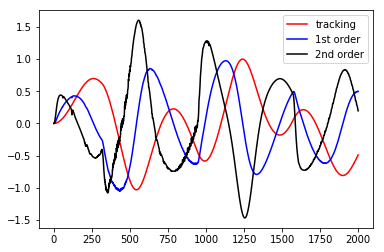
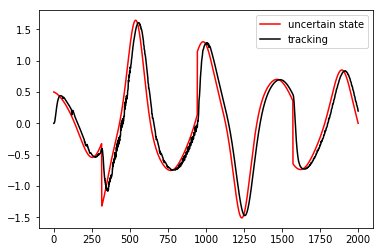
和原系统的扩张状态对比
fig = plt.figure()
plt.plot(d[1], color='red', label='uncertain state')
plt.plot(z[2], color='black', label='tracking')
plt.legend()
plt.show()
最后
以上就是尊敬黑裤最近收集整理的关于自抗扰控制(ADRC)—— 扩展状态观测器原理代码的全部内容,更多相关自抗扰控制(ADRC)——内容请搜索靠谱客的其他文章。


发表评论 取消回复