折线、面、圆形等覆盖物:
折线:
<!doctype html>
<html>
<head>
    <meta charset="utf-8">
    <meta http-equiv="X-UA-Compatible" content="IE=edge">
    <meta name="viewport" content="initial-scale=1.0, user-scalable=no, width=device-width">
    <style>
    html,
    body,
    #container {
      width: 100%;
      height: 100%;
    }
    </style>
    <title>折线的绘制和编辑</title>
    <link rel="stylesheet" href="https://a.amap.com/jsapi_demos/static/demo-center/css/demo-center.css" />
    <script src="https://webapi.amap.com/maps?v=1.4.15&key=您申请的key值&plugin=AMap.PolyEditor"></script>
    <script src="https://a.amap.com/jsapi_demos/static/demo-center/js/demoutils.js"></script>
</head>
<body>
<div id="container"></div>

<script type="text/javascript">
    var map = new AMap.Map("container", {
        center: [116.395577, 39.892257],
        zoom: 14
    });

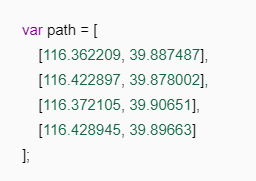
    var path = [
        [116.362209, 39.887487],
        [116.422897, 39.878002],
        [116.372105, 39.90651],
        [116.428945, 39.89663]
    ];

    var polyline = new AMap.Polyline({
        path: path,
        isOutline: true,
        outlineColor: '#ffeeff',
        borderWeight: 3,
        strokeColor: "#3366FF",
        strokeOpacity: 1,
        strokeWeight: 6,
        // 折线样式还支持 'dashed'
        strokeStyle: "solid",
        // strokeStyle是dashed时有效
        strokeDasharray: [10, 5],
        lineJoin: 'round',
        lineCap: 'round',
        zIndex: 50,
    })

    polyline.setMap(map)
    // 缩放地图到合适的视野级别
    map.setFitView([ polyline ])

    var polyEditor = new AMap.PolyEditor(map, polyline)


</script>
</body>
</html>
这里的数组是按照先后顺序来的。
画矩形:
这里注意两个点就能画一个矩形
<!doctype html>
<html>
<head>
    <meta charset="utf-8">
    <meta http-equiv="X-UA-Compatible" content="IE=edge">
    <meta name="viewport" content="initial-scale=1.0, user-scalable=no, width=device-width">
    <title>矩形的绘制和编辑</title>
    <style>
      html,
      body,
      #container {
        width: 100%;
        height: 100%;
      }
    </style>
    <link rel="stylesheet" href="https://a.amap.com/jsapi_demos/static/demo-center/css/demo-center.css" />
    <script src="https://webapi.amap.com/maps?v=1.4.15&key=您申请的key值&plugin=AMap.RectangleEditor"></script>
    <script src="https://a.amap.com/jsapi_demos/static/demo-center/js/demoutils.js"></script>
</head>
<body>
<div id="container"></div>
<div class="input-card" style="width: 120px">
   <button class="btn" onclick="rectangleEditor.open()" style="margin-bottom: 5px">开始编辑</button>
   <button class="btn" onclick="rectangleEditor.close()">结束编辑</button>
</div>
<script>
    var map = new AMap.Map('container', {
        center: [ 116.387175, 39.876405 ],
        zoom: 13
    });

    var southWest = new AMap.LngLat(116.356449, 39.859008)
    var northEast = new AMap.LngLat(116.417901, 39.893797)

    var bounds = new AMap.Bounds(southWest, northEast)

    var rectangle = new AMap.Rectangle({
        bounds: bounds,
        strokeColor:'red',
        strokeWeight: 6,
        strokeOpacity:0.5,
        strokeDasharray: [30,10],
        // strokeStyle还支持 solid
        strokeStyle: 'dashed',
        fillColor:'blue',
        fillOpacity:0.5,
        cursor:'pointer',
        zIndex:50,
    })

    rectangle.setMap(map)
    // 缩放地图到合适的视野级别
    map.setFitView([ rectangle ])

    var rectangleEditor = new AMap.RectangleEditor(map, rectangle)

    rectangleEditor.on('adjust', function(event) {
        log.info('触发事件:adjust')
    })

    rectangleEditor.on('end', function(event) {
        log.info('触发事件: end')
        // event.target 即为编辑后的矩形对象
    })

</script>
</body>
</html>
画圆:
<!doctype html>
<html>
<head>
    <meta charset="utf-8">
    <meta http-equiv="X-UA-Compatible" content="IE=edge">
    <meta name="viewport" content="initial-scale=1.0, user-scalable=no, width=device-width">
    <style>
    html,
    body,
    #container {
      width: 100%;
      height: 100%;
    }
    </style>
    <title>圆的绘制和编辑</title>
    <link rel="stylesheet" href="https://a.amap.com/jsapi_demos/static/demo-center/css/demo-center.css" />
    <script src="https://webapi.amap.com/maps?v=1.4.15&key=您申请的key值&plugin=AMap.CircleEditor"></script>
    <script src="https://a.amap.com/jsapi_demos/static/demo-center/js/demoutils.js"></script>
</head>
<body>
<div id="container"></div>
<div class="input-card" style="width: 120px">
   <button class="btn" onclick="circleEditor.open()" style="margin-bottom: 5px">开始编辑</button>
   <button class="btn" onclick="circleEditor.close()">结束编辑</button>
</div>
<script type="text/javascript">
    var map = new AMap.Map("container", {
        center: [116.433322, 39.900256],
        zoom: 14
    });

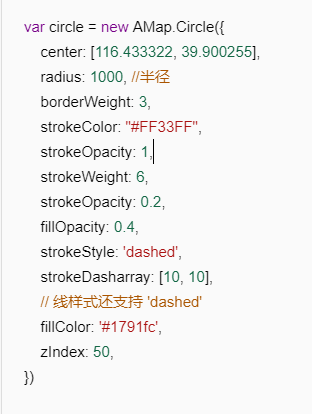
    var circle = new AMap.Circle({
        center: [116.433322, 39.900255],
        radius: 1000, //半径
        borderWeight: 3,
        strokeColor: "#FF33FF",
        strokeOpacity: 1,
        strokeWeight: 6,
        strokeOpacity: 0.2,
        fillOpacity: 0.4,
        strokeStyle: 'dashed',
        strokeDasharray: [10, 10],
        // 线样式还支持 'dashed'
        fillColor: '#1791fc',
        zIndex: 50,
    })

    circle.setMap(map)
    // 缩放地图到合适的视野级别
    map.setFitView([ circle ])

    var circleEditor = new AMap.CircleEditor(map, circle)

    circleEditor.on('move', function(event) {
        log.info('触发事件:move')
    })

    circleEditor.on('adjust', function(event) {
        log.info('触发事件:adjust')
    })

    circleEditor.on('end', function(event) {
        log.info('触发事件: end')
        // event.target 即为编辑后的圆形对象
    })
</script>
</body>
</html>
这里是基本属性。
其他的参考:https://lbs.amap.com/api/javascript-api/example/overlayers/linedir
最后
以上就是发嗲唇彩最近收集整理的关于高德地图:折线、面、圆形等覆盖物的全部内容,更多相关高德地图内容请搜索靠谱客的其他文章。
本图文内容来源于网友提供,作为学习参考使用,或来自网络收集整理,版权属于原作者所有。


发表评论 取消回复