在科研论文写作中,有时候为了横向、纵向对比或者节省空间,我们需要画子图,在MATLAB中可以通过subplot命令来实现。在Latex中有以下几种方法进行子图的绘制:
- 使用subfig宏包(有可能与hyperref宏包冲突,推荐使用subcaption宏包),主要格式为:
  begin{figure}
  subfloat[]{}
  subfloat[]{}\
  subfloat[]{}
  subfloat[]{}
end{figure}- 使用subcaption宏包,主要格式为:
  begin{figure}
  subcaptionbox{}{}
  subcaptionbox{}{}\
  subcaptionbox{}{}
  subcaptionbox{}{}
end{figure}- 使用groupplot宏包,主要格式为:
  begin{figure}
centering
begin{tikzpicture}
begin{groupplot}
nextgroupplot
addplot {x};
nextgroupplot
end{groupplot}
end{tikzpicture}
end{figure}- 使用matrix宏包,主要格式为:
    begin{figure}
centering
begin{tikzpicture}
matrix
 {
 begin{axis}
 addplot {x};
 end{axis}

  begin{axis}
 addplot {x};
 end{axis}
 }
end{tikzpicture}
end{figure}
下面给出上述各种情况的具体代码实现以及示意图:
- 使用subfig宏包
代码如下:
documentclass{article}
usepackage[dvipdfm]{graphicx}
defpgfsysdriver{pgfsys-dvipdfmx.def}
usepackage{tikz}
usepackage{pgfplots}
usepackage{subfig}%使用子图包,可能与hyperref冲突
usepackage{float}
usepackage{cite}
usepackage[colorlinks,dvipdfm,
pdfpagemode=UseOutlines,
pdfstartview=FitH,
anchorcolor=green,
citecolor=blue,
linkcolor=red,
hyperindex=true,
pagebackref,
bookmarksnumbered,
bookmarksopenlevel=2,
colorlinks]{hyperref}
pgfplotsset{width=6cm,compat=1.15}
begin{document}
begin{figure}
begin{center}
subfloat[label{subfig1}]{
begin{tikzpicture}
begin{axis}[
legend columns=-1,%the legend are plotted horizontally
legend entries={$x$},
legend to name=named,% stored in named, not plotted in the figure
title={subfig1},
]
addplot {x};label{curvex}
end{axis}
end{tikzpicture}label{subfig2}}
subfloat[]{
begin{tikzpicture}
begin{axis}[title={subfig2}]
addplot {x};
end{axis}
end{tikzpicture}label{subfig2}}
end{center}
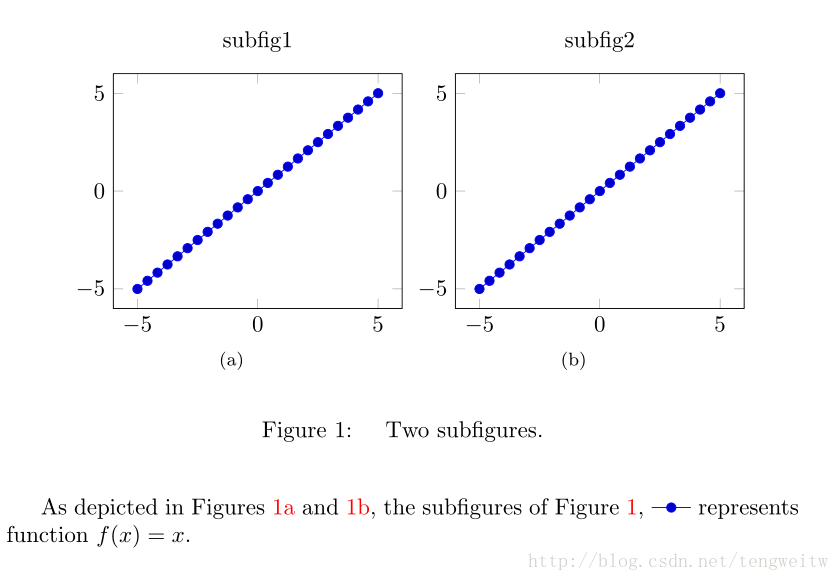
caption{hspace{1em}Two subfigures.}label{f1}
end{figure}
As depicted in Figures~ref{subfig1} and ref{subfig2}, the subfigures of Figure~ref{f1}, ref{curvex} represents function $f(x)=x$.
end{document} - 使用subcaption宏包
代码如下:
documentclass{article}
usepackage[dvipdfm]{graphicx}
defpgfsysdriver{pgfsys-dvipdfmx.def}
usepackage{tikz}
usepackage{pgfplots}
%usepackage{subfig}
usepackage[hypcap=true,labelsep=period,font=small]{caption}% 图的标题设置Fig.
usepackage[hypcap=true]{subcaption}%用于画子图 可以适配hyperref包
usepackage{float}
usepackage[colorlinks,dvipdfm,
pdfpagemode=UseOutlines,
pdfstartview=FitH,
anchorcolor=green,
citecolor=blue,
linkcolor=red,
hyperindex=true,
pagebackref,
bookmarksnumbered,
bookmarksopenlevel=2,
colorlinks]{hyperref}
pgfplotsset{width=6cm,compat=1.15}
begin{document}
begin{figure}
begin{center}
subcaptionbox{label{subfig1}}{
begin{tikzpicture}
begin{axis}[
legend columns=-1,%the legend are plotted horizontally
legend entries={$x$},
legend to name=named,% stored in named
title={subfig1},
]
addplot {x};label{curvex}
end{axis}
end{tikzpicture}}
subcaptionbox{label{subfig2}}{
begin{tikzpicture}
begin{axis}[title={subfig2}]
addplot {x};
end{axis}
end{tikzpicture}}
end{center}
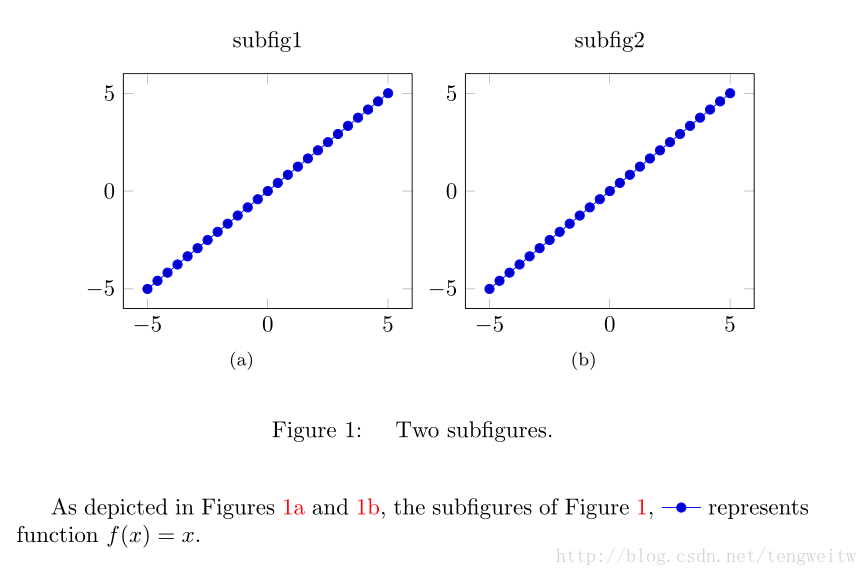
caption{hspace{1em}Two subfigures.}label{f1}
end{figure}
As depicted in Figures~ref{subfig1} and ref{subfig2}, the subfigures of Figure~ref{f1}, ref{curvex} represents function $f(x)=x$.
end{document} - 使用groupplot宏包
代码如下:
documentclass{article}
usepackage[dvipdfm]{graphicx}
defpgfsysdriver{pgfsys-dvipdfmx.def}
usepackage{tikz}
usepackage{pgfplots}
pgfplotsset{width=7cm,compat=1.15}
usepgfplotslibrary{groupplots}
usepackage{caption}
usepackage{subcaption}
usepackage[colorlinks,dvipdfm,
pdfpagemode=UseOutlines,
pdfstartview=FitH,
anchorcolor=green,
citecolor=blue,
linkcolor=red,
hyperindex=true,
pagebackref,
bookmarksnumbered,
bookmarksopenlevel=2,
colorlinks]{hyperref}
begin{document}
begin{figure}[htb]
centering
begin{tikzpicture}
begin{groupplot}[
group style={
group name=my plots,
group size=2 by 2,
xlabels at=edge bottom,
xlabels at=all,
ylabels at=edge left,
x descriptions at=edge bottom,
},
footnotesize,
width=6cm,
height=6cm,
%
xlabel=$x$,
ylabel=$f(x)$,
]
nextgroupplot
addplot {x};
node [text width=1em,anchor=north west] at (rel axis cs: 0,1)
{subcaption{label{f11}}};%<- changed
nextgroupplot
addplot {x^2};
nextgroupplot
addplot {x^3};
nextgroupplot
addplot {x^4};
end{groupplot}
end{tikzpicture}
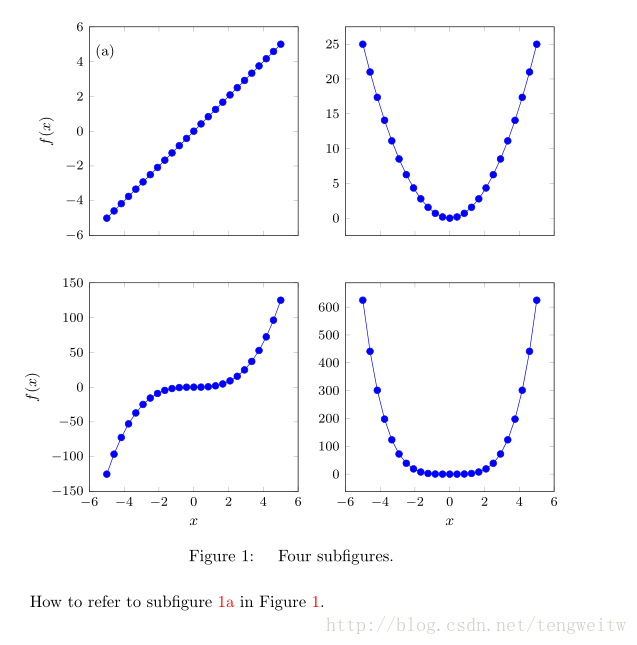
caption{hspace{1em}Four subfigures.}label{f1}
end{figure}
How to refer to subfigure~ref{f11} in Figure~ref{f1}.
end{document} - 使用matrix宏包
代码如下:
documentclass{article}
usepackage[dvipdfm]{graphicx}
defpgfsysdriver{pgfsys-dvipdfmx.def}
usepackage{tikz}
usepackage{pgfplots}
pgfplotsset{width=7cm,compat=1.15}
usepgfplotslibrary{groupplots}
usetikzlibrary{matrix}
usepackage{caption}
usepackage{subcaption}
usepackage[colorlinks,dvipdfm,
pdfpagemode=UseOutlines,
pdfstartview=FitH,
anchorcolor=green,
citecolor=blue,
linkcolor=red,
hyperindex=true,
pagebackref,
bookmarksnumbered,
bookmarksopenlevel=2,
colorlinks]{hyperref}
begin{document}
begin{figure}[htb]
centering
begin{tikzpicture}
pgfplotsset{small}
matrix {
begin{axis}[ylabel={$f(x)=x$},ylabel style={font=small}]
addplot {x};
node [text width=1em,anchor=north west] at (rel axis cs: 0,1)
{subcaption{label{f11}}};%<- changed
end{axis}
&
% differently large labels are aligned automatically:
begin{axis}[ylabel={$f(x)=x^2$},ylabel style={font=small}]
addplot {x^2};
end{axis}
\
begin{axis}[ylabel={$f(x)=x^3$},ylabel style={font=small},xlabel=$x$,xlabel style={font=small}]
addplot {x^3};
end{axis}
&
begin{axis}[ylabel={$f(x)=x^4$},ylabel style={font=small},xlabel=$x$,xlabel style={font=small}]
addplot {x^4};
end{axis}
\
};
end{tikzpicture}
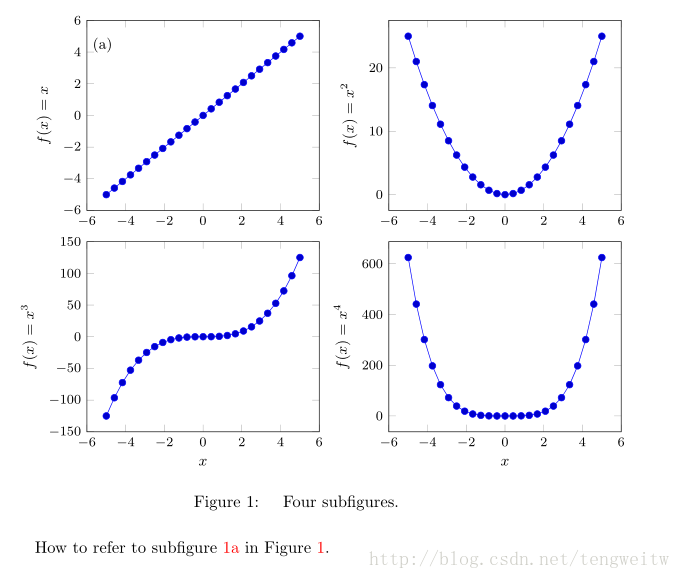
caption{hspace{1em}Four subfigures.}label{f1}
end{figure}
How to refer to subfigure~ref{f11} in Figure~ref{f1}.
end{document} Note: 第三种和第四种方法不适合需要单独引用每一个子图的情况,比较适合把四张图看成一个整体的情况。
参考文献:
[1] pgfplots manual: http://pgfplots.sourceforge.net/pgfplots.pdf
本科舍友不幸得了黑色素癌, 在此恳求大家能给予帮助,在此谢谢大家!以下是水滴筹的链接:
https://www.shuidichou.com/cf/contribute/7d975cfc-e508-4549-acb1-5a31ceb759a1?channel=wx_charity_pyq&source=7hEPKZfbC7kzc7ndTKDD6cZriDdYH4TQ&forwardFrom=5&sharedv=2008
今天发现该链接已经提现了,但是已筹金额未达预期,期望各位通过左下角的微信扫码进行捐款,我将悉数给予舍友。再次感谢大家的帮助!
最后
以上就是玩命飞鸟最近收集整理的关于【漫漫科研路\pgfplots】子图的多种画法的全部内容,更多相关【漫漫科研路\pgfplots】子图内容请搜索靠谱客的其他文章。
本图文内容来源于网友提供,作为学习参考使用,或来自网络收集整理,版权属于原作者所有。


发表评论 取消回复