基本环境
documentclass[border=10pt]{standalone}
usepackage{pgfplots}
usepgfplotslibrary{polar,colormaps}	% polar: 极坐标, colormaps: 颜色
begin{document}
begin{tikzpicture}
  begin{polaraxis}[	% 极坐标申明
      domain  = -14400:14400,	% 区间
      samples = 5000,	% 数量
      colormap/cool,
      hide axis				% 坐标轴隐藏
    ]
    content
  end{polaraxis}
end{tikzpicture}
end{document}
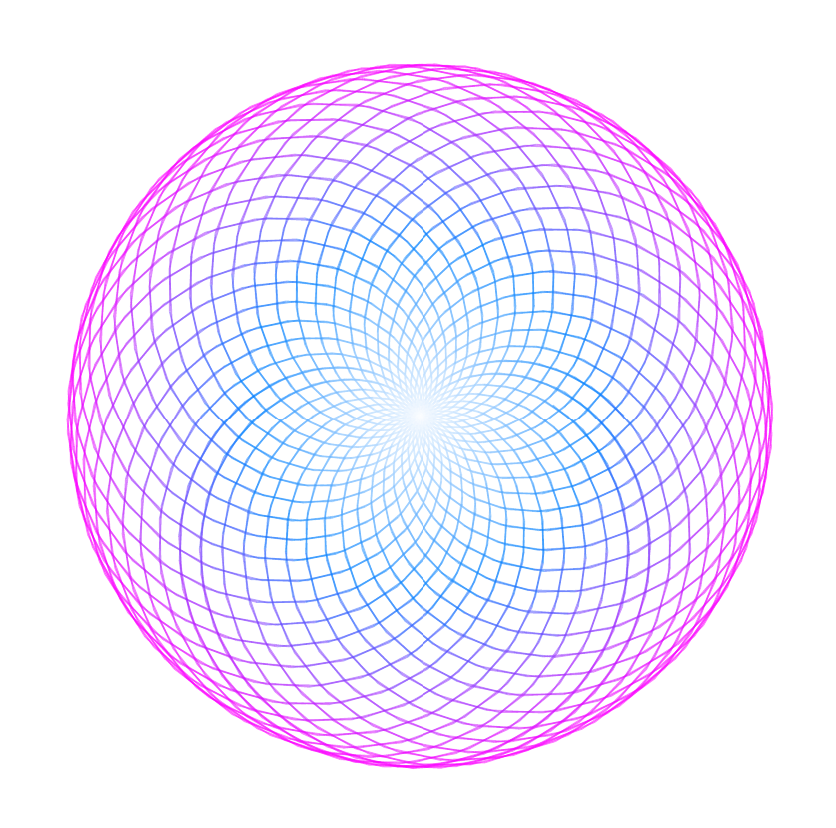
原例
begin{polaraxis}[
	domain=-14400:14400,
	samples=3000,
	colormap/cool,
	hide axis
]
addplot[no markers, mesh, opacity=0.5]{1 - sin(x * 40 / 39)};
end{polaraxis}
变体
f
(
x
)
=
1
−
s
i
n
(
x
)
f(x) = 1 - sin(x)
f(x)=1−sin(x)
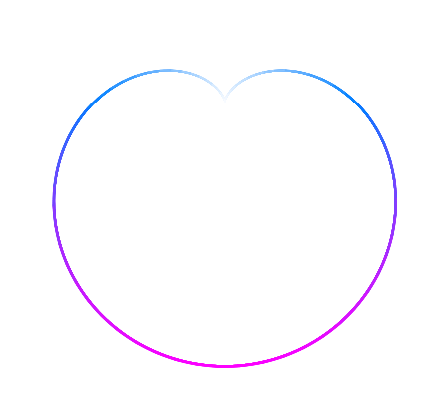
都是基于基础图像进行偏移
f
(
x
)
=
1
−
s
i
n
(
0.999
x
)
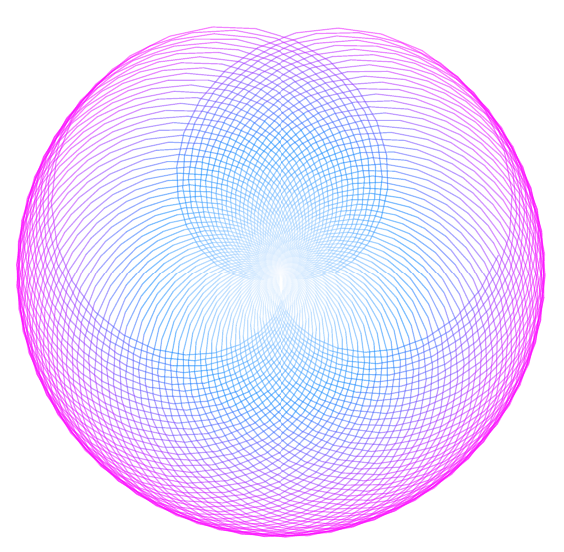
f(x) = 1 - sin(0.999x)
f(x)=1−sin(0.999x)

比例容易周期,就缝就特别大
f
(
x
)
=
1
−
s
i
n
(
0.99
x
)
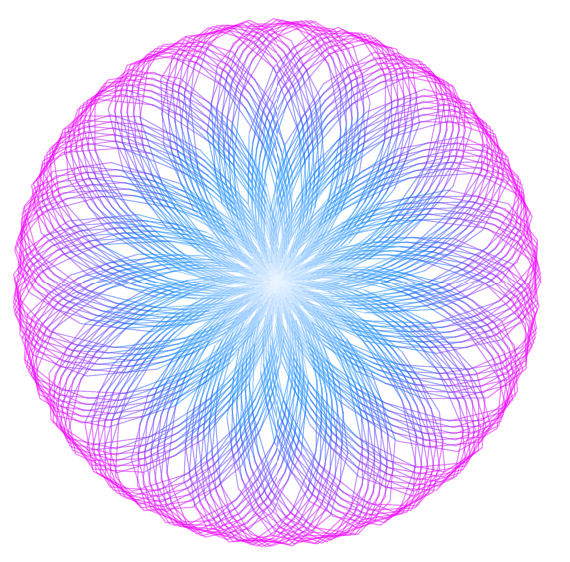
f(x) = 1 - sin(0.99x)
f(x)=1−sin(0.99x)
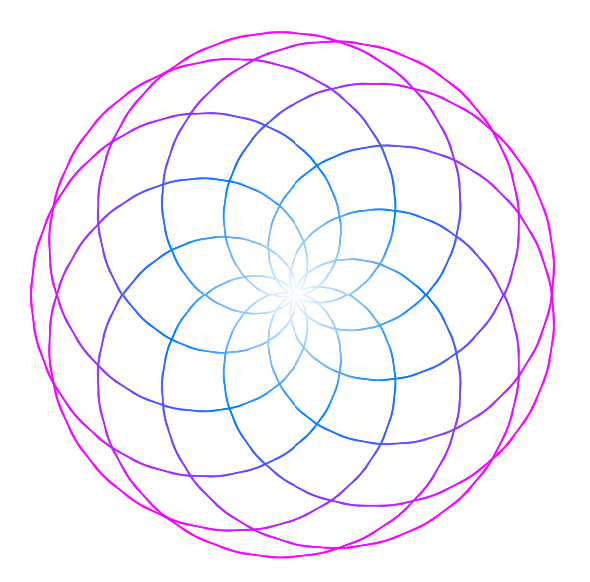
单周期,多变化就很好看
f ( x ) = 1 − s i n ( 0.99 x ) f(x) = 1- sin(0.99x) f(x)=1−sin(0.99x)
无周期
f
(
x
)
=
1
−
s
i
n
(
π
x
)
f(x) = 1 - sin(pi x)
f(x)=1−sin(πx)
整数控制间隔,小数抖动描边
f
(
x
)
=
1
−
s
i
n
(
3.004
x
)
f(x) = 1 - sin(3.004 x)
f(x)=1−sin(3.004x)

f ( x ) = 1 − s i n ( 7.002 x ) f(x) = 1 - sin(7.002x) f(x)=1−sin(7.002x)
f
(
x
)
=
1
−
s
i
n
(
7.00009
x
)
f(x) = 1-sin(7.00009x)
f(x)=1−sin(7.00009x)

描边越细,边缘越柔和
创建
documentclass[border=10pt]{standalone}
usepackage{pgfplots}
usepgfplotslibrary{polar,colormaps}
begin{document}
begin{tikzpicture}
  begin{polaraxis}[
      domain  = -14400:14400,
      samples = 3000,
      colormap/cool,
      hide axis
    ]
 addplot[no markers, mesh, opacity=0.5]{sin(x) *cos(x)};
  end{polaraxis}
end{tikzpicture}
end{document}

描边增粗
f
(
x
)
=
s
i
n
(
0.999
x
)
c
o
s
(
x
)
f(x) = sin(0.999x)cos(x)
f(x)=sin(0.999x)cos(x)

f
(
x
)
=
s
i
n
(
x
)
c
o
s
(
0.999
x
)
f(x) = sin(x)cos(0.999x)
f(x)=sin(x)cos(0.999x)

f
(
x
)
=
s
i
n
(
0.999
x
)
c
o
s
(
0.999
x
)
f(x) = sin(0.999x)cos(0.999x)
f(x)=sin(0.999x)cos(0.999x)

间隔分瓣
f
(
x
)
=
s
i
n
(
3
x
)
c
o
s
(
3
x
)
f(x)=sin(3x)cos(3x)
f(x)=sin(3x)cos(3x)

分瓣描边
f
(
x
)
=
s
i
n
(
1.999
x
)
c
o
s
(
1.999
x
)
f(x)=sin(1.999x)cos(1.999x)
f(x)=sin(1.999x)cos(1.999x)

f
(
x
)
=
s
i
n
(
7.3
x
)
c
o
s
(
3.3
x
)
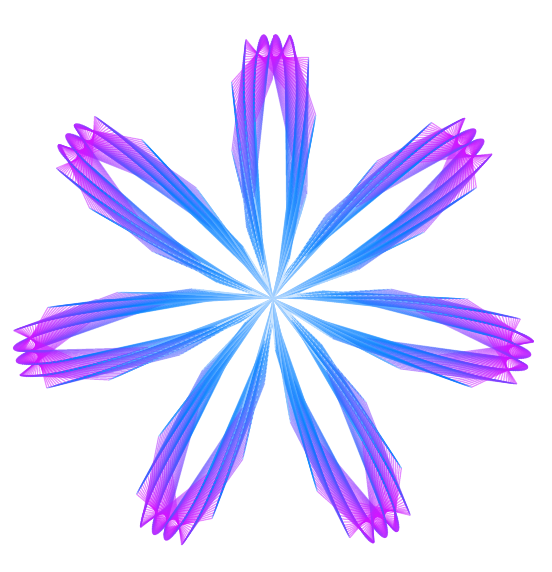
f(x)=sin(7.3x)cos(3.3x)
f(x)=sin(7.3x)cos(3.3x)

形态变换
f ( x ) = s i n ( π x ) c o s ( π x ) f(x)=sin(pi x)cos(pi x) f(x)=sin(πx)cos(πx)
小数描边
中间太密集,转换一下
f
(
x
)
=
1
−
s
i
n
(
π
x
)
c
o
s
(
π
x
)
f(x) = 1 - sin(pi x) cos(pi x)
f(x)=1−sin(πx)cos(πx)
f
(
x
)
=
1
−
s
i
n
(
7.3
x
)
c
o
s
(
3.3
x
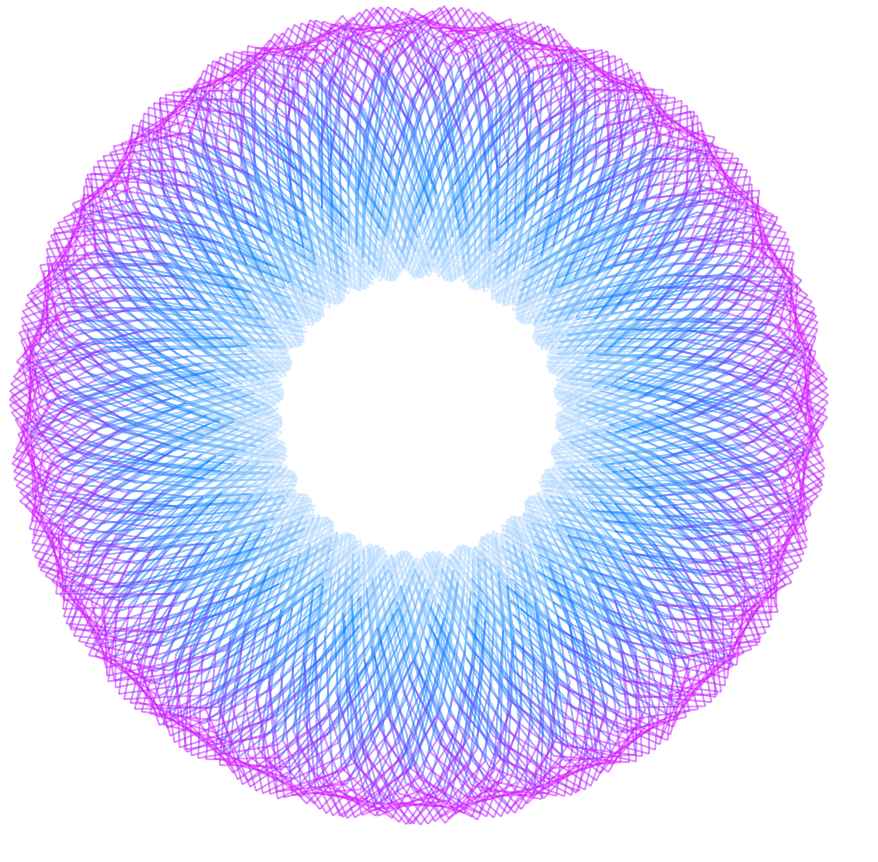
)
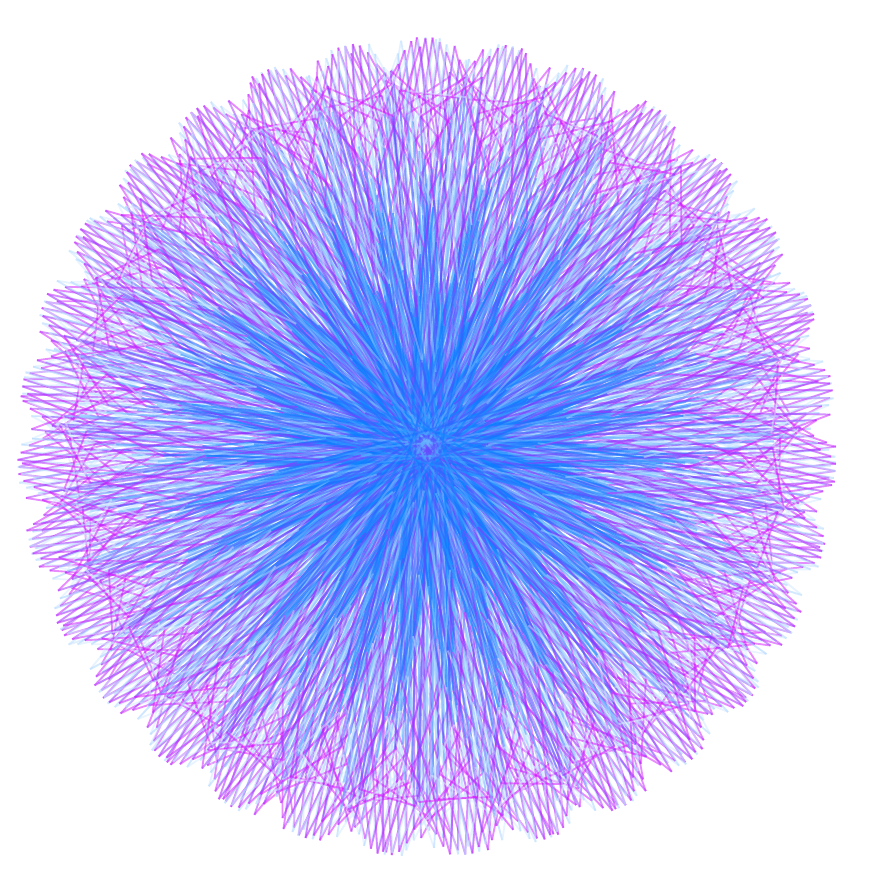
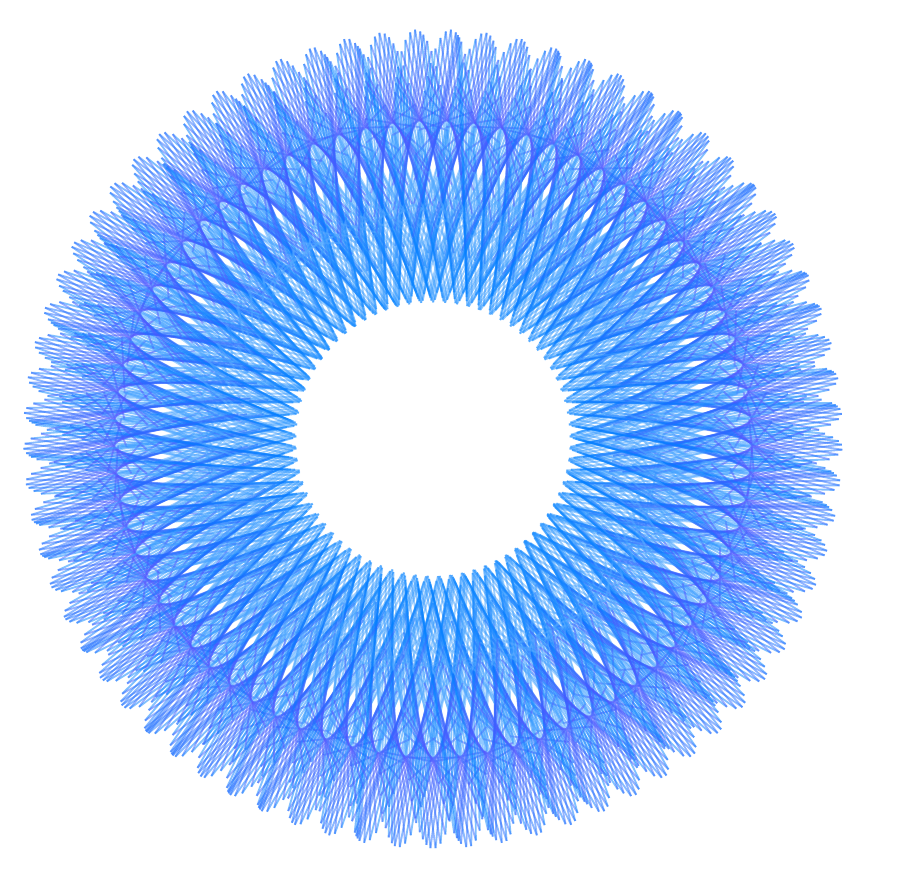
f(x) = 1 - sin(7.3x)cos(3.3x)
f(x)=1−sin(7.3x)cos(3.3x)

f
(
x
)
=
1
−
s
i
n
(
7.3
x
)
c
o
s
(
7.3
x
)
f(x) = 1 - sin(7.3x)cos(7.3x)
f(x)=1−sin(7.3x)cos(7.3x)
最后
以上就是含蓄蛋挞最近收集整理的关于latex-pgfplots简单绘图基本环境原例创建形态变换的全部内容,更多相关latex-pgfplots简单绘图基本环境原例创建形态变换内容请搜索靠谱客的其他文章。


发表评论 取消回复