在讲解了 Hystrix Dashboard 之后,我们知道了,Hystrix Dashboard 实现的是单节点模式,一次只能监控一个服务,当有很多服务的时候,这样单节点模式去监控,就需要打开多个浏览器窗口,显然这是很麻烦的。这个时候,我们就可以用到 Spring Cloud 的另一个组件 Turbine,它可以聚合多个服务的 Hystrix Dashboard 的数据用以显示。
下面就开始搭建Turbine,依然是基于之前项目:之前项目内容:断路器仪表盘实现
一、建立Turbine module
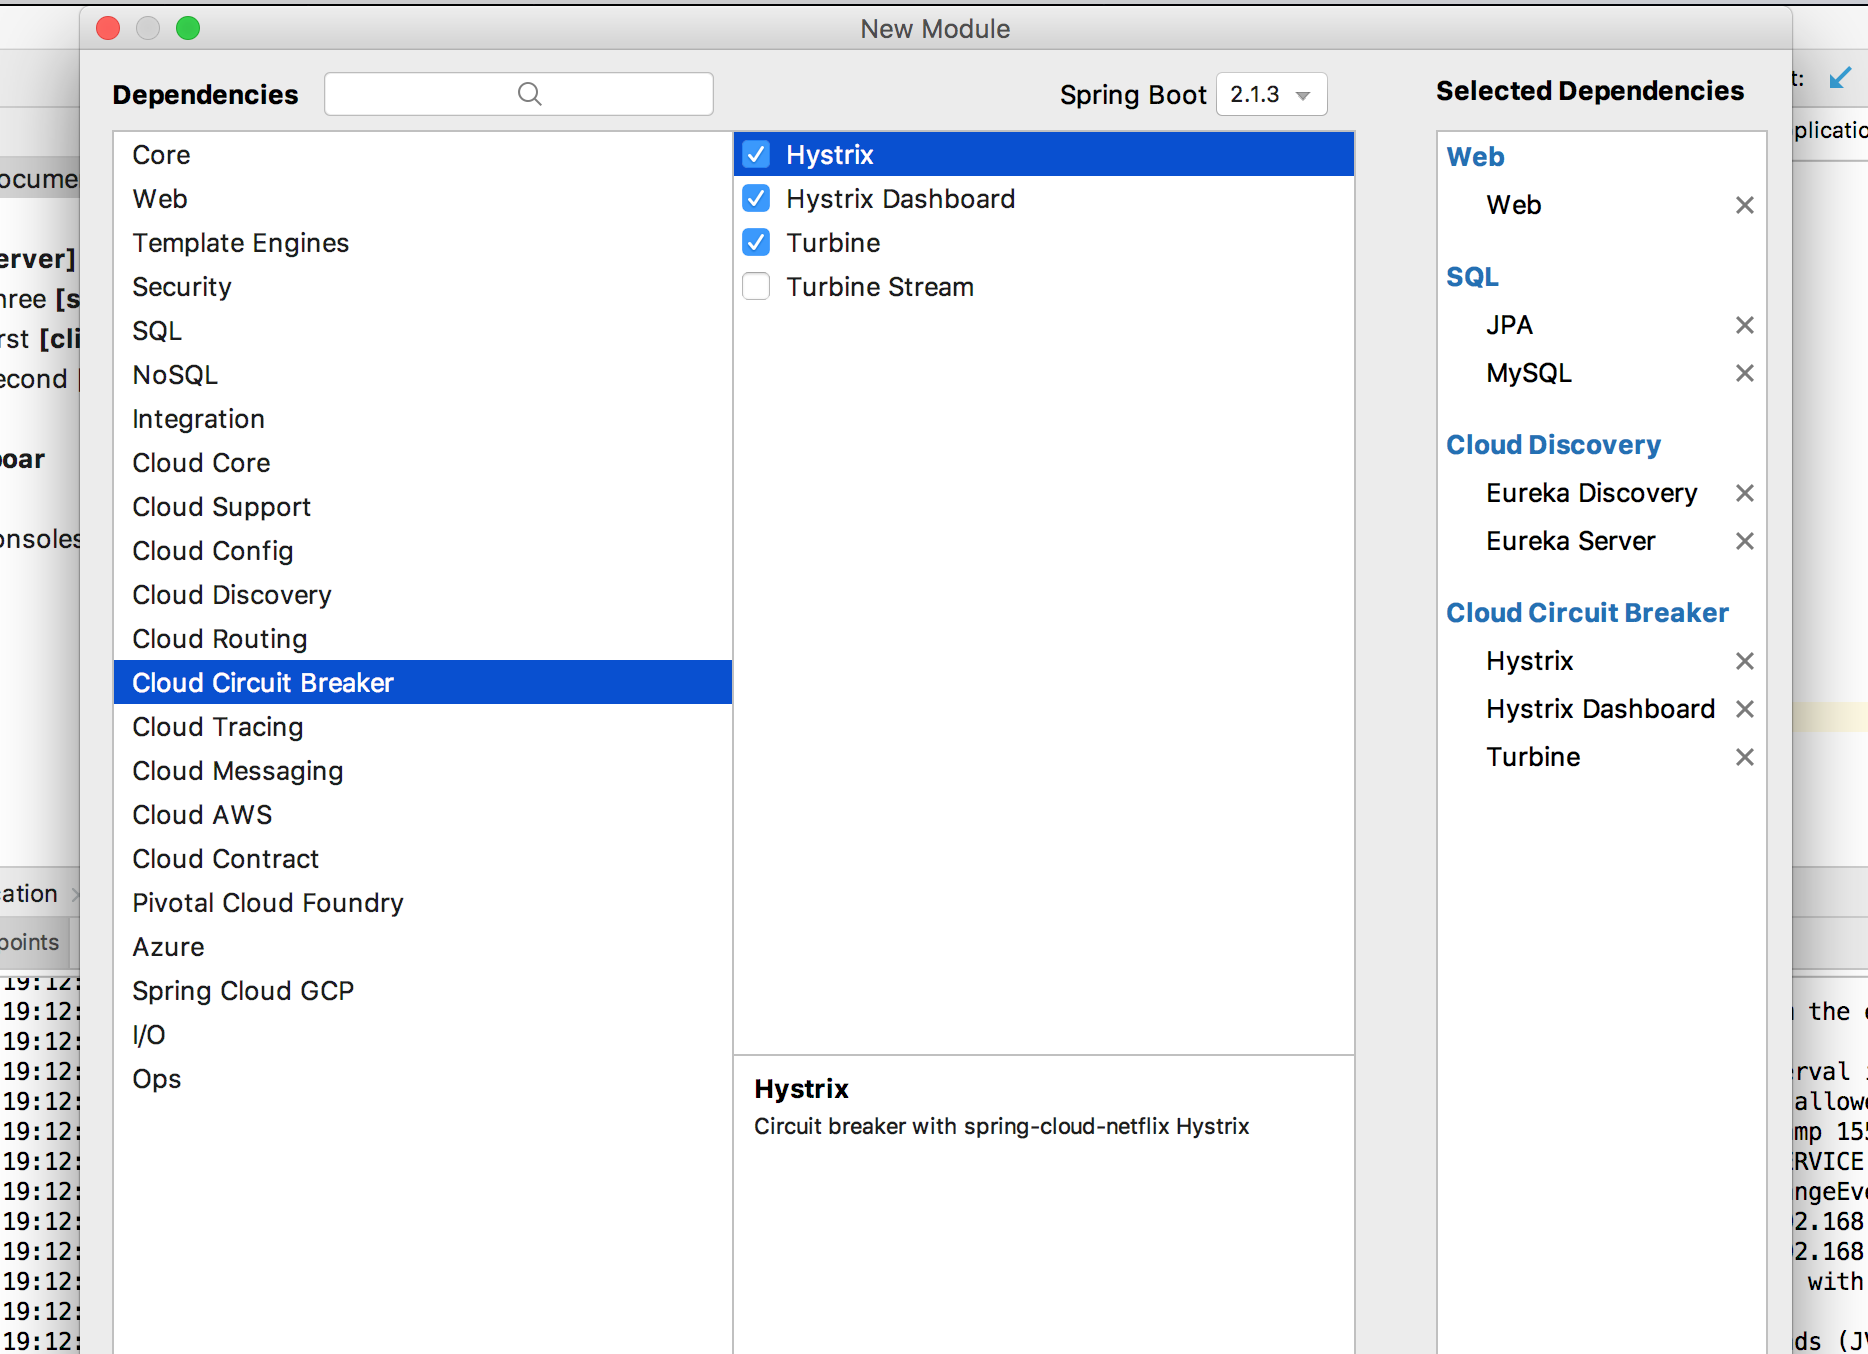
还是使用idea选择建立:项目中eureka discovery,hystrix dashboard,turbine都得选上
在启动类加上注解: @EnableDiscoveryClient @EnableTurbine @EnableHystrixDashboard
package com.cloud.hystrixturbine;

import org.springframework.boot.SpringApplication;
import org.springframework.boot.autoconfigure.SpringBootApplication;
import org.springframework.cloud.client.discovery.EnableDiscoveryClient;
import org.springframework.cloud.netflix.hystrix.dashboard.EnableHystrixDashboard;
import org.springframework.cloud.netflix.turbine.EnableTurbine;

@SpringBootApplication
@EnableDiscoveryClient
@EnableTurbine
@EnableHystrixDashboard
public class HystrixTurbineApplication {

	public static void main(String[] args) {
		SpringApplication.run(HystrixTurbineApplication.class, args);
	}

}
配置文件application.properties内容:
#应用名称
spring.application.name=HYSTRIX-TUIBINE

#端口号
server.port=10040

#指定注册中心地址
eureka.client.service-url.defaultZone=http://localhost:12345/eureka/
# 启用ip配置 这样在注册中心列表中看见的是以ip+端口呈现的
eureka.instance.prefer-ip-address=true
# 实例名称  最后呈现地址:ip:2000
eureka.instance.instance-id=${spring.cloud.client.ip-address}:${server.port}

#turbine配置
# 需要监控的应用名称,默认逗号隔开,内部使用Stringutils.commaDelimitedListToStringArray分割
turbine.app-config= SPRING-CLIENT-02,SPRING-FEIGN-SERVICE
turbine.aggregator.cluster-config= default
# 集群名称
turbine.cluster-name-expression="default"
# true 同一主机上的服务通过host和port的组合来进行区分,默认为true
# false 时 在本机测试时 监控中host集群数会为1了 因为本地host是一样的
turbine.combine-host-port=true

management.endpoints.web.exposure.include= '*'
management.endpoint.health.show-details= ALWAYS

spring.datasource.url=jdbc:mysql://127.0.0.1:3306/testmysql
spring.datasource.username=root
spring.datasource.password=123456
spring.datasource.driver-class-name=com.mysql.jdbc.Driver
spring.datasource.max-idle=10
spring.datasource.max-wait=10000
spring.datasource.min-idle=5
spring.datasource.initial-size=5
然后依次启动eureka server,client,ribbon,feign和上面的 Turbine项目。
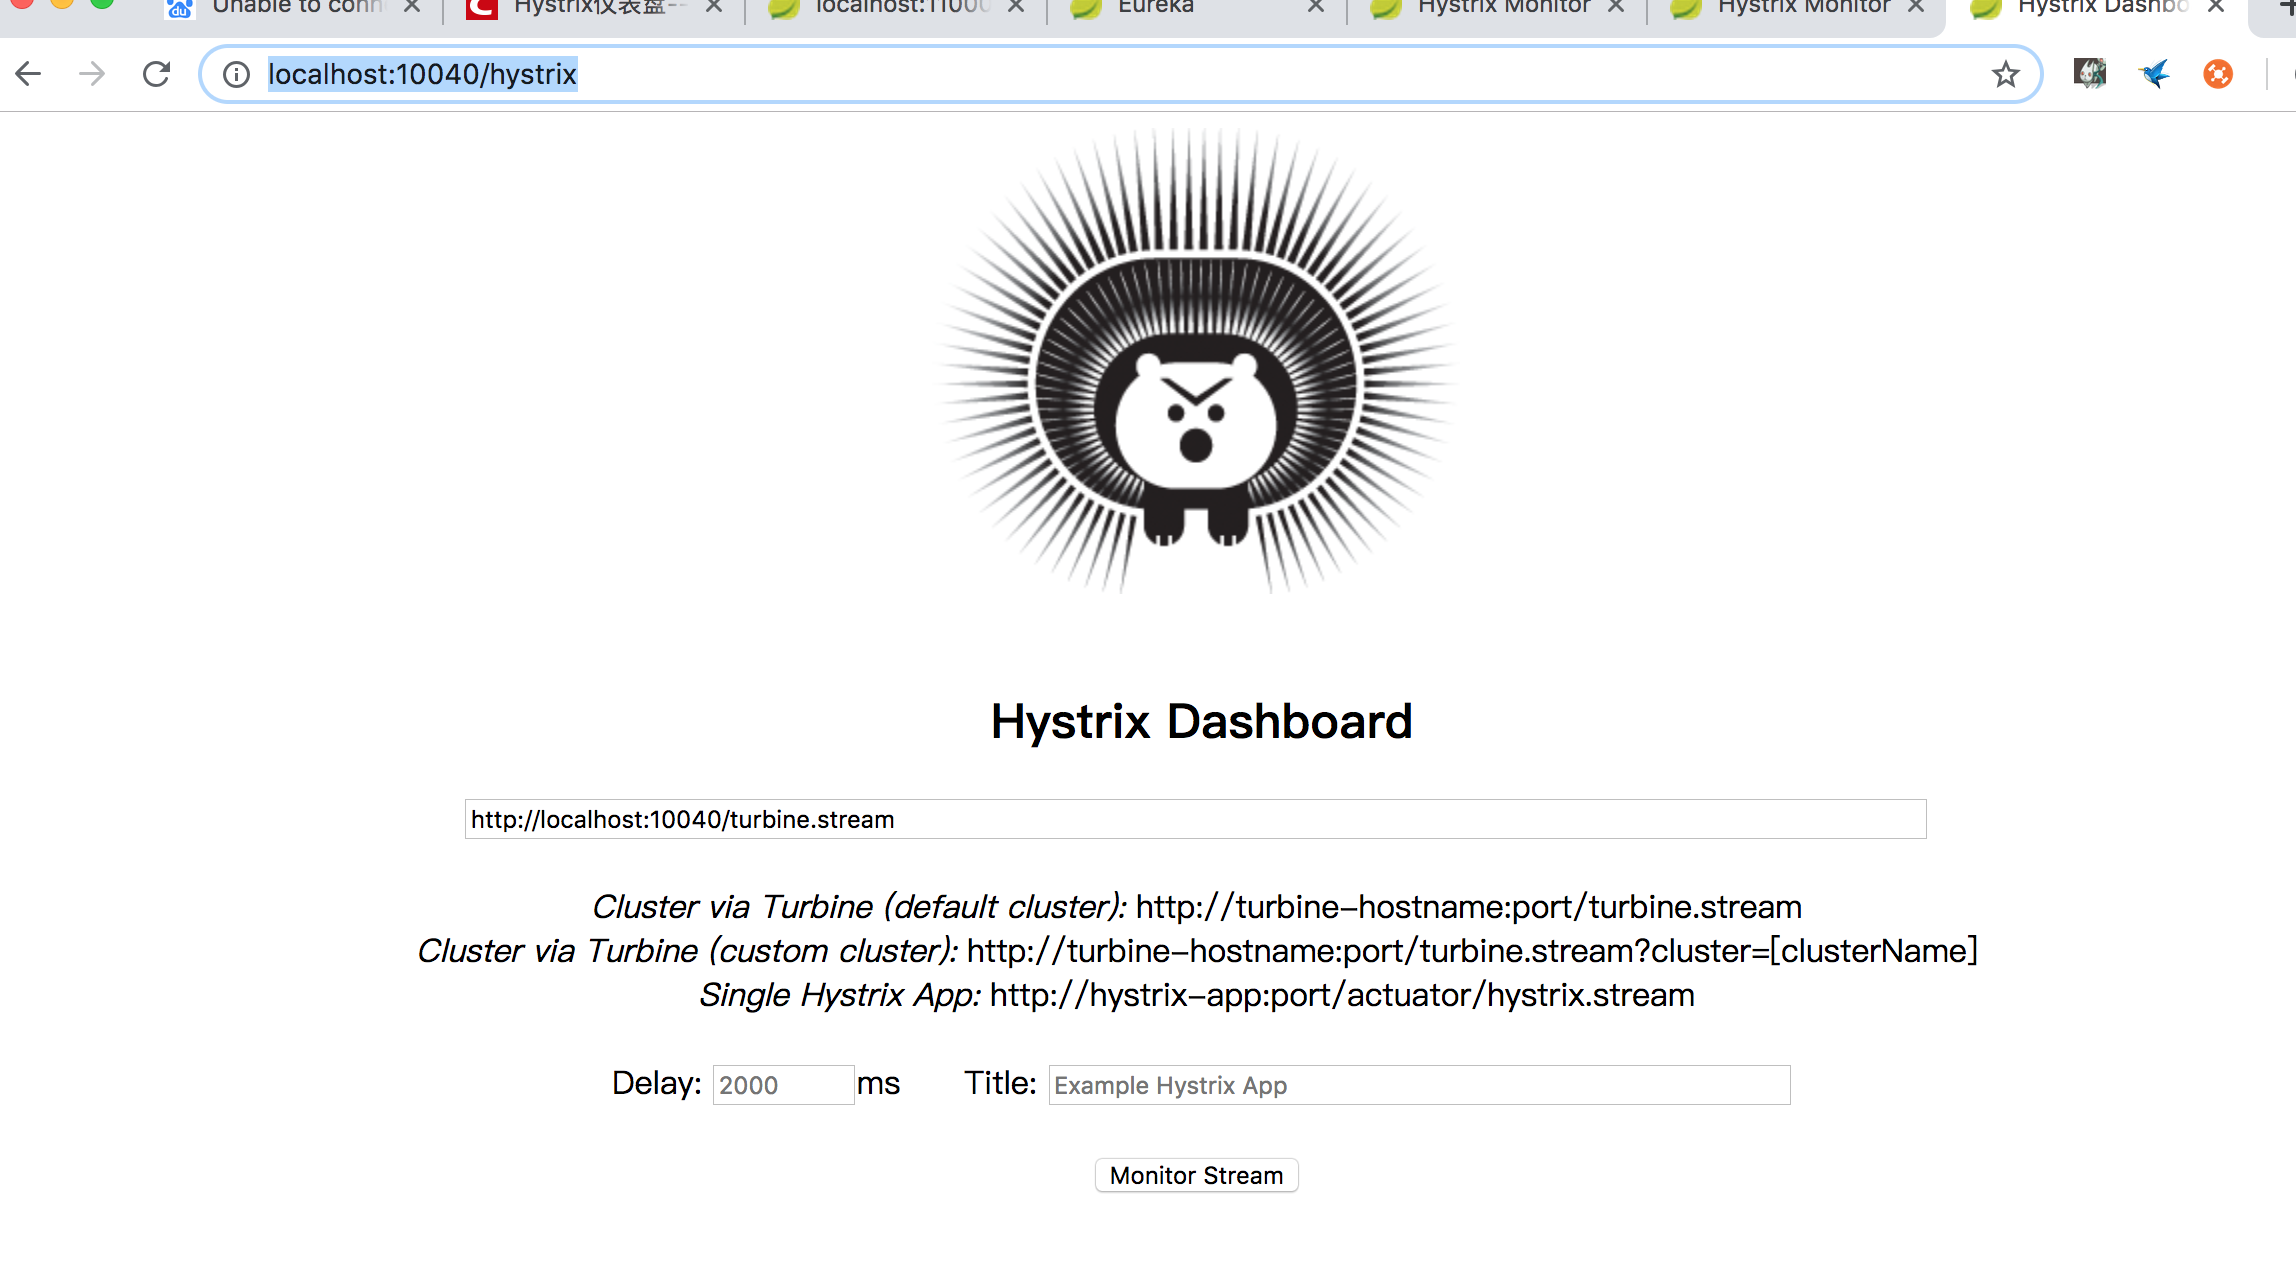
这边配置的端口是在10040,在浏览器中输入地址:
http://localhost:10040/hystrix可以看到聚合仪表盘界面:
然后先调用下ribbon和freign中的服务。
再在长条里面输入监控地址:
http://localhost:10040/turbine.stream
这个和Hystrix Dashboard仪表盘不一样,这个是输入Turbine自己的端口号,仪表盘是输入监控的端口号。
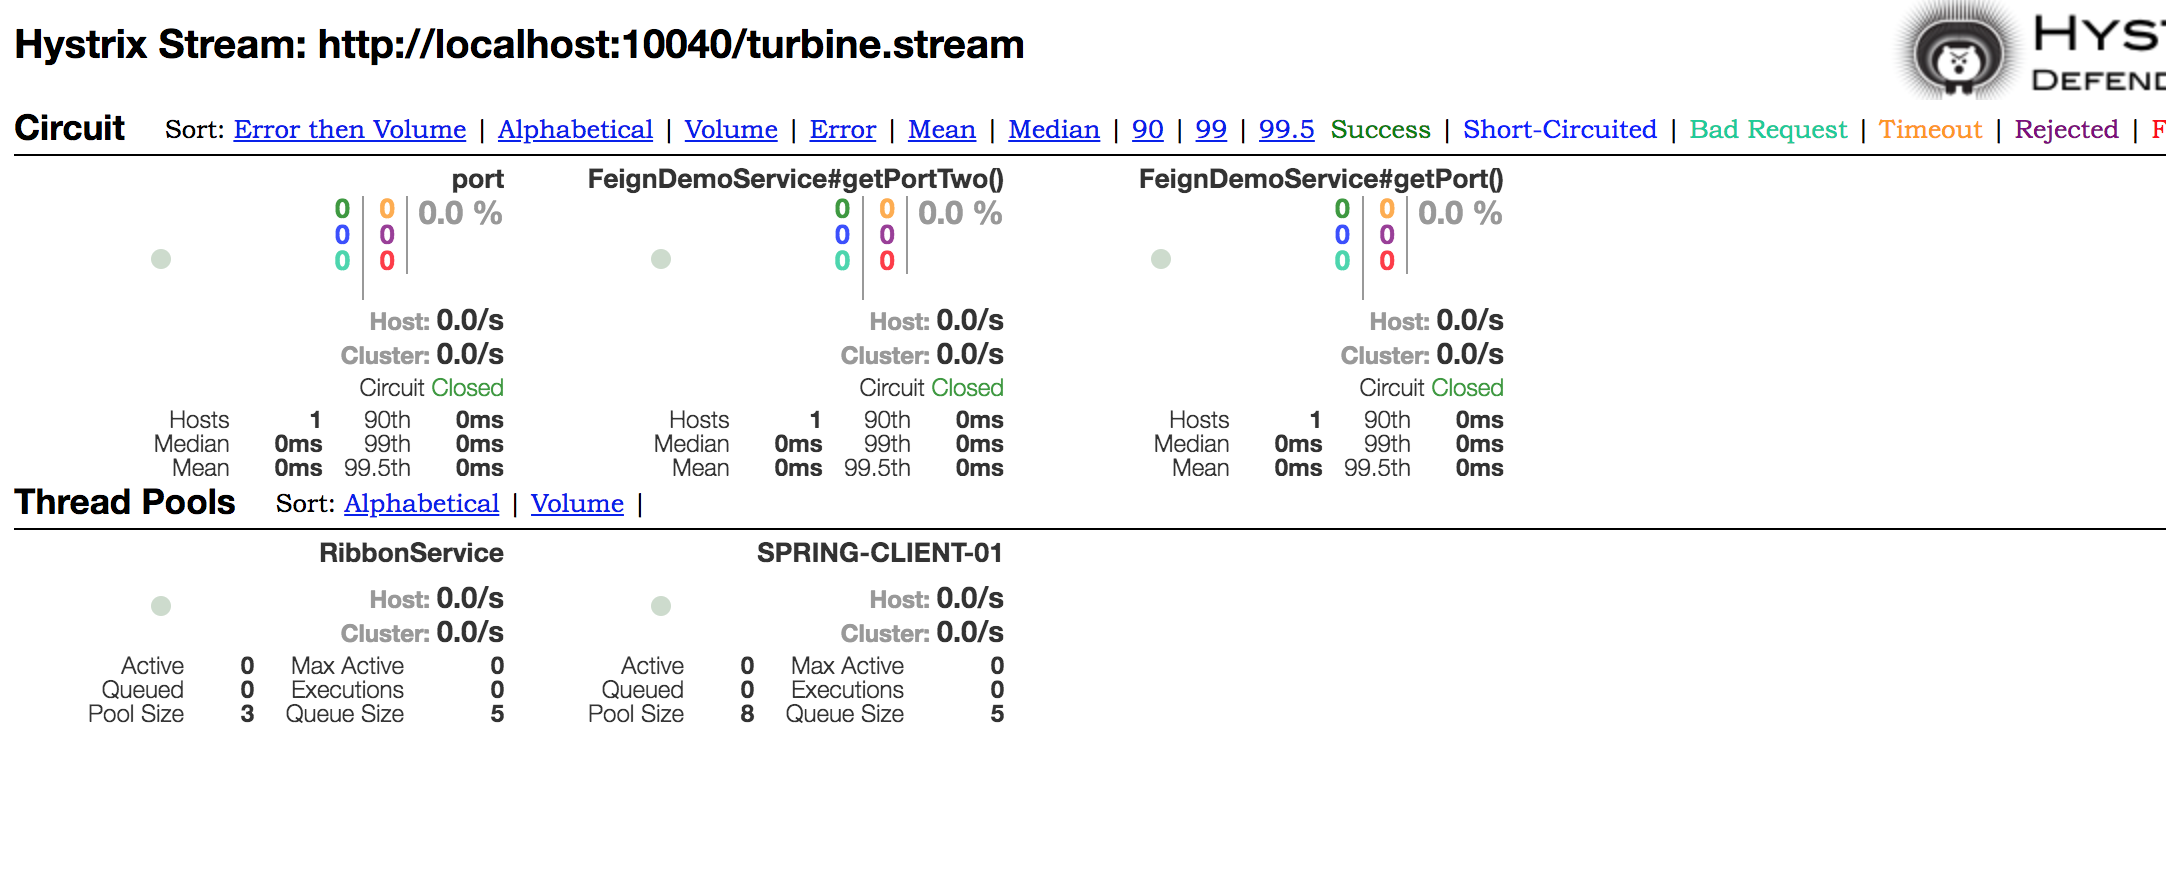
显示结果界面:
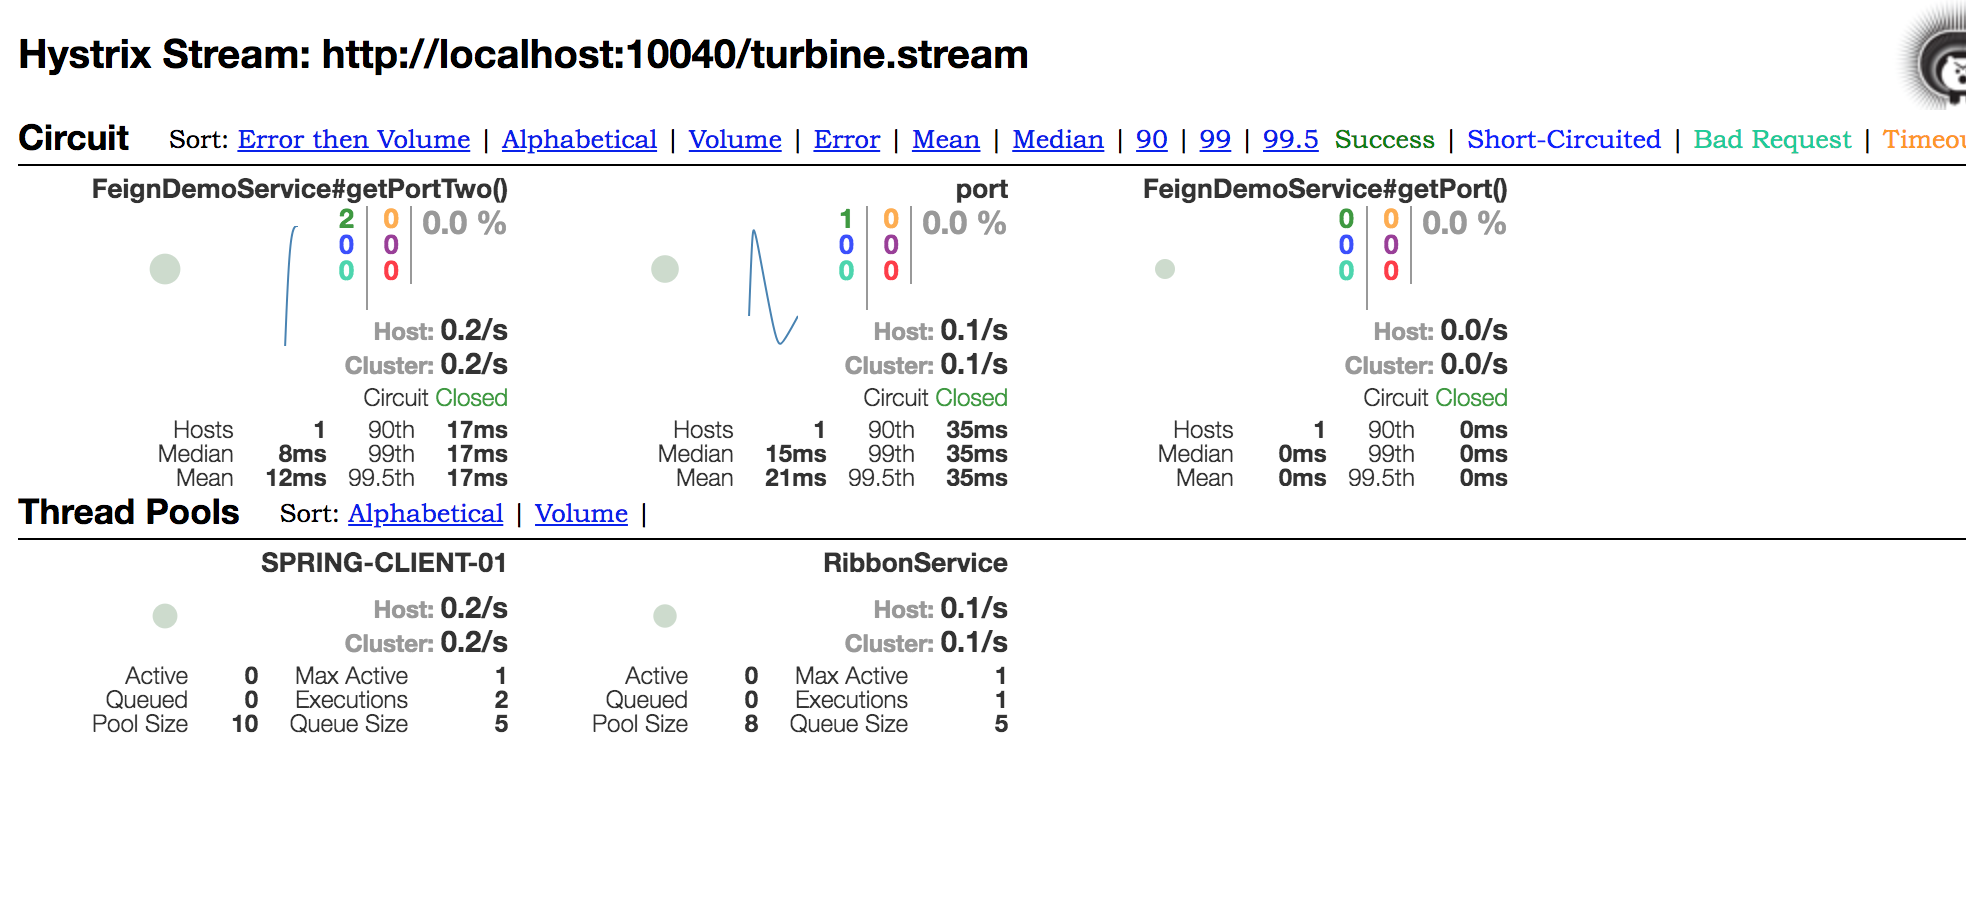
继续调用ribbon服务和feign服务。可以看到服务变化的图:
以上代码github地址:源码地址
最后
以上就是虚拟路人最近收集整理的关于springCloud 断路器聚合监控Hystrix Turbine搭建的全部内容,更多相关springCloud内容请搜索靠谱客的其他文章。

一、为什么用断路器。二、Hystrix 断路器的配置。三、创建子工程 linze-turbine-service 断路器聚合监控微服务。](https://www.shuijiaxian.com/files_image/reation/bcimg15.png)


发表评论 取消回复