断路器聚合监控Hystrix Turbine
- 1. 概述
- 2. 步骤
- 2.1 新建工程hystrix-dashboard2
- 2.2 新建工程service-turbine
- 2.3 配置工程service-turbine
- 2.4 启动顺序
- 3. 指标说明
1. 概述
当我们有很多个服务的时候,这就需要聚合所以服务的Hystrix Dashboard的数据了。这就需要用到Spring Cloud的另一个组件了,即Hystrix Turbine。看单个的Hystrix Dashboard的数据并没有什么多大的价值,要想看这个系统的Hystrix Dashboard数据就需要用到Hystrix Turbine。Hystrix Turbine将每个服务Hystrix Dashboard数据进行了整合。
2. 步骤
本例子利用章节《断路器监控(Hystrix Dashboard)》中的工程hystrix-dashboard,作为其中一个断路器。同时也利用章节《服务注册中心Eureka》中的工程eureka-server作为注册中心。
2.1 新建工程hystrix-dashboard2
新建一个hystrix-dashboard2的工程,配置与hystrix-dashboard基本一样,只是端口为8771,服务名称为service-hystrixdashboard2。配置可以参考如下:
server:
  port: 8771

spring:
  application:
    name: service-hystrixdashboard2

eureka:
  client:
    serviceUrl:
      defaultZone: http://localhost:8761/eureka/

management:
  endpoints:
    web:
      exposure:
        include: "*"
      cors:
        allowed-origins: "*"
        allowed-methods: "*"
2.2 新建工程service-turbine
建一个maven的module工程,名称为hystrix-dashboard,父亲pom为springcloud。pom引入netflix-hystrix、netflix-hystrix-dashboard和netflix-turbine的jar,如下:
<?xml version="1.0"?>
<project
	xsi:schemaLocation="http://maven.apache.org/POM/4.0.0 http://maven.apache.org/xsd/maven-4.0.0.xsd"
	xmlns="http://maven.apache.org/POM/4.0.0" xmlns:xsi="http://www.w3.org/2001/XMLSchema-instance">
	<modelVersion>4.0.0</modelVersion>
	<parent>
		<groupId>com.lin</groupId>
		<artifactId>springcloud</artifactId>
		<version>0.0.1-SNAPSHOT</version>
	</parent>
	<groupId>com.lin</groupId>
	<artifactId>service-turbine</artifactId>
	<version>0.0.1-SNAPSHOT</version>
	<name>service-turbine</name>
	<url>http://maven.apache.org</url>
	<dependencies>
		<dependency>
			<groupId>junit</groupId>
			<artifactId>junit</artifactId>
			<version>3.8.1</version>
			<scope>test</scope>
		</dependency>
		<dependency>
			<groupId>org.springframework.cloud</groupId>
			<artifactId>spring-cloud-starter-netflix-eureka-client</artifactId>
		</dependency>
		<dependency>
			<groupId>org.springframework.boot</groupId>
			<artifactId>spring-boot-starter-web</artifactId>
		</dependency>
		<dependency>
			<groupId>org.springframework.boot</groupId>
			<artifactId>spring-boot-starter-actuator</artifactId>
		</dependency>
		<dependency>
			<groupId>org.springframework.cloud</groupId>
			<artifactId>spring-cloud-starter-netflix-hystrix</artifactId>
		</dependency>
		<dependency>
			<groupId>org.springframework.cloud</groupId>
			<artifactId>spring-cloud-starter-netflix-hystrix-dashboard</artifactId>
		</dependency>
		<dependency>
			<groupId>org.springframework.cloud</groupId>
			<artifactId>spring-cloud-starter-netflix-turbine</artifactId>
		</dependency>
	</dependencies>
</project>
2.3 配置工程service-turbine
建立一个resources文件夹,在其下面新建一个application.yml文件,配置如下:
server:
  port: 8772

spring:
  application:
    name: service-turbine

eureka:
  client:
    serviceUrl:
      defaultZone: http://localhost:8761/eureka/
management:
  endpoints:
    web:
      exposure:
        include: "*"
      cors:
        allowed-origins: "*"
        allowed-methods: "*"

turbine:
  app-config: service-hystrixdashboard,service-hystrixdashboard2
  aggregator:
    clusterConfig: default
  clusterNameExpression: new String("default")
  combine-host: true
  instanceUrlSuffix:
default: actuator/hystrix.stream
2.4 启动顺序
先启动注册中心eureka-server,再启动hystrix-dashboard和hystrix-dashboard2,最后启动service-turbine
查看结果
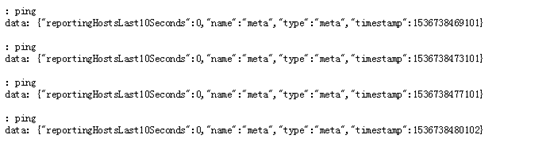
1) 打开网页http://localhost:8772/turbine.stream,可以看到数据发送结果:
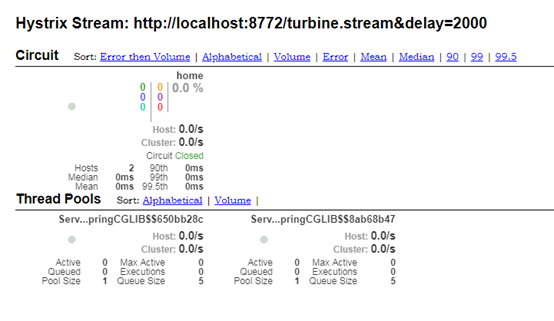
2) 打开网页http://localhost:8770/hystrix/或者http://localhost:8771/hystrix/,可以看到2个监测板内容
3. 指标说明
与章节《断路器监控(Hystrix Dashboard)》中的指标说明一样。
本文参考文献:https://blog.csdn.net/forezp/article/details/70148833/
最后
以上就是昏睡大炮最近收集整理的关于Spring cloud学习笔记7-断路器聚合监控(Hystrix Turbine)1. 概述2. 步骤3. 指标说明的全部内容,更多相关Spring内容请搜索靠谱客的其他文章。


发表评论 取消回复