本文的的工程栗子,来源于该文章的栗子,在它的基础上进行改造。
开始改造service-hi
在pom的工程文件引入相应的依赖:
<dependency>
            <groupId>org.springframework.boot</groupId>
            <artifactId>spring-boot-starter-actuator</artifactId>
        </dependency>

        <dependency>
            <groupId>org.springframework.cloud</groupId>
            <artifactId>spring-cloud-starter-hystrix-dashboard</artifactId>
        </dependency>
        <dependency>
            <groupId>org.springframework.cloud</groupId>
            <artifactId>spring-cloud-starter-hystrix</artifactId>
        </dependency>
在程序的入口ServiceHiApplication类,加上@EnableHystrix注解开启断路器,这个是必须的,并且需要在程序中声明断路点HystrixCommand;加上@EnableHystrixDashboard注解,开启HystrixDashboard
@EnableEurekaClient
@RestController
@SpringBootApplication
@EnableHystrix //开启断路器
@EnableHystrixDashboard //开启断路器图形界面
public class ClientApplication {

    public static void main(String[] args) {
        SpringApplication.run(ClientApplication.class, args);
    }

    @Value("${server.port}")
    String port;

    @RequestMapping("/hi")
    @HystrixCommand(fallbackMethod = "hiError")//声明断路点
    public String home(@RequestParam String name) {
        return "hi " + name + ",I am from port:" + port;
    }

    public String hiError(String name) {
        return "hi," + name + ",sorry,error!";
    }
}
运行程序: 依次开启server 和service-hi.
Hystrix Dashboard图形展示
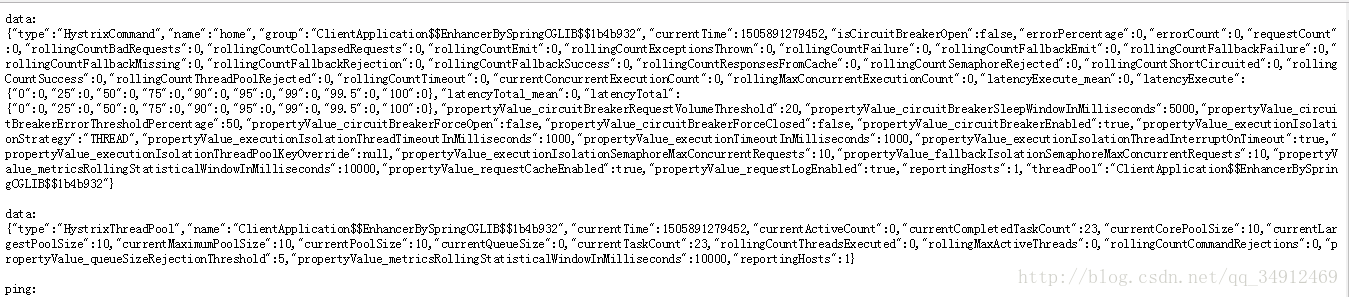
打开http://localhost:8762/hystrix.stream,可以看到一些具体的数据:
输入 http://localhost:8762/hi?name=wh
打开locahost:8762/hystrix 可以看见以下界面:
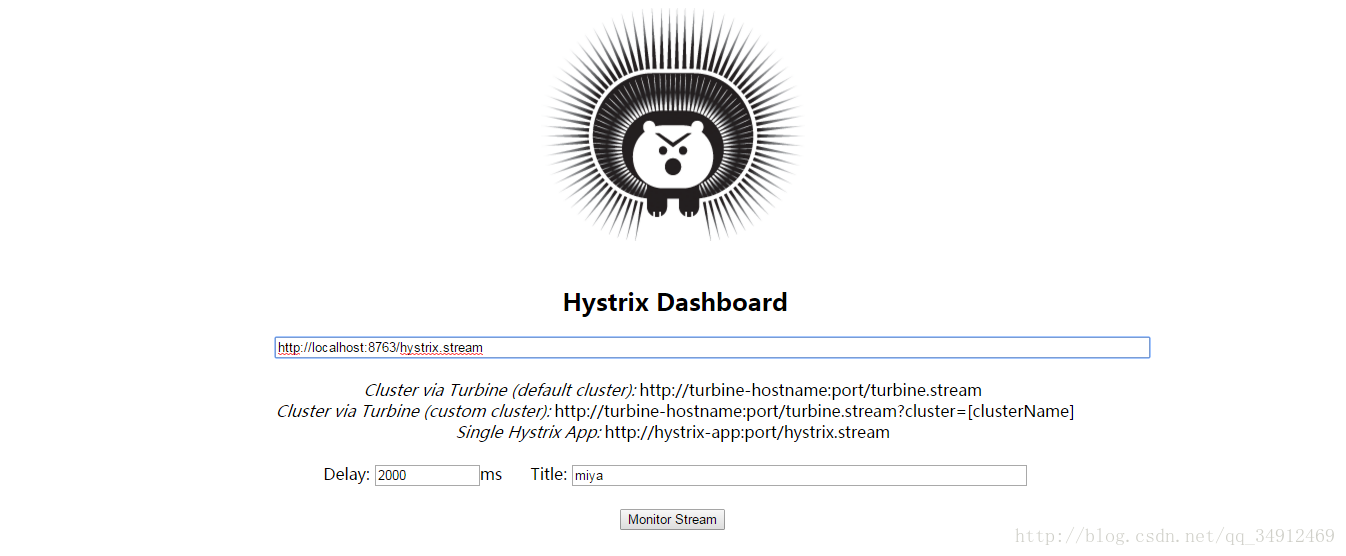
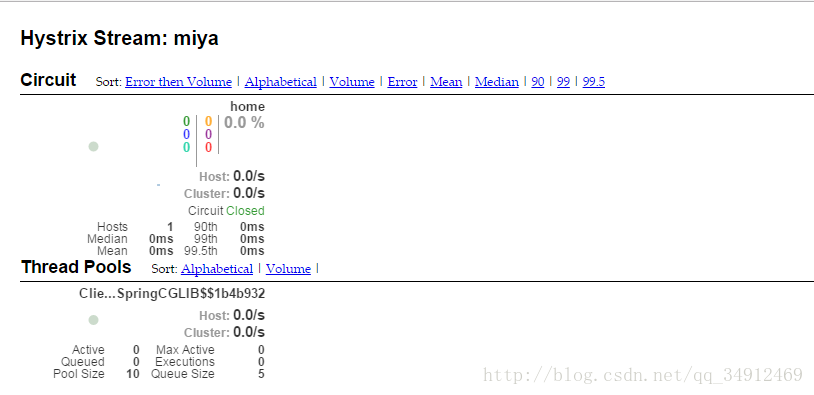
在界面依次输入:locahost:8762/hystrix.stream 、2000 、miya
当我们有很多个服务的时候,这就需要聚合所以服务的Hystrix Dashboard的数据了。这就需要用到Spring Cloud的另一个组件了,即Hystrix Turbine。
Hystrix Turbine简介
看单个的Hystrix Dashboard的数据并没有什么多大的价值,要想看这个系统的Hystrix Dashboard数据就需要用到Hystrix Turbine。Hystrix Turbine将每个服务Hystrix Dashboard数据进行了整合。Hystrix Turbine的使用非常简单,只需要引入相应的依赖和加上注解和配置就可以了。
准备工作
对使用的工程进行改造。因为我们需要多个服务的Dashboard,所以需要再建一个服务,取名为service-la,它的基本配置同service-hi,在这里就不详细说明。
service-la配置文件:
eureka:
  client:
    serviceUrl:
      defaultZone: http://localhost:8761/eureka/
server:
  port: 8762
spring:
  application:
    name: service-la #在以后的服务与服务之间相互调用一般都是根据这个name
创建service-turbine
引入相应的依赖:
<dependencies>
        <dependency>
            <groupId>org.springframework.cloud</groupId>
            <artifactId>spring-cloud-starter-turbine</artifactId>
        </dependency>
        <dependency>
            <groupId>org.springframework.cloud</groupId>
            <artifactId>spring-cloud-netflix-turbine</artifactId>
        </dependency>
        <dependency>
            <groupId>org.springframework.boot</groupId>
            <artifactId>spring-boot-starter-actuator</artifactId>
        </dependency>

        <dependency>
            <groupId>org.springframework.boot</groupId>
            <artifactId>spring-boot-starter-test</artifactId>
            <scope>test</scope>
        </dependency>
    </dependencies>
在其入口类ServiceTurbineApplication加上注解@EnableTurbine,开启turbine,@EnableTurbine注解包含了@EnableDiscoveryClient注解,即开启了注册服务。
@SpringBootApplication
@EnableTurbine
public class ServiceTurbinApplication {

    public static void main(String[] args) {
//      SpringApplication.run(ServiceTurbinApplication.class, args);
        new SpringApplicationBuilder(ServiceTurbinApplication.class).web(true).run(args);
    }

}
配置文件application.yml:
spring:
  application.name: service-turbine
server:
  port: 8769
security.basic.enabled: false
turbine:
  aggregator:
    clusterConfig: default   # 指定聚合哪些集群,多个使用","分割,默认为default。可使用http://.../turbine.stream?cluster={clusterConfig之一}访问
  appConfig: service-hi,service-la  ### 配置Eureka中的serviceId列表,表明监控哪些服务
  clusterNameExpression: new String("default")
  # 1. clusterNameExpression指定集群名称,默认表达式appName;此时:turbine.aggregator.clusterConfig需要配置想要监控的应用名称
  # 2. 当clusterNameExpression: default时,turbine.aggregator.clusterConfig可以不写,因为默认就是default
  # 3. 当clusterNameExpression: metadata['cluster']时,假设想要监控的应用配置了eureka.instance.metadata-map.cluster: ABC,则需要配置,同时turbine.aggregator.clusterConfig: ABC
eureka:
  client:
    serviceUrl:
      defaultZone: http://localhost:8761/eureka/
Turbine演示
依次开启server、service-hi、service-la、service-turbine工程。
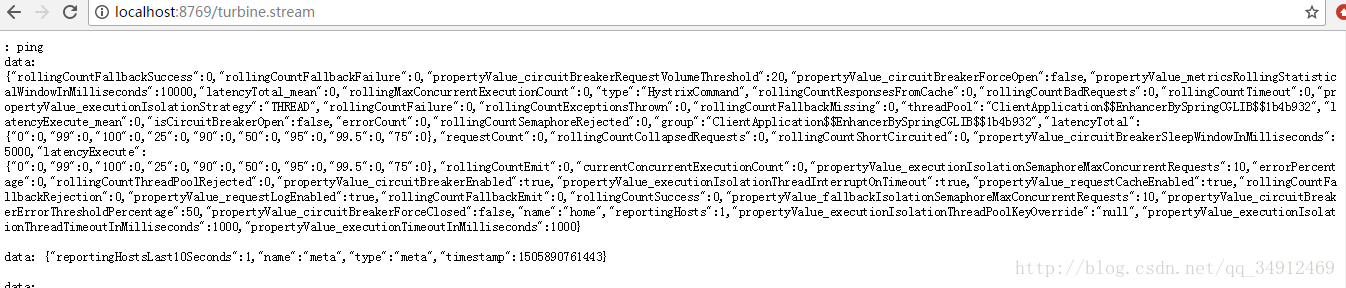
打开浏览器输入:http://localhost:8769/turbine.stream,界面如下:
依次请求:
http://localhost:8762/hi?name=wh
http://localhost:8763/hi?name=wh
打开:http://localhost:8763/hystrix,输入监控流http://localhost:8769/turbine.stream
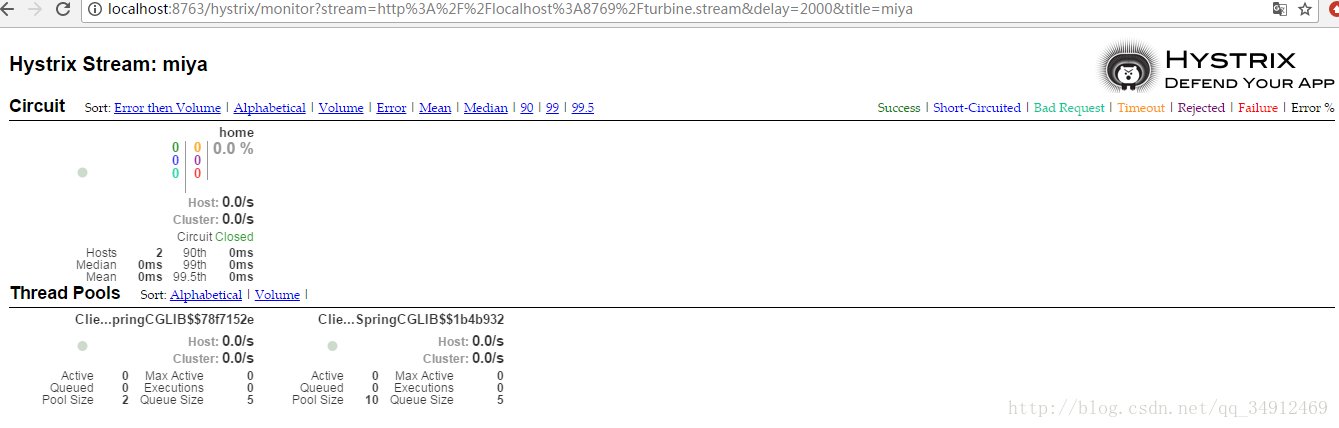
可以看到这个页面聚合了2个service的hystrix dashbord数据。
最后
以上就是腼腆云朵最近收集整理的关于SpringCloud: 断路器聚合监控(Hystrix Turbine)的全部内容,更多相关SpringCloud:内容请搜索靠谱客的其他文章。


一、为什么用断路器。二、Hystrix 断路器的配置。三、创建子工程 linze-turbine-service 断路器聚合监控微服务。](https://www.shuijiaxian.com/files_image/reation/bcimg15.png)


发表评论 取消回复