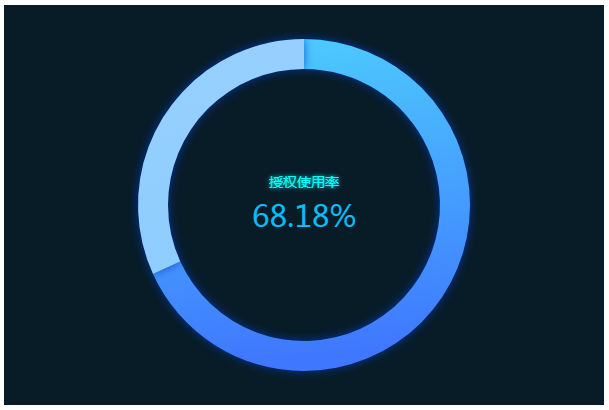
附链接:Echarts饼状图属性设置大全
代码如下:
<!DOCTYPE html>
<html>
<head>
    <meta charset="utf-8">
    <title>EChartsTest</title>
    <!-- 引入 echarts.js -->
	<script src="https://cdn.bootcss.com/echarts/4.2.1-rc1/echarts.min.js"></script>
</head>
<body>
    <!-- 为ECharts准备一个具备大小(宽高)的Dom -->
    <div id="main" style="width: 600px;height:400px;background-color:#143C50"></div>

    <script type="text/javascript">

        // 基于准备好的dom,初始化echarts实例
        var myChart = echarts.init(document.getElementById('main'));

		var option = {
        series: [
            {
                name: '',
                type: 'pie',
                radius: ['68%', '83%'], //半径
                avoidLabelOverlap: true, //是否启用防止标签重叠策略
                hoverAnimation: false,	  //是否开启 hover 在扇区上的放大动画效果
                color: ["#ff726b", "#87da76"], //默认色板:粉红色,绿色
                //设置值域标签
				label: {
                    normal: {
                        fontSize: '14',
                        position: 'center', //'outer'在饼图外,'inner'在饼图上,'center'在饼图中心
                        color: '#00FFFC',  //浅蓝色
                        // formatter: '{b}nn{d}%' // {b}:数据名; {c}:数据值; {d}:百分比
                        formatter: function (data) {
                            return '{name|' + data.name + '}nn{num|' + data.percent + '%}';
                        },
						//富文本编辑,用于设置文本样式
                        rich: {
                            name: {
                                color: '#00FFFC',
                                fontSize: '14',
                                textShadowColor: 'rgba(0,255,252,1)', //浅蓝绿色
                                textShadowBlur: '4' //文字光影模糊度,其实就是阴影外延出来的长度
                            },
                            num: {
                                color: '#06BEFF',  //亮蓝绿色
                                fontSize: '30'
                            }
                        }
                    },
                },
				//标签的指向线
                labelLine: {
                    normal: {
                        show: false
                    }
                },
                data: [
                    {
                        value: 60,
                        name: '授权使用率',
                        itemStyle: {
		//线性渐变,前四个参数分别是 x, y, x2, y2, 范围从 0 - 1,相当于百分比,如果 globalCoord 为'true',则该四个值是绝对的像素位置,
                            color: {
                                type: 'linear',
                                x: 0,
                                y: 0,
                                x2: .1,
                                y2: 1,
                                colorStops: [{
                                    offset: 0, color: '#4dcdfc' // 0% 处的颜色,蓝绿色
                                },
                                {
                                    offset: 1, color: '#3F77FE' // 100% 处的颜色,蓝色
                                }],
                                globalCoord: true // 缺省为 false
                            },
							shadowColor: 'rgba(0,62,198,0.75)', //饼图的阴影颜色(本例是环形图),宝蓝色
                            shadowBlur: 10 //光影模糊度,本质就是阴影外延出去的长度
                        }
                    }, {
                        value: 28,
                        name: '占位标签',
                        itemStyle: {
                            color: {
                                type: 'linear',
                                x: 0,
                                y: 0,
                                x2: .1,
                                y2: 1,
                                colorStops: [{
                                    offset: 0, color: '#97d0fe' // 0% 处的颜色
                                },
                                {
                                    offset: 1, color: '#8ecdfe' // 100% 处的颜色
                                }],
                                globalCoord: true // 缺省为 false
                            },
							shadowColor: 'rgba(0,62,198,0.75)',
                            shadowBlur: 10
                        },
                        //这部分用于填充空白,不显示标签。
                        label: {
                            normal: {
                                show: false
                            }
                        }
                    },
                ]
            }
        ]
    };

        // 使用刚指定的配置项和数据显示图表。
        myChart.setOption(option);

    </script>

</body>
</html>
color坐标轴定义及globalCoord含义,暂时没有搞清楚,后面再进行补充。
	color: {
		type: 'linear',
		x: 0,
		y: 0,
		x2: .1,
		y2: 1,
		colorStops: [{
			offset: 0, color: '#4dcdfc' // 0% 处的颜色,蓝绿色
		},
		{
			offset: 1, color: '#3F77FE' // 100% 处的颜色,蓝色
		}],
		globalCoord: true // 缺省为 false
	},
最后
以上就是典雅宝马最近收集整理的关于Echarts饼图简单案例的全部内容,更多相关Echarts饼图简单案例内容请搜索靠谱客的其他文章。
本图文内容来源于网友提供,作为学习参考使用,或来自网络收集整理,版权属于原作者所有。


发表评论 取消回复