《娜璋带你读论文》系列主要是督促自己阅读优秀论文及听取学术讲座,并分享给大家,希望您喜欢。由于作者的英文水平和学术能力不高,需要不断提升,所以还请大家批评指正,非常欢迎大家给我留言评论,学术路上期待与您前行,加油。
前一篇从个人角度介绍英文论文模型设计(Model Design)如何撰写。这篇文章将从个人角度介绍英文论文实验评估(Evaluation)部分,即Experimental Evaluation或Experimental study,主要以入侵检测系统为例(Intrusion Detection System),详细的对比分析下篇介绍。一方面自己英文太差,只能通过最土的办法慢慢提升,另一方面是自己的个人学习笔记,并分享出来希望大家批评和指正。希望这篇文章对您有所帮助,这些大佬是真的值得我们去学习,献上小弟的膝盖~fighting!
文章目录
- 一.实验评估如何撰写
- 1.论文总体框架及实验撰写
- 2.实验评估撰写
- 3.讨论撰写
- 4.实验评估撰写之个人理解
- 5.整体结构撰写补充
- 二.入侵检测系统论文实验评估句子
- 第1部分:引入
- 第2部分:数据集介绍
- 第3部分:评估指标
- 第4部分:实验环境
- 三.实验图表
- 四.总结

这里选择的论文多数为近三年的CCF A和二区以上为主,尤其是顶会顶刊。当然,作者能力有限,只能结合自己的实力和实际阅读情况出发,也希望自己能不断进步,每个部分都会持续补充。可能五年十年后,也会详细分享一篇英文论文如何撰写,目前主要以学习和笔记为主。大佬还请飘过O(∩_∩)O
前文赏析:
- [论文阅读] (01) 拿什么来拯救我的拖延症?初学者如何提升编程兴趣及LATEX入门详解
- [论文阅读] (02) SP2019-Neural Cleanse: Identifying and Mitigating Backdoor Attacks in DNN
- [论文阅读] (03) 清华张超老师 - GreyOne: Discover Vulnerabilities with Data Flow Sensitive Fuzzing
- [论文阅读] (04) 人工智能真的安全吗?浙大团队外滩大会分享AI对抗样本技术
- [论文阅读] (05) NLP知识总结及NLP论文撰写之道——Pvop老师
- [论文阅读] (06) 万字详解什么是生成对抗网络GAN?经典论文及案例普及
- [论文阅读] (07) RAID2020 Cyber Threat Intelligence Modeling Based on Heterogeneous GCN
- [论文阅读] (08) NDSS2020 UNICORN: Runtime Provenance-Based Detector for Advanced Persistent Threats
- [论文阅读] (09)S&P2019 HOLMES Real-time APT Detection through Correlation of Suspicious Information Flow
- [论文阅读] (10)基于溯源图的APT攻击检测安全顶会总结
- [论文阅读] (11)ACE算法和暗通道先验图像去雾算法(Rizzi | 何恺明老师)
- [论文阅读] (12)英文论文引言introduction如何撰写及精句摘抄——以入侵检测系统(IDS)为例
- [论文阅读] (13)英文论文模型设计(Model Design)如何撰写及精句摘抄——以入侵检测系统(IDS)为例
- [论文阅读] (14)英文论文实验评估(Evaluation)如何撰写及精句摘抄(上)——以入侵检测系统(IDS)为例
一.实验评估如何撰写
论文如何撰写因人而异,作者仅分享自己的观点,欢迎大家提出意见。然而,坚持阅读所研究领域最新和经典论文,这个大家应该会赞成,如果能做到相关领域文献如数家珍,就离你撰写第一篇英文论文更近一步了。
在实验设计中,重点是如何通过实验说服审稿老师,赞同你的创新点,体现你论文的价值。好的图表能更好地表达你论文的idea,因此我们需要学习优秀论文,一个惊喜的实验更是论文成功的关键。注意,安全论文已经不再是对比PRF的阶段了,一定要让实验支撑你整个论文的框架。同时,多读多写是基操,共勉!
1.论文总体框架及实验撰写
该部分回顾和参考周老师的博士课程内容,感谢老师的分享。典型的论文框架包括两种(The typical “anatomy” of a paper),如下所示:
第一种格式:理论研究
- Title and authors
- Abstract
- Introduction
- Related Work (可置后)
- Materials and Methods
- Results
- Acknowledgements
- References
第二种格式:系统研究
- Title and authors
- Abstract
- Introduction
- Related Work (可置后)
- System Model
- Mathematics and algorithms
- Experiments
- Acknowledgements
- References
实验评估介绍(Evaluation)
- 许多论文对他们的方法进行了实证校验
- 当你刚到一个领域时,你应该仔细检查这项工作通常是如何完成的
- 注意所使用的数据集和代码也很有帮助——因为您可能在将来自己使用它们
2.实验评估撰写
该部分主要是学习易莉老师书籍《学术写作原来是这样》,后面我也会分享我的想法,具体如下:
结果与方法一种是相对容易写作的部分,其内容其实就是你对收集来的数据做了什么样的分析。对于相对简单的结果(3个分析以内),按部就班地写就好。有专业文献的积累,相信难度不大。写起来比较困难的是复杂数据的结果,比如包括10个分析,图片就有七八张。这时候对结果的组织就非常重要了。老师推荐《10条简单规则》一文中推荐的 结论驱动(conclusion-driven) 方法。
个人感觉:
实验部分同样重要,但更重要是如何通过实验结果、对比实验、图表描述来支撑你的创新点,让审稿老师觉得,就应该这么做,amazing的工作。作为初学者,我们可能还不能做到非常完美的实验,但一定要让文章的实验足够详细,力争像该领域的顶级期刊或会议一样,并且能够很好的和论文主题相契合,这有这有,文章的价值也体现出来了。
在数据处理的过程中,梳理、总结自己的主要发现,以这些发现为大纲(小标题),来组织结果的写作(而不是传统上按照自己数据处理的顺序来组织)。以作者发表论文为例,他们使用了这种方法来组织结果部分,分为四个小标题,每个小标题下列出相应的分析及结果。
- (1) Sampling optimality may increase or decrease with autistic traits in different conditions
- (2) Bimodal decision times suggest two consecutive decision processes
- (3) Sampling is controlled by cost and evidence in two separate stages
- (4) Autistic traits influence the strategic diversity of sampling decisions
如果还有其他结果不能归入任何一个结论,那就说明这个结果并不重要,没有对形成文章的结论做出什么贡献,这时候果断舍弃(或放到补充材料中)是明智的选择。
另外,同一种结果可能有不同的呈现方式,可以依据你的研究目的来采用不同的方式。我在修改学生文章时遇到比较多的一个问题是采用奇怪的方式,突出了不重要的结果。举例:
示例句子:
The two groups were similar at the 2nd, 4th, and 8th trials; They differed from each other in the remaining trials.
这句话有两个比较明显的问题:(1)相似的试次并不是重点,重点是大部分的试次是有差异的,但是这个重点没有被突出,反而仅有的三个一样的试次突出了。(2)语言的模糊,differ的使用来来的模糊性(不知道是更好还是更差)。
修改如下:
Four-year-olds outperformed 3-year-olds in most trials, except the 2nd, 4th, and 8th trials, in which they performed similarly.
对于结果的呈现,作图是特别重要的,一张好图胜过千言万语。 但我不是作图方面的专家,如果你需要这方面的指导,建议你阅读《10个简单规则,创造更优图形》,文中为怎么做出一张好图提供了非常全面而有用的指导。
3.讨论撰写
该部分主要是学习易莉老师书籍《学术写作原来是这样》,后面我也会分享我的想法,具体如下:
讨论是一个非常头疼的部分。先来讲讲讨论的写法,在前面强调了从大纲开始写的好处,从大纲开始写是一种自上而下的写法,在写大纲的过程中确定主题句,然后再确定其他内容。还有一种方法是自下而上地写,就是先随心所以地写第一稿,从笔记开始写,然后对这些笔记进行梳理和归纳,提炼主题句。老师通常混合两种写法,先从零星的点进行归纳(写前言时对文献观点做笔记,写讨论时对结果的发现做笔记),之后通过梳理,整理出大纲,再从大纲开始写作。
比如我对某篇文章的讨论部分做过相关笔记,然后对这些点进行梳理和归纳,再结合前沿提出来的三个研究问题形成讨论的大纲,如下:
- (1) 总结主要发现
- (2) Distrust and deception learning in ASD
- (3) Anthropomorphic thinking of robot and distrust
- (4) Human-robot vs. interpersonal interactions
- (5) Limitations
- (6) Conclusions
在(1)到(4)段的讨论中,要先总结自己最重要的发现,不要忘记回顾前言中提出的实验预期,说明结果是否符合自己的预期。然后回顾前人研究与自己的研究发现是否一致,如果不一致,就可以讨论可能的原因(取样、实验方法的不同等)。
此外还需要注意,很多学生把讨论的重点放在了与前人研究不一致的结果和自己的局限性上,这些是需要写的,但是最重要的是突出自己研究的贡献。
讨论中最常出现的问题就是把结果里的话换个说法再说一遍。其实讨论部分给了我们一个从更高层面梳理和解读研究结果的机会。更重要的是,需要明确提出自己的研究贡献,进一步强调研究的重要性、意义以及创新性。因此,不要停留在就事论事的结果描述上。读者读完结果后,很容易产生“so what”的问题——“是的,你发现了这些,那又怎么样呢?”。
这时候,最重要的是告诉读者研究的启示(implication)——你的发现说明了什么,加深了对什么问题的理解,对未解决的问题提供了什么新的解决方法,揭示了什么新的机制。这也是影响稿件录用的最重要部分,所以一定要花最多时间和精力来写这个部分。
用前文提到的“机器人”文章的结论作为例子,说明如何总结和升华自己的结论。
Overall, our study contributes several promising preliminary findings on the potential involvement of humanoid robots in social rules training for children with ASD. Our results also shed light for the direction of future research, which should address whether social learning from robots can be generalized to a universal case (e.g., whether distrusting/deceiving the robot contributes to an equivalent effect on distrusting/deceiving a real person); a validation test would be required in future work to test whether children with ASD who manage to distrust and deceive a robot are capable of doing the same to a real person.
4.实验评估撰写之个人理解
首先我们要清楚实验写作的目的,通过详细准确的数据集、环境、实验描述,仿佛能让别人模仿出整个实验的过程,更让读者或审稿老师信服研究方法的科学性,增加结果数据的准确性和有效性。
- 研究问题、数据集(开源 | 自制)、数据预处理、特征提取、baseline实验、对比实验、统计分析结果、实验展示(图表可视化)、实验结果说明、论证结论和方法
如果我们的实验能发现某些有趣的结论会非常棒;如果我们的论文就是新问题并有对应的解决方法(创新性强),则实验需要支撑对应的贡献或系统,说服审稿老师;如果上述都不能实现,我们尽量保证实验详细,并通过对比实验(baseline对比)来巩固我们的观点和方法。
切勿只是简单地对准确率、召回率比较,每个实验结果都应该结合研究背景和论文主旨进行说明,有开源数据集的更好,没有的数据集建议开源,重要的是说服审稿老师认可你的工作。同时,实验步骤的描述也非常重要,包括实验的图表、研究结论、简明扼要的描述(给出精读)等。
在时态方面,由于是描述已经发生的实验过程,一般用过去时态,也有现在时。大部分期刊建议用被动句描述实验过程,但是也有一些期刊鼓励用主动句,因此,在投稿前,可以在期刊主页上查看“Instructions to Authors”等投稿指导性文档来明确要求。一起加油喔~
下面结合周老师的博士英语课程,总结实验部分我们应该怎么表达。
图/表的十个关键点(10 key points)
- 说明部分要尽量把相应图表的内容表达清楚
- 图的说明一般在图的下边
- 表的说明一般在标的上边
- 表示整体数据的分布趋势的图不需太大
- 表示不同方法间细微差别的图不能太小
- 几个图并排放在一起,如果有可比性,并排图的取值范围最好一致,利于比较
- 实验结果跟baseline在绝对数值上差别不大,用列表价黑体字
- 实验结果跟baseline在绝对数值上差别较大,用柱状图/折线图视觉表现力更好
- 折线图要选择适当的颜色和图标,颜色选择要考虑黑白打印的效果
- 折线图的图标选择要有针对性:比如对比A, A+B, B+四种方法:
A和A+的图标要相对应(例如实心圆和空心圆),B和B+的图标相对应(例如实心三角形和空心三角形)
说明部分要尽量把相应图表的内容表达清楚
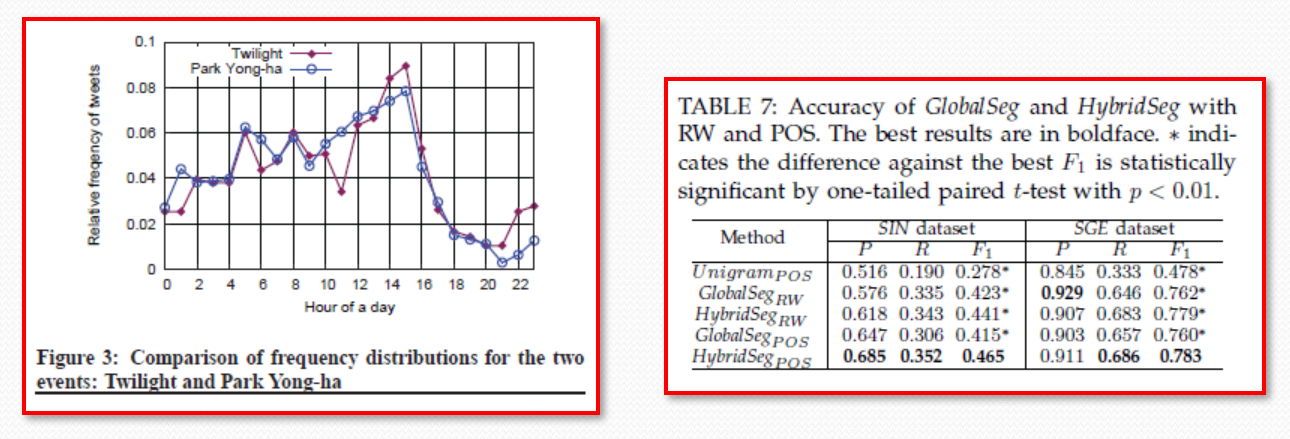
图的说明一般在图的下边;表的说明一般在表的上边;表示整体数据的分布趋势的图不需太大;表示不同方法间细微差别的图不能太小。
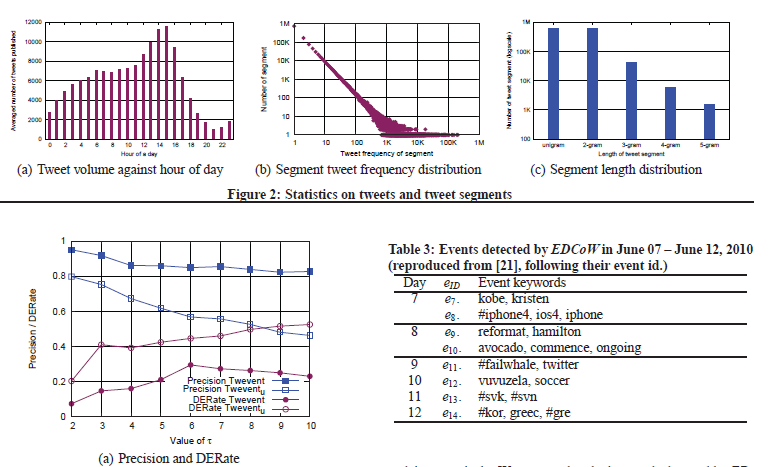
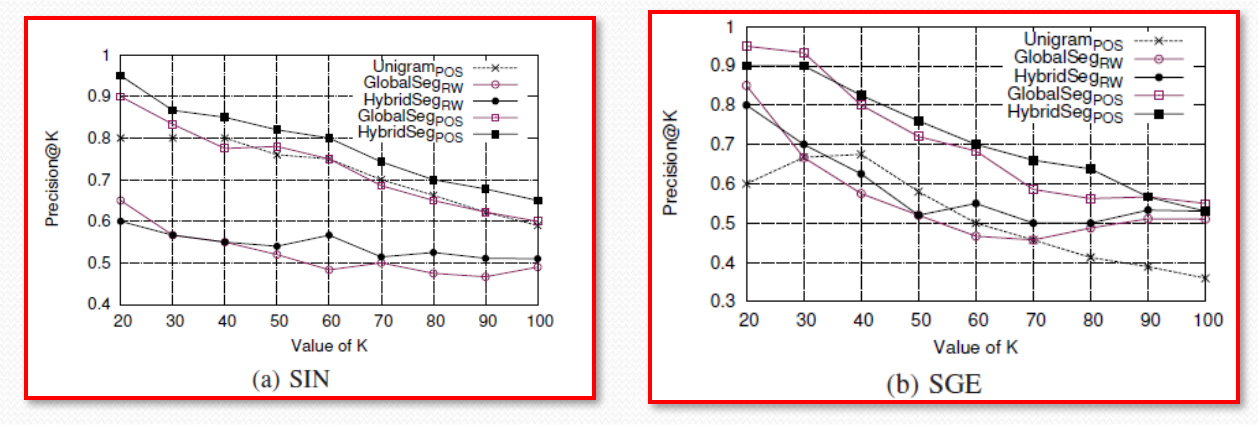
几个图并排放在一起,如果有可比性,并排图的x/y轴的取值范围最好一致,利于比
较。

实验结果跟baseline在绝对数值上差别不大,用列表加黑体字;实验结果跟baseline在绝对数值上差别较大,用柱状图/折线图视觉表现力更好。

折线图要选择适当的颜色和图标,颜色选择要考虑黑白打印的效果;折线图的图标选择要有针对性,比如对比A, A+,B, B+四种方法。
5.整体结构撰写补充
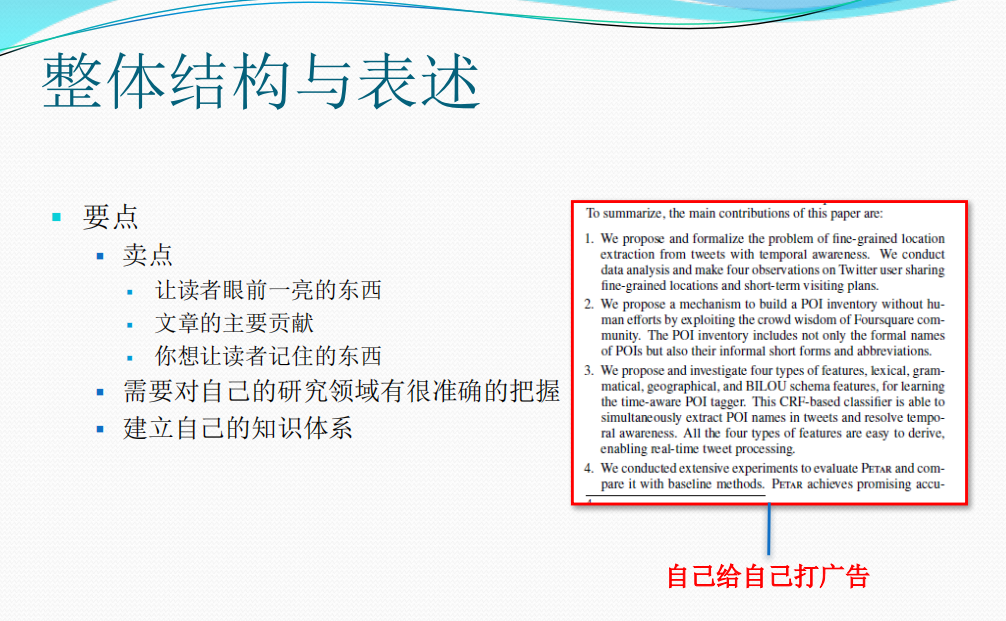
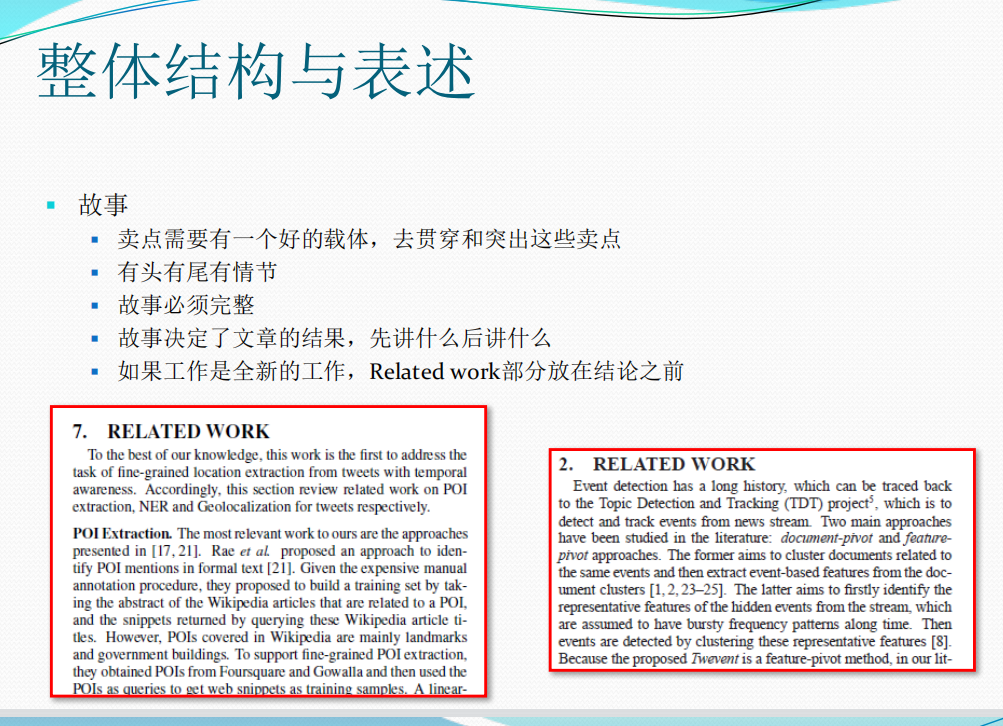
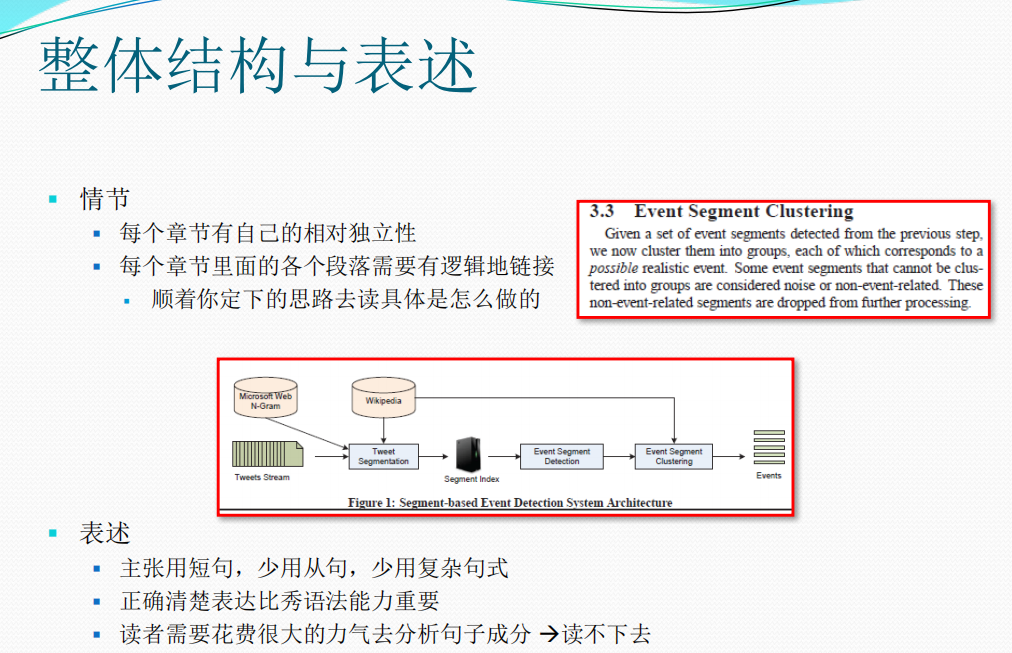
同时,模型设计整体结构和写作细节补充几点:(引用周老师博士课程,受益匪浅)


二.入侵检测系统论文实验评估句子
第1部分:引入
该部分在实验评估环节主要作为引入,通常是介绍实验模块由哪几部分组成。同时,有些论文会直接给出实验的各个小标题,这时会省略该部分。
In this section, we employ four datasets and experimentally evaluate four aspects of WATSON: 1) the explicability of inferred event semantics; 2) the accuracy of behavior abstraction; 3) the overall experience and manual workload reduction in attack investigation; and 4) the performance overhead.
- Jun Zeng, et al. WATSON: Abstracting Behaviors from Audit Logs via Aggregation of Contextual Semantics. NDSS.
In this section, we prototype Whisper and evaluate its performance by using 42 real-world attacks. In particular, the experiments will answer the three questions:
- (1) If Whisper achieves higher detection accuracy than the state-of-the-art method? (Section 6.3)
- (2) If Whisper is robust to detect attacks even if an attackers try to evade the detection of Whisper by leveraging the benign traffic? (Section 6.4)
- (3) If Whisper achieves high detection throughput and low detection latency? (Section 6.5)
- Chuanpu Fu, et al. Realtime Robust Malicious Traffic Detection via Frequency Domain Analysis. CCS.
We first describe the testbed and data sets we use in the experiment. Then we evaluate the system by comparing it with other classical intrusion detection systems on a series of critical axes such as detection rate, false alarm rate, detection time, query time and storage overhead.
- Yulai Xie, et al. Pagoda: A Hybrid Approach to Enable Efficient Real-Time Provenance Based Intrusion Detection in Big Data Environments. TDSC.
In this section, we evaluate our approach with the following major goals:
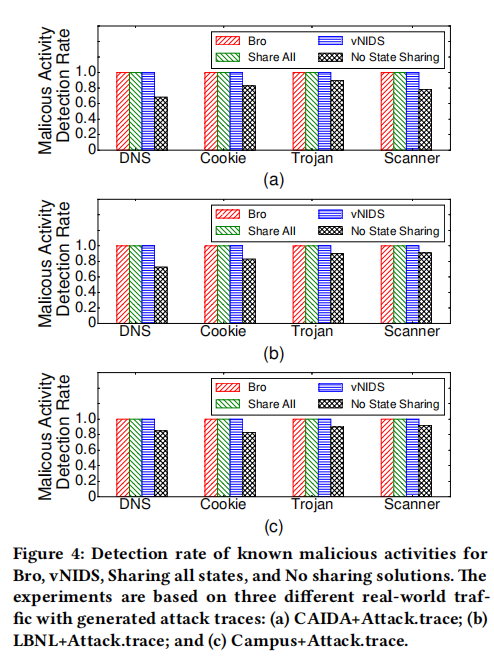
- Demonstrating the intrusion detection effectiveness of vNIDS. We run our virtualized NIDS and compare its detection results with those generated by Bro NIDS based on multiple real-world traffic traces (Figure 4).
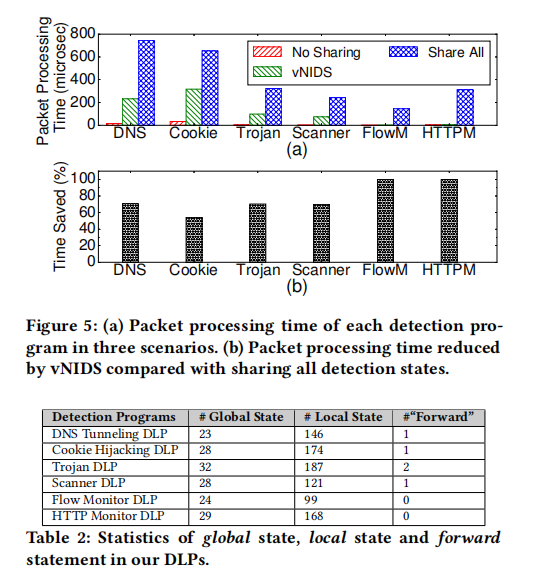
- Evaluating the performance overhead of detection state sharing among instances in different scenarios: 1) without detection state sharing; 2) sharing all detection states; and 3) only sharing global detection states. The results are shown in Figure 5. The statistics of global states, local states, and forward statements are shown in Table 2.
- Demonstrating the flexibility of vNIDS regarding placement location. In particular, we quantify the communication overhead between virtualized NIDS instances across different data centers that are geographically distributed (Figure 8).
- Hongda Li, et al. vNIDS: Towards Elastic Security with Safe and Efficient Virtualization of Network Intrusion Detection Systems. CCS.
In this section, we start analyzing the MUD profile of real consumer IoT devices that we have generated, and highlight attack types that can be prevented. Then, we will use traces collected in our lab, when we launched a number of volumetric attacks to four of IoT devices, to show how our system can detect these attacks using off-the-shelf IDS in an operational environment.
- Ayyoob Hamza, et al. Combining MUD Policies with SDN for IoT Intrusion Detection. IOT S&P.
In this section, we present the implementation of BiDLSTM and discuss the experimental findings. We compare the model’s performance with state-of-the-art methods trained and tested on the same dataset (i.e., the NSL-KDD dataset). Also, we present a comparison of results with some recently published methods on the NSL-KDD dataset.
- Yakubu Imrana, et al. A bidirectional LSTM deep learning approach for intrusion detection. Expert Systems With Applications.
In this section, we performed two major experiments (named Experiment1 and Experiment2) to explore the performance of disagreement-based semi-supervised learning and our DAS-CIDS in the aspects of detection performance and alarm filtration. In this work, we use the WEKA platform (WEKA) to help extract various classifiers like J48 and Random Forest to avoid implementation variations, which is an open-source software providing a set of machine learning algorithms.
- Wenjuan Li, et al. Enhancing collaborative intrusion detection via disagreement-based
semi-supervised learning in IoT environments. Journal of Network and Computer Applications.
In this experimental study, we exhibit the impact of the proposed methodology and select the informative features subset from the given intrusion dataset, that can classify the network traffics into normal or attacks for the intrusion detection. Two diagnostic studies were conducted to verify the impact of the proposed method, such as precision-recall analysis and ROC-AUC analysis, which is helpful in the analysis of probabilistic prediction for binary and multi-class classification problems. The main objectives of these experiments are summarized below,
- To design and develop a univariate ensemble feature selection approach to identify the valuable reduced feature set from the given Intrusion datasets.
- To improve the classification efficiency using the majority voting ensemble method which may effectively classify the network traffics as normal and attack data.
- To evaluate this proposed work on three different intrusion datasets, namely Honeypot real-time datasets KDD and Kyoto.
- S. Krishnaveni, et al. Efficient feature selection and classification through ensemble method for network intrusion detection on cloud computing. Cluster Computing.
第2部分:数据集介绍
该部分主要介绍实验数据集,通常包括数据集的组成及特征分布情况,结合表格描述效果更好。同时,如果有公用数据集(AI类较多),建议多个数据集对比,并且与经典的论文方法或baselines比较;如果是自身数据集,建议开源,但其对比实验较难,怎么说服审稿人相信你的数据集是关键。
(1) Chuanpu Fu, et al. Realtime Robust Malicious Traffic Detection via Frequency Domain Analysis. CCS.
Datasets. The datasets used in our experiments are shown in Table 4. We use three recent datasets from the WIDE MAWI Gigabit backbone network [69]. In the training phase, we use 20% benign traffic to train the machine learning algorithms. We use the first 20% packets in MAWI 2020.06.10 dataset to calculate the encoding vector via solving the SMT problem (see Section 4.2). Meanwhile, we replay four groups of malicious traffic combined with the benign traffic on the testbed:
- Traditional DoS and Scanning Attacks. We select five active attacks from the Kitsune 2 [42] and a UDP DoS attack trace [7] to measure the accuracy of detecting high-rate malicious flow. To further evaluate Whisper, we collect new malicious traffic datasets on WAN including Multi-Stage TCP Attacks, Stealthy TCP Attacks, and Evasion Attacks.
- Multi-Stage TCP Attacks. TCP side-channel attacks exploit the protocol implementations and hijack TCP connections by generating forged probing packets. Normally, TCP side-channel attacks have several stages, e.g., active connection finding, sequence number guessing, and acknowledgement number guessing. We implement two recent TCP side-channel attacks [10, 17], which have different numbers of attack stages. Moreover, we collect another multi-stage attack, i.e., TLS padding oracle attack [67].
- Stealthy TCP Attacks. The low-rate TCP DoS attacks generate low-rate burst traffic to trick TCP congestion control algorithms and slow down their sending rates [25, 32, 33]. Low-rate TCP DoS attacks are more stealthy than flooding based DoS attacks. We construct the low-rate TCP DoS attacks with different sending rates. Moreover, we replay other low-rate attacks, e.g., stealthy vulnerabilities scanning [38].
- Evasion Attacks. We use evasion attack datasets to evaluate the robustness of Whisper. Attackers can inject noise packets (i.e., benign packets of network applications) into malicious traffic to evade detection [19]. For example, an attacker can generate benign TLS traffic so that the attacker sends malicious SSL renegotiation messages and the benign TLS packets simultaneously. Basing on the typical attacks above, we adjust the ratio of malicious packets and benign packets, i.e., the ratio of 1:1, 1:2, 1:4, and 1:8, and the types of benign traffic to generate 28 datasets. For comparison, we replay the evasion attack datasets with the same background traffic in Table 4.
(2) Ning Wang, et al. MANDA: On Adversarial Example Detection for Network Intrusion Detection System. INFOCOM.
NSL-KDD: We use the internet traffic dataset, NSL-KDD [45] (also used in AE attacks in IDS [9], but [9] dose not consider problem-space validity), for our evaluation. In NSL-KDD, each sample contains four groups of entries including Intrinsic Characteristics, Content Characteristics, Time-based Characteristics, and Host-based Characteristics. There are four categories of intrusion: DoS, Probing, Remote-to-Local (R2L), and User-to-Root (U2R) of which each contains more attack sub-categories. There are 24 sub-categories of attacks in the training set and 38 sub-categories of attacks are in test set (i.e., 14 sub-categories of attacks are unseen in the training set). There are 125,973 training records and 22,544 testing records. In our experiments, we only show the evaluations on an IDS model for discriminating DoS attacks from normal traffic since the results for the other three attacks are similar. The total number of entries for each record is 41 (in problem-space) which are further processed into 121 numerical features as an input-space (feature-space) vector.
MNIST: We also evaluate our approach on an image dataset, MNIST [46], to demonstrate its applicability. The images in MNIST are handwritten digits from 0 to 9. The corresponding digit of an image is used as its label. Each class has 6,000 training samples and 1,000 test samples. Therefore, the whole MNIST dataset has 60,000 training samples and 10,000 test samples. All the images have the same size of 28 × 28 and are in grey-level.
(3) Mohammed A. Ambusaidi, et al. Building an Intrusion Detection System Using a Filter-Based Feature Selection Algorithm. IEEE TRANSACTIONS ON COMPUTERS.
Currently, there are only a few public datasets available for intrusion detection evaluation. Among these datasets, the KDD Cup 99 dataset, NSL-KDD dataset and Kyoto 2006+ dataset have been commonly used in the literature to assess the performance of IDSes. According to the review by Tsai et al. [43], the majority of the IDS experiments were performed on the KDD Cup 99 datasets. In addition, these datasets have different data sizes and various numbers of features which provide comprehensive tests in validating feature selection methods. Therefore, in order to facilitate a fair and rational comparison with other state-of-the-art detection approaches, we have selected these three datasets to evaluate the performance of our detection system.
The KDD Cup 99 dataset is one of the most popular and comprehensive intrusion detection datasets and is widely applied to evaluate the performance of intrusion detection systems [43]. It consists of five different classes, which are normal and four types of attack (i.e., DoS, Probe, U2R and R2L). It contains training data with approximately five million connection records and test data with about two million connection records. Each record in these datasets is labeled as either normal or an attack, and it has 41 different quantitative and qualitative features.
The NSL-KDD is a new revised version of the KDD Cup 99 that has been proposed by Tavallaee et al. in [24]. This dataset addresses some problems included in the KDD Cup 99 dataset such as a huge number of redundant records in KDD Cup 99 data. As in the case of the KDD Cup 99 dataset, each record in the NSL-KDD dataset is composed of 41 different quantitative and qualitative features.
(4) Jun Zeng, et al. WATSON: Abstracting Behaviors from Audit Logs via Aggregation of Contextual Semantics. NDSS.
We evaluate WATSON on four datasets: a benign dataset, a malicious dataset, a background dataset, and the DARPA TRACE dataset. The first three datasets are collected from ssh sessions on five enterprise servers running Ubuntu 16.04 (64-bit). The last dataset is collected on a network of hosts running Ubuntu 14.04 (64-bit). The audit log source is Linux Audit [9].
In the benign dataset, four users independently complete seven daily tasks, as described in Table I. Each user performs a task 150 times in 150 sessions. In total, we collect 17 (expected to be 4×7 = 28) classes of benign behaviors because different users may conduct the same operations to accomplish tasks. Note that there are user-specific artifacts, like launched commands, between each time the task is performed. For our benign dataset, there are 55,296,982 audit events, which make up 4,200 benign sessions.
In the malicious dataset, following the procedure found in previous works [2], [10], [30], [53], [57], [82], we simulate3 eight attacks from real-world scenarios as shown in Table II. Each attack is carefully performed ten times by two security engineers on the enterprise servers. In order to incorporate the impact of typical noisy enterprise environments [53], [57], we continuously execute extensive ordinary user behaviors and underlying system activities in parallel to the attacks. For our malicious dataset, there are 37,229,686 audit events, which make up 80 malicious sessions.
In the background dataset, we record behaviors of developers and administrators on the servers for two weeks. To ensure the correctness of evaluation, we manually analyze these sessions and only incorporate sessions without behaviors in Table I and Table II into the dataset. For our background dataset, there are 183,336,624 audit events, which make up 1,000 background sessions.
…
In general, our experimental behaviors for abstraction are comprehensive as compared to behaviors in real-world systems. Particularly, the benign behaviors are designed based upon basic system activities [84] claimed to have drawn attention in cybersecurity study; the malicious behaviors are either selected from typical attack scenarios in previous work or generated by a red team with expertise in instrumenting and collecting data for attack investigation.
(5) S. Krishnaveni, et al. Efficient feature selection and classification through ensemble method for network intrusion detection on cloud computing. Cluster Computing.
The datasets applied in this proposed work are the following: (1) Real-time Honeypot Dataset (2) Kyoto 2006+ Dataset and (3) NSL-KDD.
-
Real-time honeypot dataset. In this research work, honeypots were set up on the AWS public cloud. The real-time data was collected during the period August 19th, 2018 to September 19th, 2018. And then, log data was collected for further analysis, resulting in over 5,195,499 attacker’s log entries. The proposed Honeynet system demonstrates the system configuration of container-based honeypots that can investigate and discover the attacks on a cloud system [27].
-
NSL-KDD dataset. The KDD Cup99 dataset is a popular dataset used for network-based intrusion detection. It has the drawback of several redundant records, which will affect the effectiveness of the evaluated systems. Pervez et al. [28] have presented a new built form of KDD99 named as NSLKDD for overcoming these issues. The KDDTrain+ and KDDTest+ sets of NSL KDD dataset have approximately 125,973 and 22,544 connection records correspondingly. Similar to KDD99, each record in this data is unique as it is labeled with attack or normal based on the 41-feature set. NSL-KDD dataset includes the same four categories of attacks as the original KDD-99 Dataset.
-
Kyoto dataset. Kyoto dataset was anticipated by Song et al. [29] This dataset is created on real-time 3 years of network traffic data from regular servers and honeypots. The data was utilized for further analysis of approximately 257,673 records. Each connection in the dataset was seen to be unique with 24 features and 14 statistical features from KDD Cup 99 dataset, also 10 features from their networks, were extracted by the authors. The statistics of the intrusion datasets were utilized for the experiments is displayed in Table 1.
(6) Neha Gupta, et al. LIO-IDS: Handling class imbalance using LSTM and improved one-vs-one technique in intrusion detection system. Computer Networks.
This section discusses the three intrusion detection datasets that have been used in this paper for experimentation purposes. This includes NSL-KDD, CIDDS-001, and CICIDS2017 datasets.
The NSL-KDD (Network Socket Layer – Knowledge Discovery in Databases) dataset was developed in 2009 as the successor of the KDD 1999 dataset [46]. The NSL-KDD dataset overcame the drawbacks of the KDD dataset by removing several redundant and duplicate samples in training and testing datasets. It was created to maximize prediction difficulty, and this characteristic makes it a preferred choice by researchers even today [47]. NSL-KDD consists of separate training and testing datasets containing network traffic samples represented by 41 attributes. Each instance has a label corresponding to the normal class or one of the 22 attack types. These attack types are grouped into four major attack classes, namely Denial of Service (DoS), Probe, Remote to Local (R2L), and User to Root (U2R). Table 3 shows the number of samples present in various classes of the NSL-KDD dataset. The uneven distribution of samples in different classes of this dataset makes it an appropriate choice for testing the proposed LIO-IDS.
The CICIDS2017 dataset was developed by Sharafaldin et al. [49] by generating and capturing network traffic for a duration of five days. The dataset consists of normal traffic samples and traffic samples generated from fourteen different types of attacks. The authors utilized the B-profile system to imitate benign human activities on the web and generate normal traffic from HTTP, HTTPS, FTP, and SSH protocols. Different categories of attacks were generated using various tools available on the Internet. The original CICIDS2017 dataset consists of eight CSV files containing 22,73,097 normal samples and 5,57,646 attack samples. Each traffic sample consists of 80 features that were captured using the CICFlowMeter tool. Due to the huge size of the original dataset, a subset of the CICIDS2017 dataset was selected for experimentation in this paper. The details of the selected subsets have been shown in Table 5.
The intrusion detection datasets selected in this paper consist of categorical as well as numerical attribute values. To bring these values in a uniform format, dataset pre-processing was performed on both of them. This process has been explained in the following sub-section.
(7) Yakubu Imrana, et al. A bidirectional LSTM deep learning approach for intrusion detection. Expert Systems With Applications.
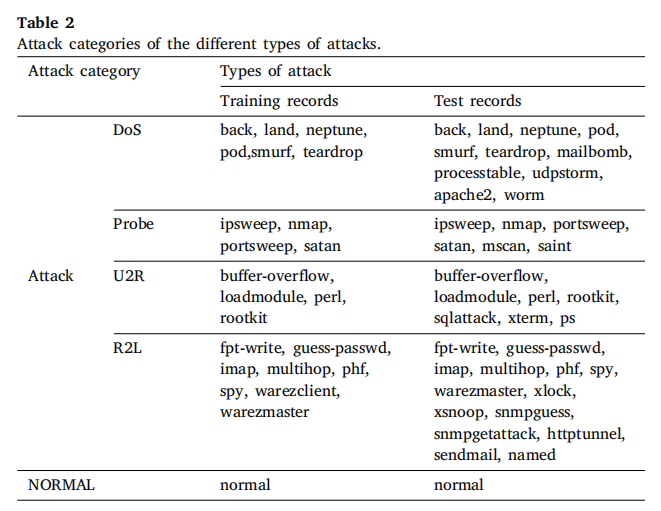
The NSL-KDD dataset (Tavallaee et al., 2009; UNB, 2009) is one of the bench-marked datasets for evaluating Intrusion Detection Systems (IDS). It is an enhanced form of the KDDCup ’99 dataset (Dua & Graff, 2017). The dataset comprises a training set (KDDTrain+) with 125,973 traffic samples and two separate test sets (i.e., KDDTest+ and KDDTest−21). The KDDTest+ has 22,544 traffic samples, and the KDDTest−21 has 11,850 samples. Additionally, to make the intrusion detection more realistic, the test datasets include many attacks that do not appear in the training set (see Table 2). Thus, adding to the 22 types of attacks in the training set, 17 more different attack types exist in the test set.
The NSL-KDD dataset contains 41 features, including 3 non-numeric (i.e., ????????????????????????????????_????????????????, ???????????????????????????? and ???? ????????????) and 38 numeric features, as shown in Table 1. It has a class label grouped into two categories (anomaly and normal) for binary classification. For multi-class classification, we group the label into five categories (i.e., Normal, Denial of Service (DoS), User-to-Root (U2R), Remote-to-Local (R2L), and Probe). Table 3 gives a summary of the number of traffic records in the NSL-KDD dataset.
第3部分:评估指标
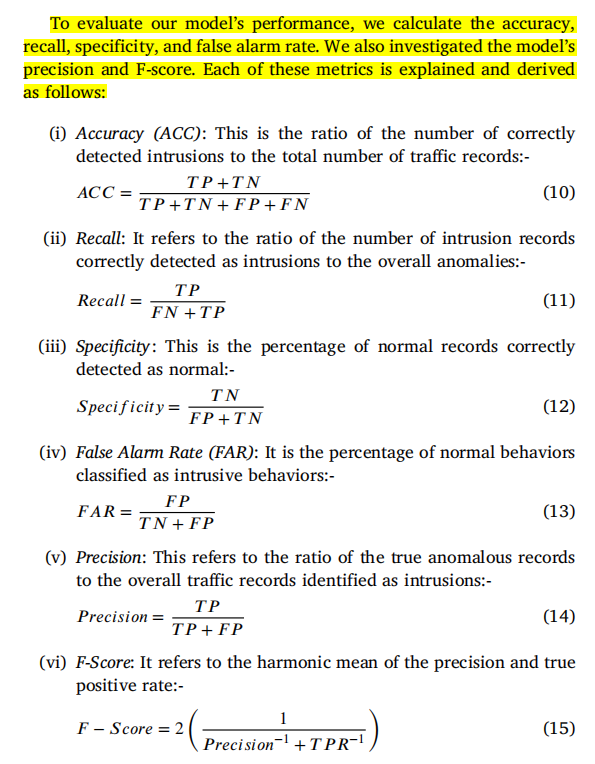
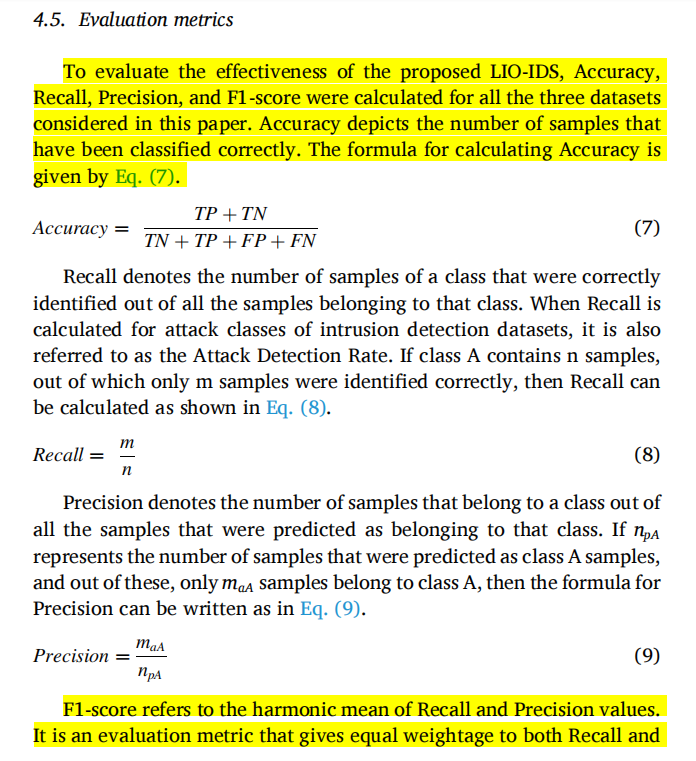
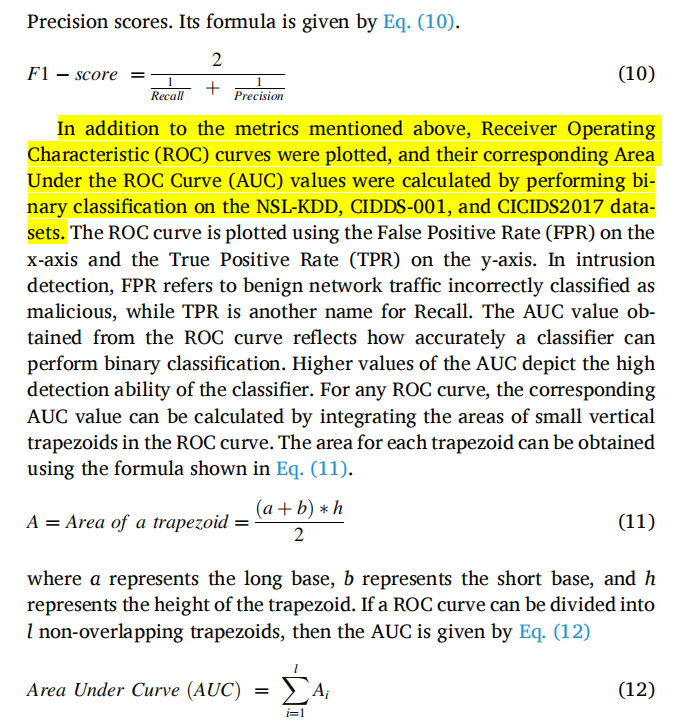
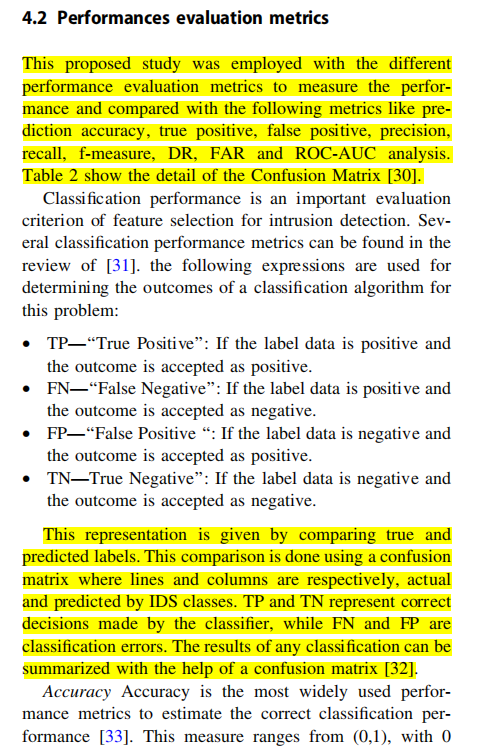
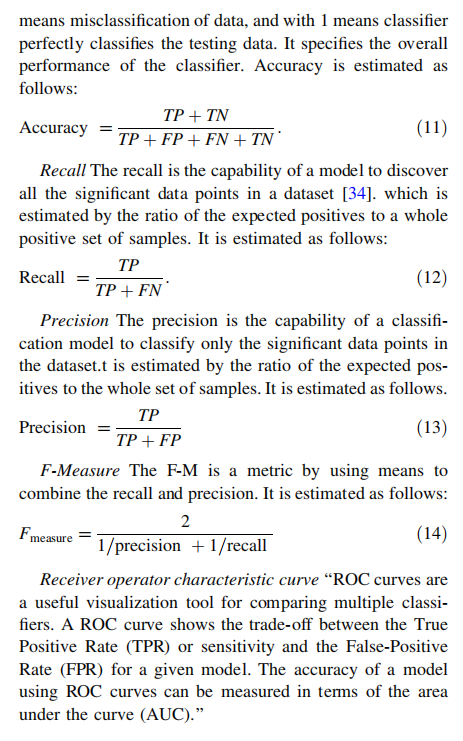
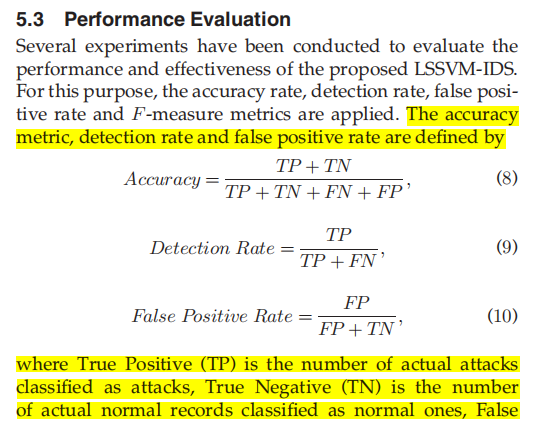
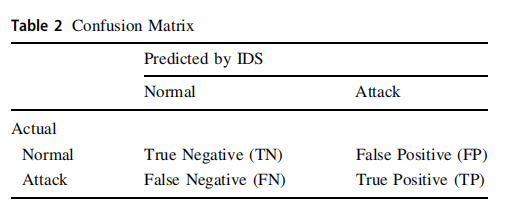
该部分介绍模型的评估指标,常见的包括准确率、召回率、精确率、F值、误报率等。
Chuanpu Fu, et al. Realtime Robust Malicious Traffic Detection via Frequency Domain Analysis. CCS.
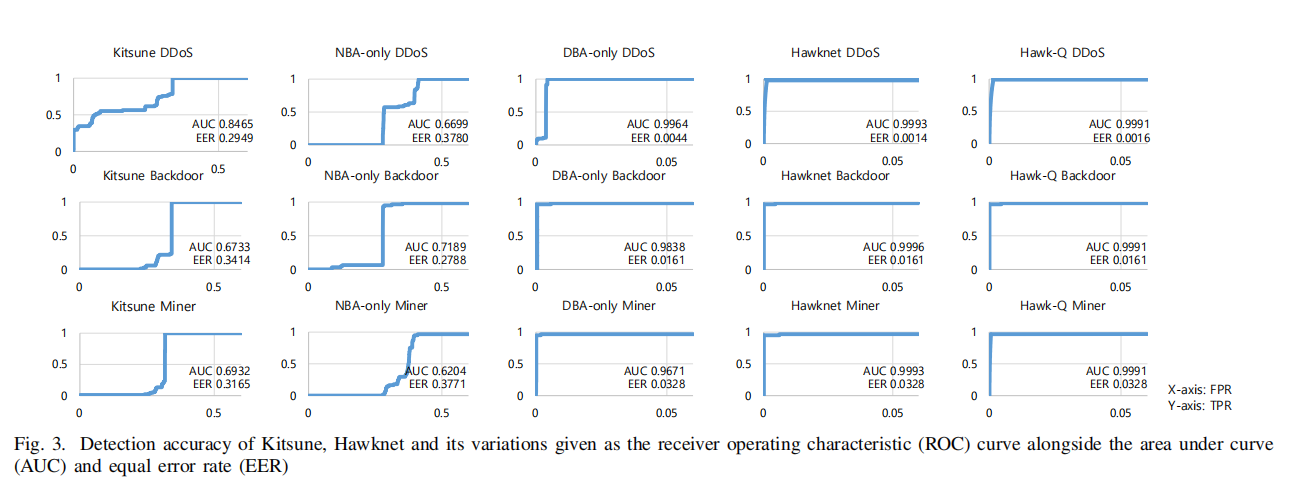
- Metrics. We use the following metrics to evaluate the detection accuracy: (i) true-positive rates (TPR), (ii) false-positive rates (FPR), (iii) the area under ROC curve (AUC), (vi) equal error rates (EER). Moreover, we measure the throughput and processing latency to demonstrate that Whisper achieves realtime detection.
Yakubu Imrana, et al. A bidirectional LSTM deep learning approach for intrusion detection. Expert Systems With Applications.
Neha Gupta, et al. LIO-IDS: Handling class imbalance using LSTM and improved one-vs-one technique in intrusion detection system. Computer Networks.
S. Krishnaveni, et al. Efficient feature selection and classification through ensemble method for network intrusion detection on cloud computing. Cluster Computing.
Mohammed A. Ambusaidi, et al. Building an Intrusion Detection System Using a Filter-Based Feature Selection Algorithm. IEEE TRANSACTIONS ON COMPUTERS.
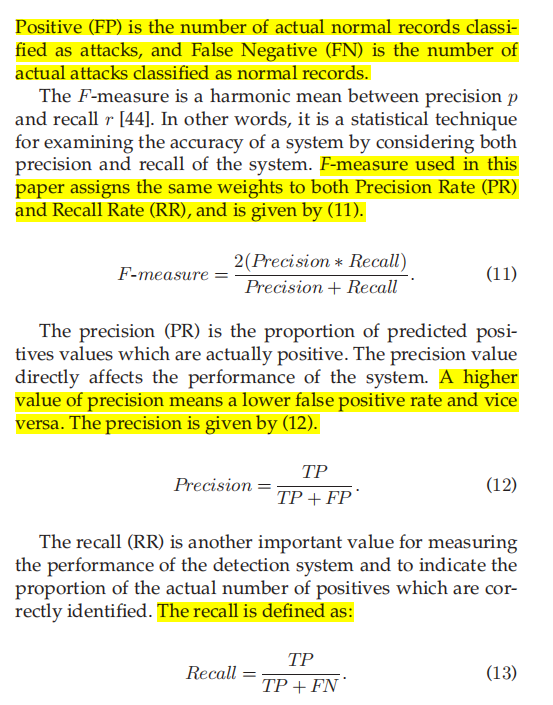
Congyuan Xu, et al. A Method of Few-Shot Network Intrusion Detection Based on Meta-Learning Framework. IEEE TIFS.
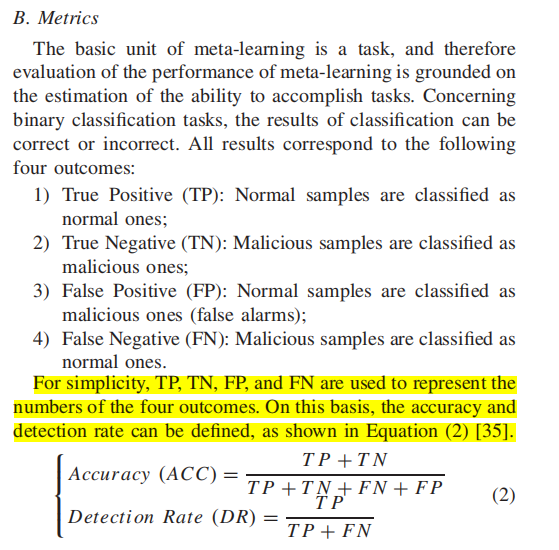
Ning Wang, et al. MANDA: On Adversarial Example Detection for Network Intrusion Detection System. IEEE INFOCOM.
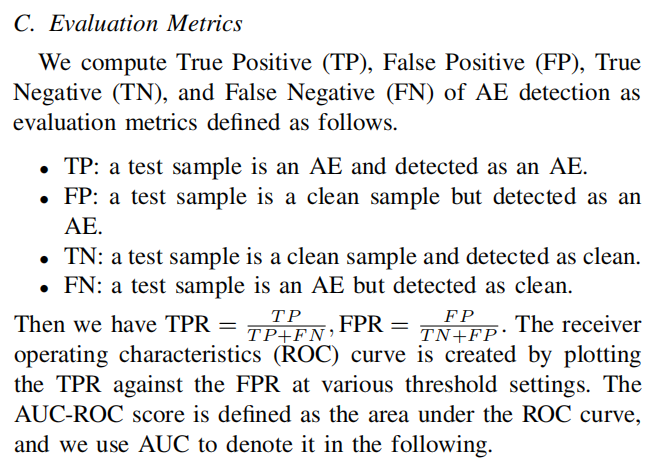
Vipin Kumar Kukkala, INDRA: Intrusion Detection Using Recurrent Autoencoders in Automotive Embedded Systems. IEEE TRANSACTIONS ON COMPUTER-AIDED DESIGN OF INTEGRATED CIRCUITS AND SYSTEMS.
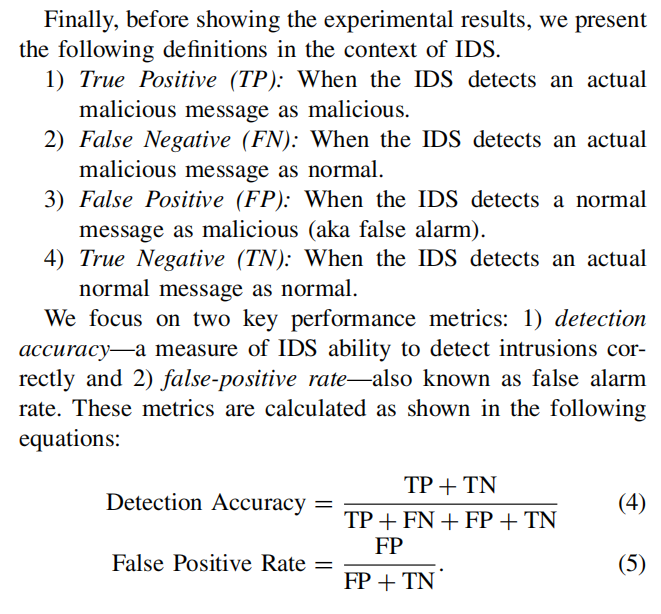
评估算法的混淆矩阵如下:
第4部分:实验环境
该部分作者包含了Experiment Setup或Implementation相关内容,主要介绍baselines或实验环境内容,以及模型的超参数、数据采集方法等。部分论文会介绍实验中的相关假设。
(1) Chuanpu Fu, et al. Realtime Robust Malicious Traffic Detection via Frequency Domain Analysis. CCS. (Implementation部分)
We prototype Whisper using C/C++ (GCC version 5.4.0) and Python (version 3.8.0) with more than 3,500 lines of code (LOC). The source code of Whisper can be found in [21].
-
High Speed Packet Parser Module. We leverage Intel Data Plane Development Kit (DPDK) version 18.11.10 LTS [26] to implement the data plane functions and ensure high performance packet parsing in high throughput networks. We bind the threads of Whisper on physical cores using DPDK APIs to reduce the cost of context switching in CPUs. As discussed in Section 4.1, we parse the three per-packet features, i.e., lengths, timestamps, and protocol types.
-
Frequency Domain Feature Extraction Module. We leverage PyTorch [52] (version 1.6.0) to implement matrix transforms (e.g., encoding and Discrete Fourier Transformation) of origin per-packet features and auto-encoders in baseline methods.
-
Statistical Clustering Module. We leverage K-Means as the clustering algorithm with the mlpack implementation (version 3.4.0) [44] to cluster the frequency domain features.
-
Automatic Parameter Selection. We use Z3 SMT solver (version 4.5.1) [40] to solve the SMT problem in Section 4.2, i.e., determining the encoding vector in Whisper.
Moreover, we implement a traffic generating tool using Intel DPDK to replay malicious traffic and benign traffic simultaneously. The hyper-parameters used in Whisper are shown in Table 3.
(2) Chuanpu Fu, et al. Realtime Robust Malicious Traffic Detection via Frequency Domain Analysis. CCS. (Experiment Setup部分)
Baselines. To measure the improvements achieved by Whisper, we establish three baselines:
- Packet-level Detection. We use the state-of-the-art machine learning based detection method, Kitsune [42]. It extracts per-packet features via flow state variables and feeds the features to auto-encoders. We use the open source Kitsune implementation [41] and run the system with the same hardware as Whisper.
- Flow-level Statistics Clustering (FSC). As far as we know, there is no flow-level malicious traffic detection method that achieves task agnostic detection. Thus, we establish 17 flow-level statistics according to the existing studies [4, 5, 30, 37, 43, 77] including the maximum, minimum, variance, mean, range of the per-packet features in Whisper, flow durations, and flow byte counts. We perform a normalization for the flow-level statistics. For a fair comparison, we use the same clustering algorithm to Whisper.
- Flow-level Frequency Domain Features with Auto-Encoder (FAE). We use the same frequency domain features as Whisper and an auto-encoder model with 128 hidden states and Sigmoid activation function, which is similar to the auto-encoder model used in Kitsune. For the training of the auto-encoder, we use the Adam optimizer and set the batch size as 128, the training epoch as 200, the learning rate as 0.01.
Testbed. We conduct the Whisper, FSC, and FAE experiments on a testbed built on a DELL server with two Intel Xeon E5645 CPUs (2 × 12 cores), Ubuntu 16.04 (Linux 4.15.0 LTS), 24GB memory, one Intel 10 Gbps NIC with two ports that supports DPDK, and Intel 850nm SFP+ laser ports for optical fiber connections. We configure 8GB huge page memory for DPDK (4GB/NUMA Node). We bind 8 physical cores for 8 NIC RX queues to extract per-packet features and the other 8 cores for Whisper analysis threads, which extract the frequency domain features of traffic and perform statistical clustering. In summary, we use 17 of 24 cores to enable Whisper.
Note that, since Kitsune cannot handle high-rate traffic, we evaluate it with offline experiments on the same testbed. We deploy DPDK traffic generators on the other two servers with similar configurations. The reason why we use two traffic generators is that the throughput of Whisper exceeds the physical limit of 10 Gbps NIC, i.e., 13.22 Gbps. We connect two flow generators with optical fibers to generate high speed traffic.
(3) Sunwoo Ahn, et al. Hawkware: Network Intrusion Detection based on Behavior Analysis with ANNs on an IoT Device. IEEE DAC.
We have implemented a prototype of Hawkware on a Raspberry Pi 3 Model B+ board which has a 1.4 GHz quad-core ARM Cortex-A53 processor with 1 GB RAM as it resembles many ARM-based IoT devices. We bound Hawkware to a single core for its computation with a 32 bit Linux OS.
We incorporated Tshark, a network packet capturing and analyzing tool, in implementing PA and used ftrace, an event tracing framework available in Linux kernels, in SCL. FP and HC are implemented in Python. Hawknet is trained offline on a separate server and then deployed on devices to perform detection. Hawknet and its training code are implemented with Tensorflow, which is one of the most popular frameworks for machine learning.
However, directly deploying this model strains IoT devices. In order to mitigate this issue, we first leveraged ARM’s NEON SIMD instructions to accommodate the high degree of parallelism inherent in Hawknet. Unfortunately, due to the high memory pressure in ANN computation for loading its weight values, utilizing NEON alone still falls short of making Hawknet efficient enough for IoT devices. Therefore, in addition, we capitalized on ANN weight quantization [15], compressing the vector values of Hawknet from 32-bit floating point numbers to 8-bit fixed point numbers. The compressed model of Hawknet, generated by employing the Tensorflowlite, only occupies 60KB. The learning rate was set to 0.001, which is a standard starting point for typical deep learning. The number of parameters in each layer of Hawknet is set as following: NBA’s embedding layer, encoding layer, decoding layer and reconstruction layer each respectively have 297, 3840, 567 and 297 parameters, DBA’s embedding layer, LSTM layer and softmax layer each have 3160, 840 and 3476 parameters and there are 210 parameters for CC.
(4) Ning Wang, et al. MANDA: On Adversarial Example Detection for Network Intrusion Detection System. IEEE INFOCOM.
We implemented the problem-space attacks and MANDA in TensorFlow. We ran all the experiments on a server equipped with an Intel Core i7-8700K CPU 3.70GHz×12, a GeForce RTX 2080 Ti GPU, and Ubuntu 18.04.3 LTS. The IDS model is a muti-layer perceptron (MLP) composed of one input layer, one hidden layer with 50 neurons and one output layer. For completeness, we also implemented other models for IDS including Logistic Regression (LGR), K-Nearest Neighbors (KNN), Naive Bayes classifier for multivariate Bernoulli (BNB), Decision Tree Classifier (DTC) and Support Vector Machine (SVM) from scikit-learn library [47]. We implement four AE attacks including FGSM, BIM, CW (the L2-norm version) and JSMA (cf. Section III-C) and adapt the first three to problem-space of IDS. In each experiment, we generate AEs on the test samples that are correctly classified by the IDS model. Note here that we do not generate AEs for misclassified test samples. Next, we combine the successful AEs and the same number of clean data points (randomly selected) together as a mixed dataset, on which we run all detection algorithms. The benchmark for comparison is Artifact [17], the same as in [14], [44]. Artifact is proposed by Feinman et al. in [17] and becomes one of the state-of-the-art AE detection scheme. Different from MANDA, Artifact uses kernel density estimation (KDE) and Bayesian neural network uncertainty as two criteria to detect AEs.
On MNIST dataset, we use a convolutional neural network (CNN) rather than the above MLP as the target model for AE attacks. The CNN model comprises 4 convolutional layers with ReLU activation, followed by 2 fully-connected layers.
(5) Yakubu Imrana, et al. A bidirectional LSTM deep learning approach for intrusion detection. Expert Systems With Applications.
In this section, we present the implementation of BiDLSTM and discuss the experimental findings. We compare the model’s performance with state-of-the-art methods trained and tested on the same dataset (i.e., the NSL-KDD dataset). Also, we present a comparison of results with some recently published methods on the NSL-KDD dataset.
The proposed model is a bidirectional LSTM implemented in python programming language using TensorFlow and Keras. The Adaptive Moment Estimation (Adam) algorithm is the optimizer used to update the model’s weights with a learning rate of 0.001. The loss functions used are the binary cross-entropy for binary classification and the categorical cross-entropy for multi-class classification. As shown in Fig. 3, the model starts by mapping inputs to their representations using an embedding layer. It then feeds the embeddings to the LSTM layers with two processing directions. The first in the forward direction and the other in the reversed direction. The LSTM outputs are then fed to fully connected layers with the rectified linear unit (ReLU) as an activation function. Ideally, the fully connected layers learn and compile the extracted data by the LSTM layers to form a final output that passes through an output layer for classification. Finally, we apply a dropout probability of 0.2 to the layers to ensure that our model does not over-fit the data. Table 4 displays a summary of the proposed model architecture.
The model’s performance is validated using a stratified K-fold cross-validation method with K set to 10. The stratified K-fold ensures that the sample percentage for each of the classes is equal in every fold. The process first shuffles the dataset and then splits it into K groups. Then fit the model with K-1 (10–1) folds and validated with the Kth folds remaining (9 folds). This process repeats until the last K-fold. Thus, it repeats until every K-fold serves as the test set. We record each fold’s scores as depicted in Fig. 4 and then take the mean of these scores as the model’s performance.
(6) Vipin Kumar Kukkala, et al. INDRA: Intrusion Detection Using Recurrent Autoencoders in Automotive Embedded Systems. IEEE TRANSACTIONS ON COMPUTER-AIDED DESIGN OF INTEGRATED CIRCUITS AND SYSTEMS.
To evaluate the performance of the INDRA framework, we first present an analysis for the selection of IT. Using the derived IT, we contrast it against the two variants of the same framework: 1) INDRA-LED and 2) INDRA-LD. The former removes the linear layer before the output and essentially leaving the GRU to decode the context vector. The term LED implies (L) linear layer, (E) encoder GRU and (D) decoder GRU. The second variation replaces the GRU and the linear layer at the decoder with a series of linear layers (LD implies linear decoder). These experiments were conducted to test the importance of different layers in the network. However, the encoder end of the network is not changed because we require a sequence model to generate an encoding of the timeseries data. We explored other variants as well, but they are not included in the discussion as their performance was poor compared to the LED and LD variants.
Subsequently, we compare the best variant of our framework with three prior works: 1) predictor LSTM (PLSTM [25]); 2) replicator neural network (RepNet [26]); and 3) CANet [23]. The first comparison work (PLSTM) uses an LSTM-based network that is trained to predict the signal values in the next message transmission. PLSTM achieves this by taking the 64-b CAN message payload as the input, and learns to predict the signal at a bit-level granularity by minimizing the prediction loss. A log loss or binary cross-entropy loss function is used to monitor the bit level deviations between the real next signal values and the predicted next signal values, and the gradient of this loss function is computed using backpropagation to update the weights in the network.
(7) Ryan Heartfield, et al. Self-Configurable Cyber-Physical Intrusion Detection for Smart Homes Using Reinforcement Learning. IEEE TIFS.
Our experimental process consisted of three phases. Phase 1 was related to (i) live sample data collection of smart home behaviour (in terms of the data sources monitored) when not under attack and (ii) execution of each attack vector. This phase comprised two different types of experiments: one where users were present during data collection and another where no users were present in the household. Phase 2 was related to the adaptation of the offline reinforcement learning anomaly detection. Phase 3 was related to live monitoring of attack detection using the RL-optimised MAGPIE configuration.
Table III provides statistics about the live capture sample dataset for normal and attack execution experiments. Some attack vectors (WiFi de-authentication and ZigBee jamming) were observed to have a persistent effect on specific device behaviour, such as total connectivity loss to the WiFi network or disconnection of ZigBee nodes from the PAN, even after the attack had stopped. To ensure that persistent symptoms of one experiment did not interfere with another, after each attack execution, we reconnected affected devices and nodes to their respective networks and tested the automation rules to ensure that the smart home had returned to a known good state. For phase 1, each attack vector was executed independently so that normal and attack data samples were equally distributed with respect to the amount of time the smart home was monitored by MAGPIE under normal conditions and during attack execution. This process ensured that the captured dataset had a balanced set of normal and attack samples for testing. All live sample collection experiments were conducted on the training data for phase 2 reinforcement learning adaptation of the MAPGIE’s anomaly models, whereas phase 3 consisted of executing live attack vectors against the MAGPIE prototype in a real-time monitoring state with the optimised anomaly model configuration. During the experiment, the users interacted with the smart home according to their normal routine. This activity generated a dataset that represented natural smart home user behaviour. Table X shows the different types of interactions performed by the users.
(8) Mohammed A. Ambusaidi, et al. Building an Intrusion Detection System Using a Filter-Based Feature Selection Algorithm. IEEE TRANSACTIONS ON COMPUTERS.
In all experiments, the value of MI is estimated using the estimator proposed by Kraskov et al. [33] (discussed in Section 3.1). To select the best value of k used in the estimator for the approach of k-nearest neighbour, several experiments with different values for k are conducted. Through the experiments, we have found that the best estimated value of MI was achieved when k = 6, which is the same as the value suggested in [33]. In addition, the control parameter b for MIFS algorithm is varied in the range of [0,1], which is the range suggested in [11] and [34], with a step size of 0.1. The optimal value of b that gives the best accuracy rate is selected for a comparison with the proposed approach.
Empirical evidence shows that 0.3 is the best value for b in the three datasets, so we included the results with this optimal b value for comparison. We have also included the results with the value of b equal to 1, which is the same as the value applied in [34]. The reason of choosing different values of b is to test all possibilities of the feature rankings since the best value is undefined for the given problem. The experimental results of different values of b indicate that when the value is closer to 1 the MIFS algorithm assigns larger weights to the redundant features. In other words, the algorithm places more emphasis on the relation between input features rather than between input features and the class and vice versa.
Based on the above findings, to demonstrate the superiority of the proposed feature selection algorithm, five LSSVM-IDSs are built based on all features and the features that are chosen using four different feature selection algorithms (i.e., the proposed FMIFS, MIFS (b = 0.3), MIFS (b = 1), FLCFS), respectively, with k ¼ 6. Three different datasets, namely KDD Cup 99 [41], NSL-KDD [24] and Kyoto 2006+ dataset [25], are used to evaluate the performance of these IDSs. The experimental results of the LSSVM-IDS based on FMIFS are compared with the results using the other four LSSVM-IDSs and several other state-of-the-art IDSs.
For the experiments on Kyoto 2006+ dataset, the data of 27, 28, 29, 30 and 31 August 2009 are selected, which contain the latest updated data. For the experimental aims on each dataset, 152,460 samples are randomly selected. A 10-fold cross-validation is used to evaluate the detection performance of the proposed LSSVM-IDS. In addition, in order to make a comparison with the detection system proposed in [20], the same sets of data captured from 1st to 3rd November 2007 are chosen for evaluation too. The comparison results are shown in Table 6.
(9) Xinghua Li, et al. Sustainable Ensemble Learning Driving Intrusion Detection Model. IEEE TDSC.
This experiment uses the benchmark dataset NSL-KDD and 2014 standard dataset disclosed in the field of intrusion detection to evaluate the performance of our model. These public datasets have been pre-processed by common means and have become the organized data. Employing public datasets, on the one hand, can effectively reduce the impact of different datasets on the experimental results, on the other hand, it can enhance the experiment’s reproducibility. The NSL-KDD dataset is collected in the US Air Force network environment, including various user types and network traffic. The original file contains more than 5 million records, including four significant traffics (i.e., DoS, Probe, U2L, and R2L) of attack and normal types. Our experiments use 10 percent of the sample data as the main experimental data. In order to further show the performance of our model in different network environments, we also use the standard dataset released by the Critical Infrastructure Protection Center of Mississippi State University in 2014 to evaluate our model. The dataset contains data on the network attack of two control systems: Gas and Water. The experimental environment is PC, Windows7 64-bit system, i7-6700 3.4 GHz CPU, 8 G RAM, Python language and scikit-learn machine learning library as programming languages and tools.
注意:下一篇将介绍实验分析、实验对比和讨论。
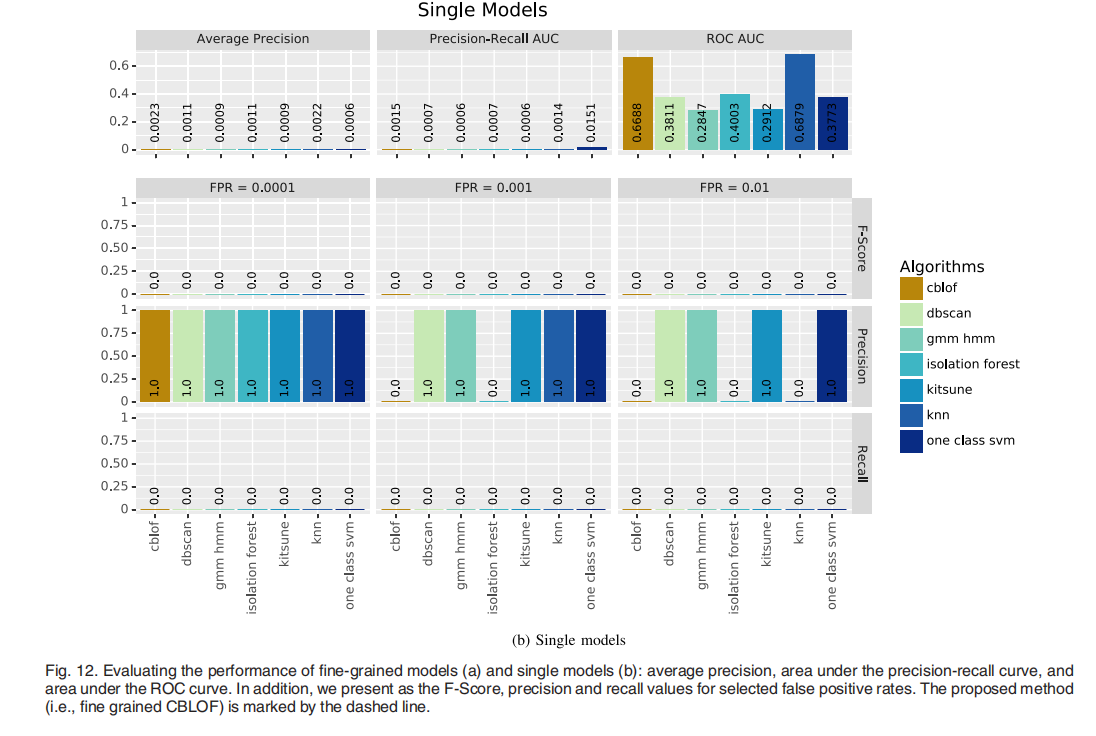
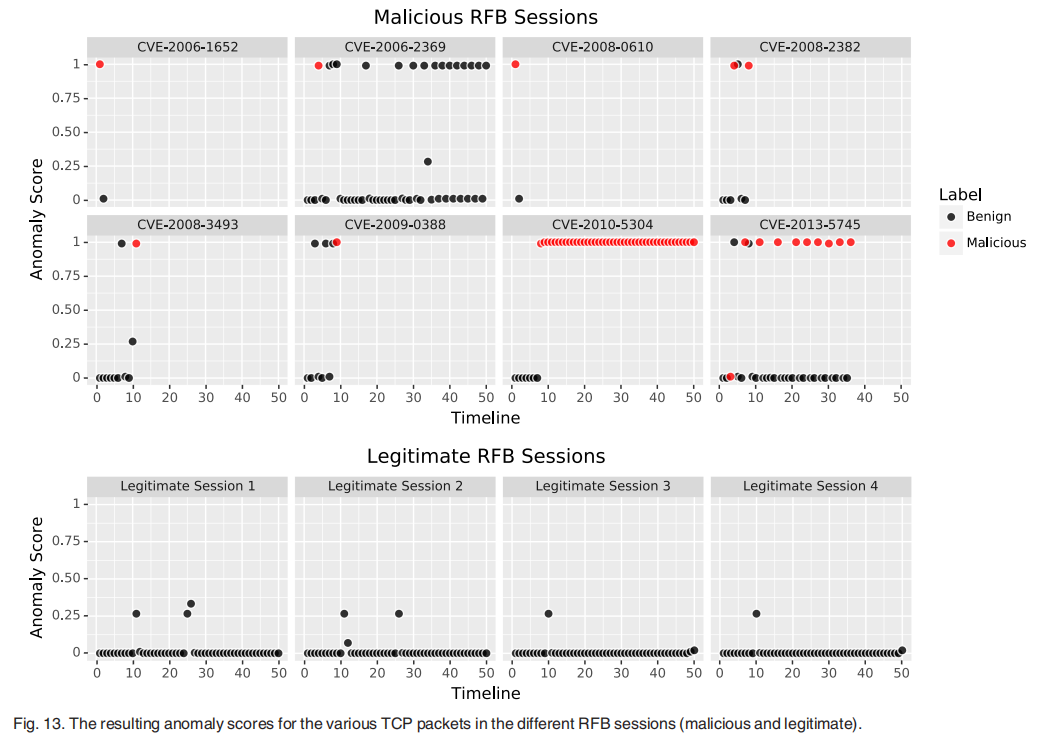
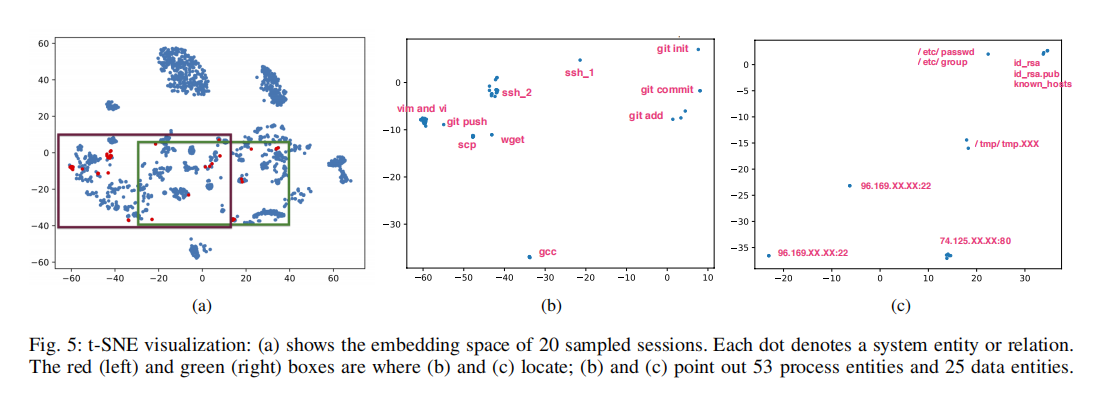
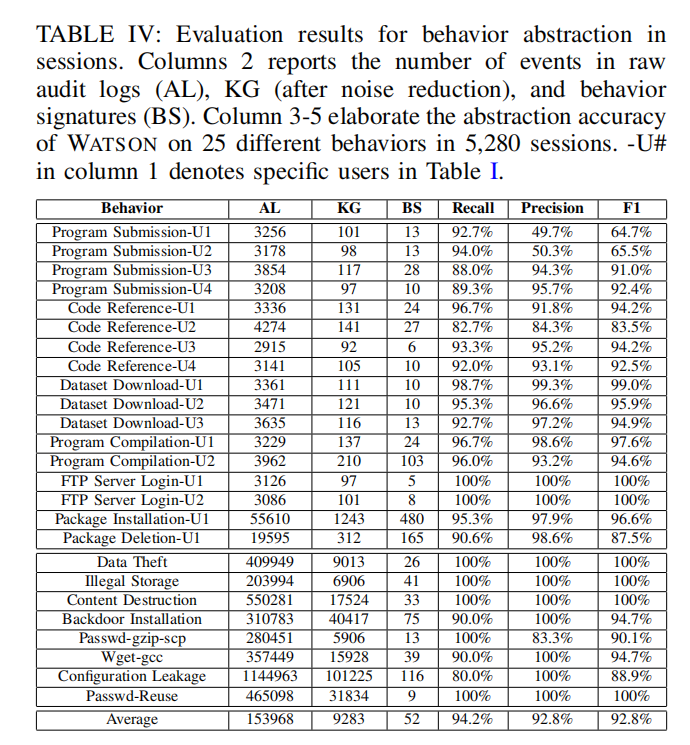
三.实验图表
(1) Ryan Heartfield, et al. Self-Configurable Cyber-Physical Intrusion Detection for Smart Homes Using Reinforcement Learning. TIFS.
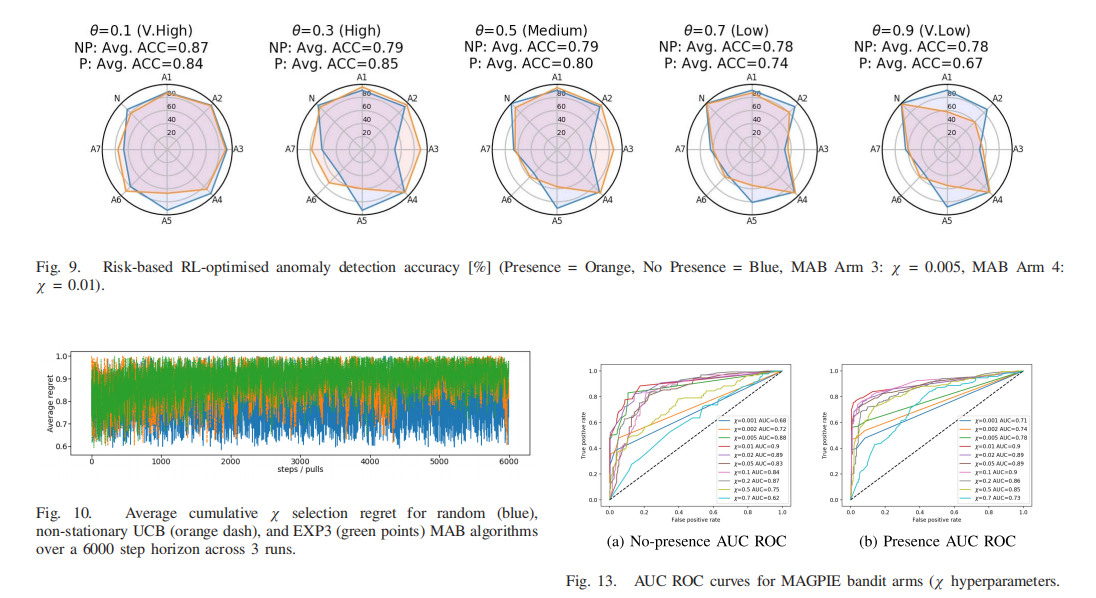
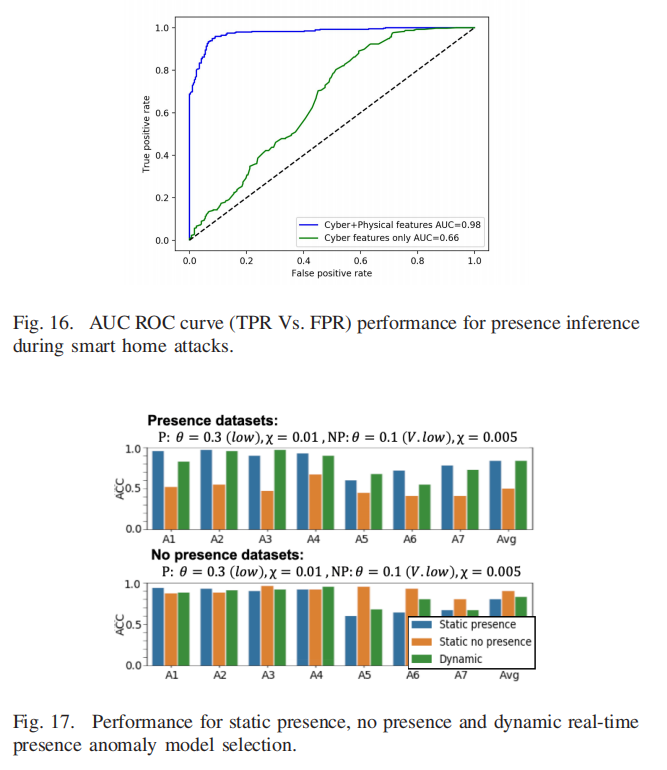
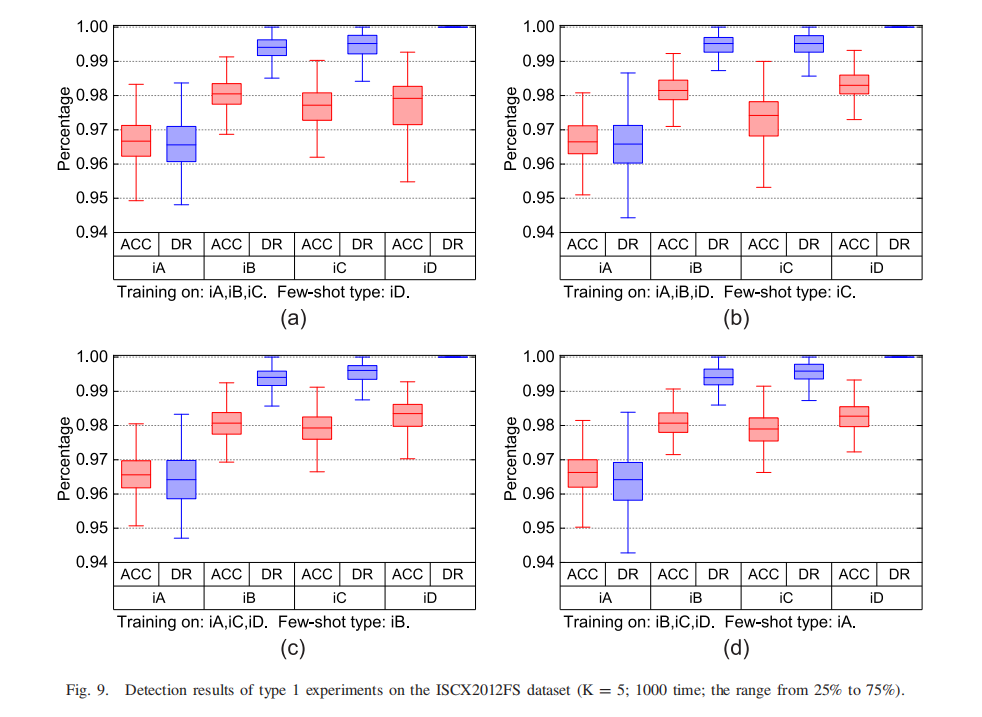
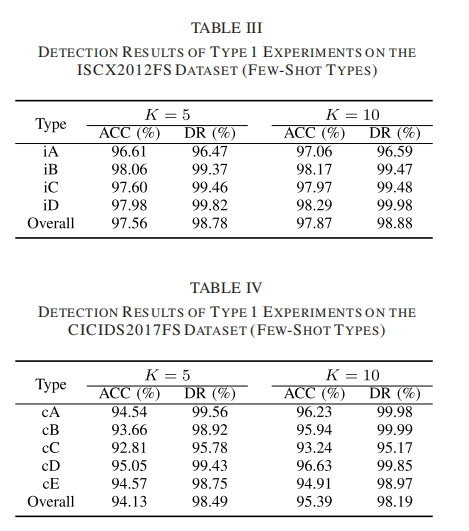
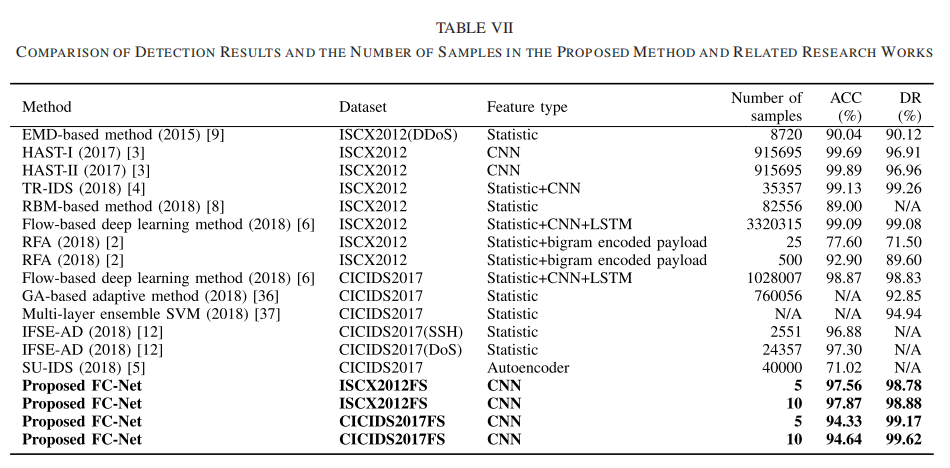
(2) Congyuan Xu, et al. A Method of Few-Shot Network Intrusion Detection Based on Meta-Learning Framework. TIFS.
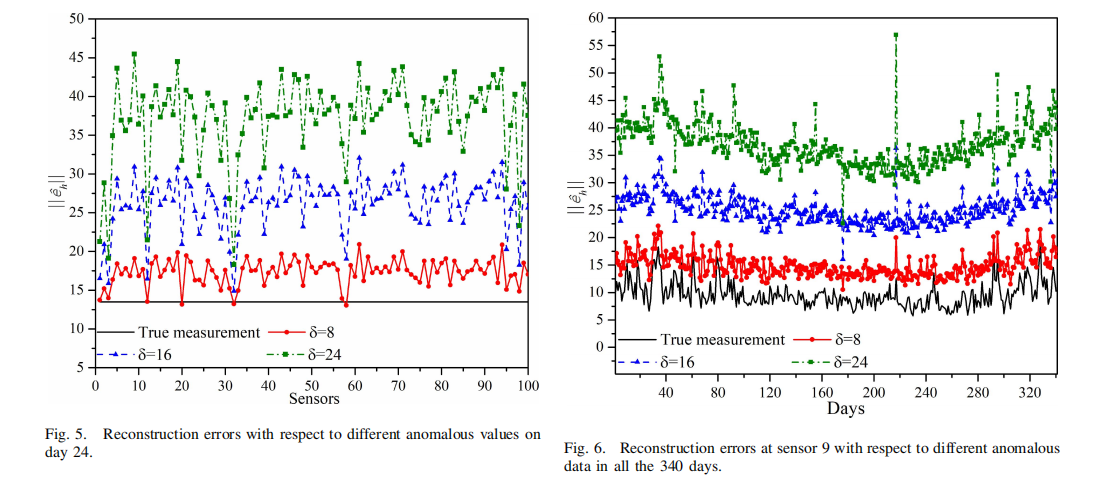
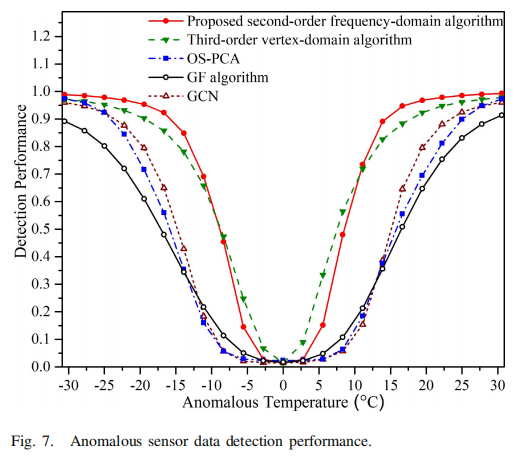
(4) Zhenlong Xiao, et al. Anomalous IoT Sensor Data Detection: An Efficient Approach Enabled by Nonlinear Frequency-Domain Graph Analysis. IOTJ.
(5) Hongda Li, et al. vNIDS: Towards Elastic Security with Safe and Efficient Virtualization of Network Intrusion Detection Systems. CCS.
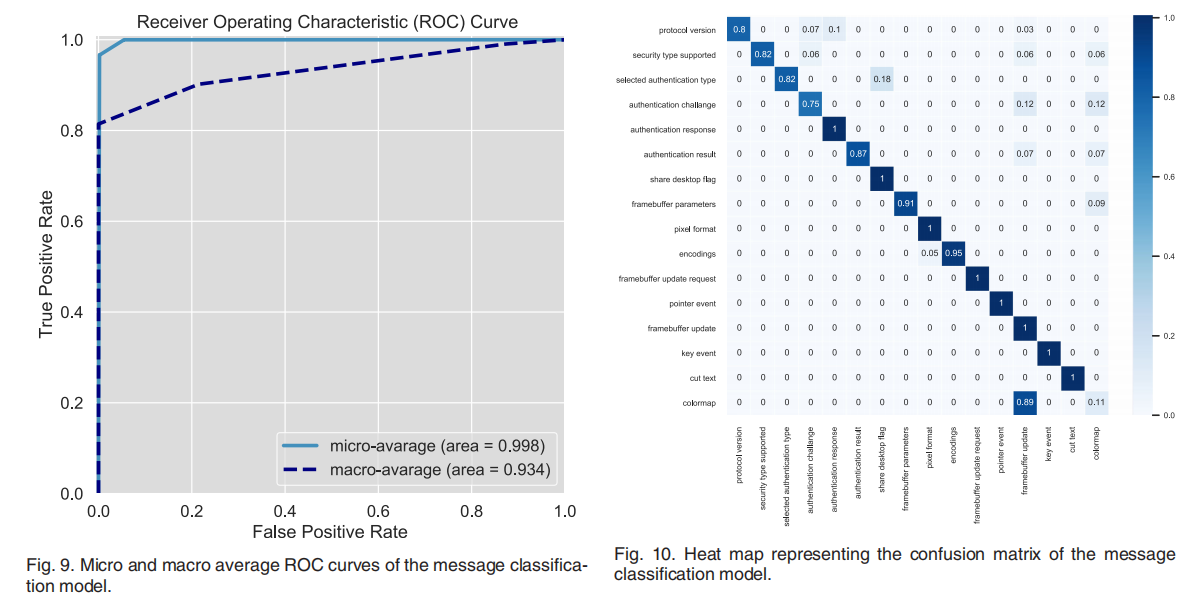
(6) Ron Bitton, et al. A Machine Learning-Based Intrusion Detection System for Securing Remote Desktop Connections to Electronic Flight Bag Servers. TDSC.
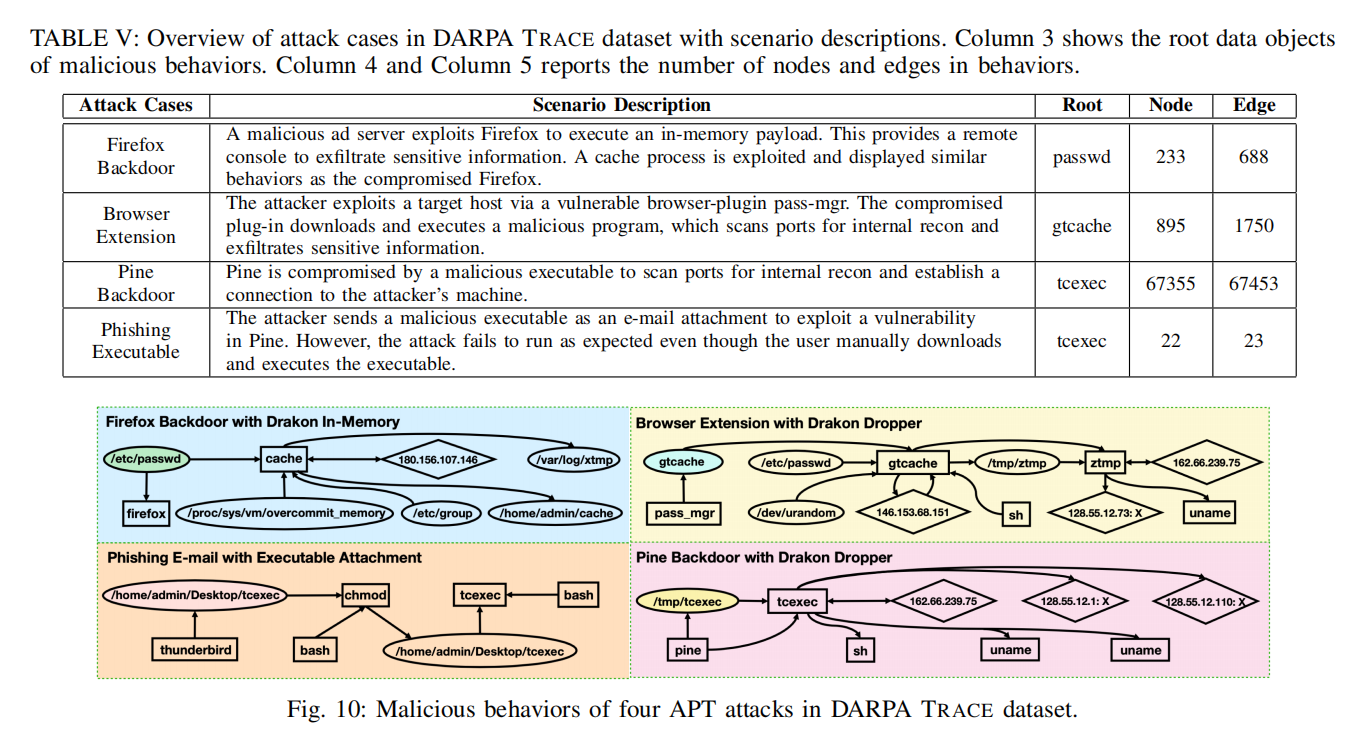
(10) Jun Zeng, et al. WATSON: Abstracting Behaviors from Audit Logs via Aggregation of Contextual Semantics. NDSS.
(11) Sunwoo Ahn, et al. Hawkware: Network Intrusion Detection based on Behavior Analysis with ANNs on an IoT Device. IEEE DAC.
四.总结
这篇文章就写到这里了,希望对您有所帮助。由于作者英语实在太差,论文的水平也很低,写得不好的地方还请海涵和批评。同时,也欢迎大家讨论,真心推荐原文。学安全两年,认识了很多安全大佬和朋友,希望大家一起进步。同时非常感谢参考文献中的大佬们,感谢老师、实验室小伙伴们的教导和交流,深知自己很菜,得努力前行。感恩遇见,且行且珍惜,小珞珞太可爱了,哈哈。

最后感谢CSDN和读者们十年的陪伴,不论外面如何评价CSDN,这里始终是我的家,在这里写文章很温馨,也认识了很多大佬和朋友。此外,个人感觉今年是我近十年文章质量最高的一年,每一篇都写得很用心,都是我的血肉,很多都要自己从零去学习再分享,也希望帮助更多初学者。总之,希望自己还能写二十年,五十年,一辈子。
(By:Eastmount 2021-12-14 晚上12点 http://blog.csdn.net/eastmount/ )
最后
以上就是机灵舞蹈最近收集整理的关于[论文阅读] (14)英文论文实验评估(Evaluation)如何撰写及精句摘抄(上)——以入侵检测系统(IDS)为例一.实验评估如何撰写二.入侵检测系统论文实验评估句子三.实验图表四.总结的全部内容,更多相关[论文阅读]内容请搜索靠谱客的其他文章。


![[论文阅读] (14)英文论文实验评估(Evaluation)如何撰写及精句摘抄(上)——以入侵检测系统(IDS)为例一.实验评估如何撰写二.入侵检测系统论文实验评估句子三.实验图表四.总结](https://www.shuijiaxian.com/files_image/reation/bcimg12.png)


发表评论 取消回复