1.直方图
# simple histogram
hist(mtcars$mpg) #未指定任何选项时的默认图形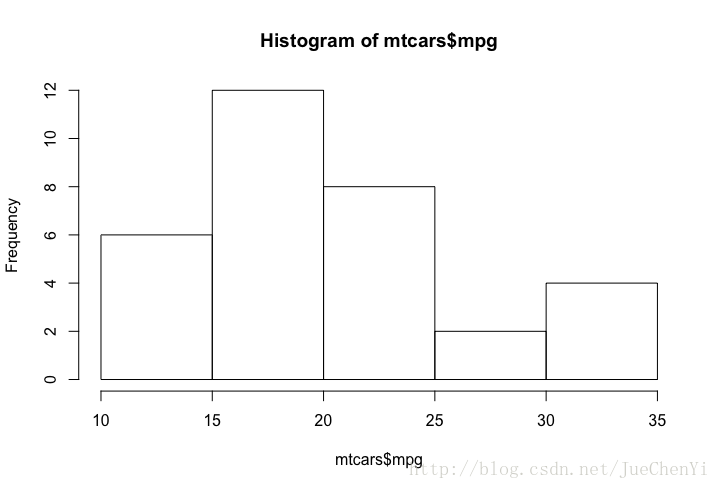
# colored histogram with specified number of bins
hist(mtcars$mpg,
     breaks=12, #分组个数
     col="red",  #红色
     xlab="Miles Per Gallon", # x轴标签
     main="Colored histogram with 12 bins")# 标题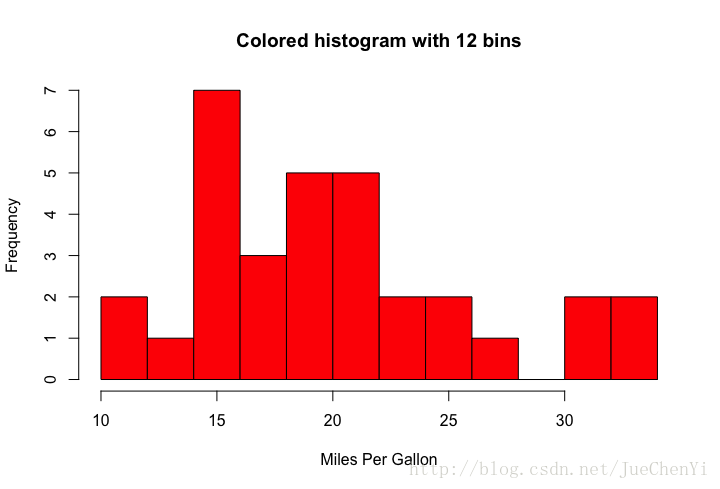
# colored histogram with rug plot, frame, and specified number of bins
hist(mtcars$mpg,
     freq=FALSE,
     breaks=12,
     col="red",
     xlab="Miles Per Gallon",
     main="Histogram, rug plot, density curve")
rug(jitter(mtcars$mpg))
lines(density(mtcars$mpg), col="blue", lwd=2)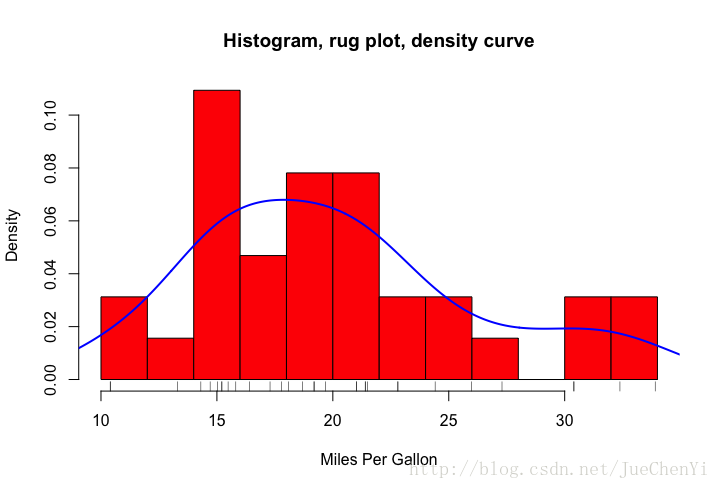
# histogram with superimposed normal curve (Thanks to Peter Dalgaard)
x <- mtcars$mpg
h<-hist(x,
        breaks=12,
        col="red",
        xlab="Miles Per Gallon",
        main="Histogram with normal curve and box")
xfit<-seq(min(x),max(x),length=40)
yfit<-dnorm(xfit,mean=mean(x),sd=sd(x))
yfit <- yfit*diff(h$mids[1:2])*length(x)
lines(xfit, yfit, col="blue", lwd=2)
box()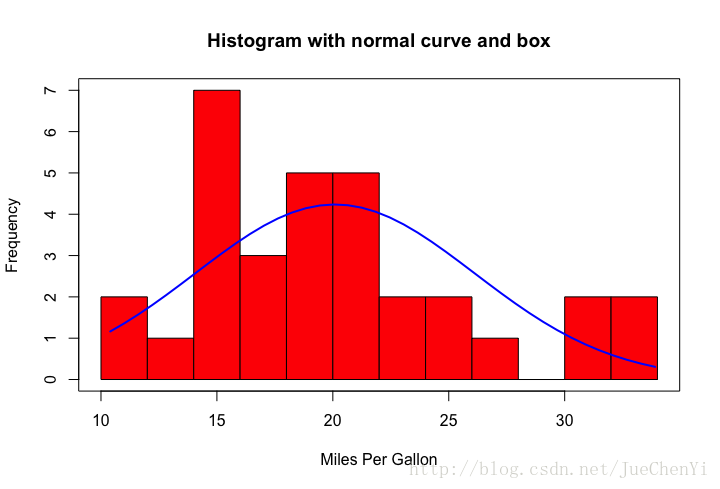
2.核密度图
d <- density(mtcars$mpg) # returns the density data
plot(d) # plots the results 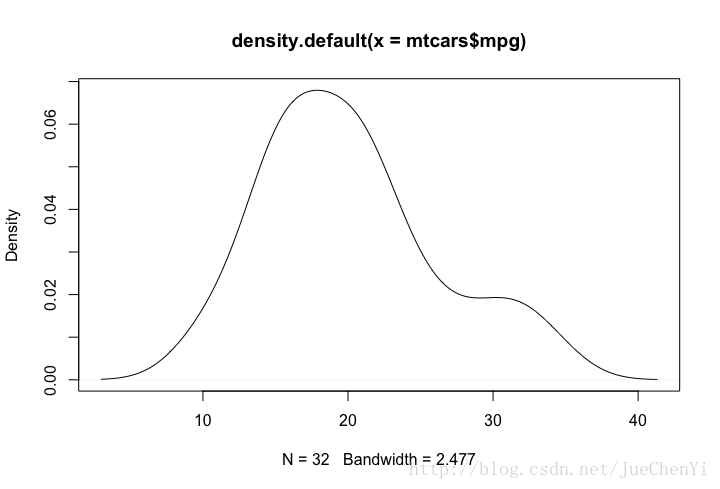
d <- density(mtcars$mpg)
plot(d, main="Kernel Density of Miles Per Gallon")
polygon(d, col="red", border="blue")
rug(mtcars$mpg, col="brown") 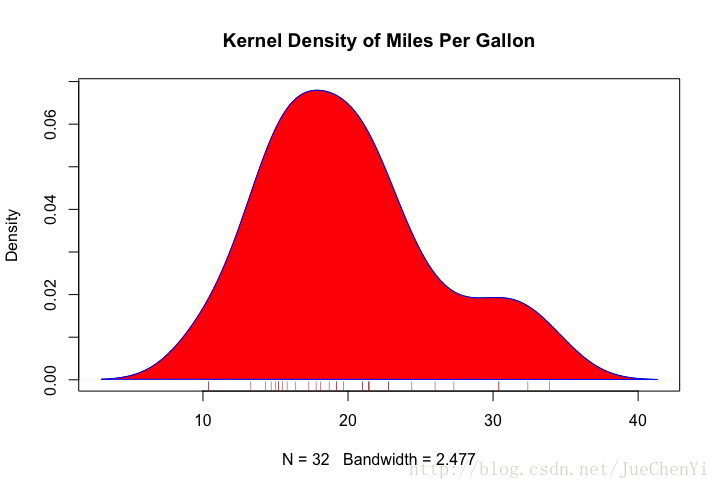
参考:《R in action–Data Analysis and Graphics with R》
最后
以上就是老实花卷最近收集整理的关于R中的直方图和核密度图绘制的全部内容,更多相关R中内容请搜索靠谱客的其他文章。
本图文内容来源于网友提供,作为学习参考使用,或来自网络收集整理,版权属于原作者所有。


发表评论 取消回复