利用sklearn的库,中文文档sklearn之决策树,本人python的版本一直用的是py3.7
1.概述
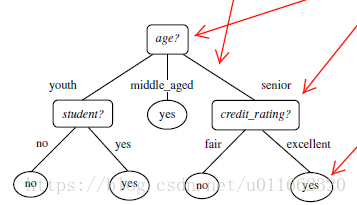
决策树(判定树)是一个类似于流程图的树结构:其中,每个内部结点表示在一个属性上的测试,每个分支代表一个属性输出,而每个树叶结点代表类或类分布。树的最顶层是根结点。
2.决策树算法: ID3, C4.5, C5.0 和 CART
ID3(Iterative Dichotomiser 3)由 Ross Quinlan 在1986年提出。该算法创建一个多路树,找到每个节点(即以贪心的方式)分类特征,这将产生分类目标的最大信息增益。决策树发展到其最大尺寸,然后通常利用剪枝来提高树对未知数据的泛华能力。
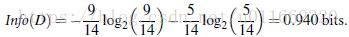
信息获取量(Information Gain):Gain(A) = Info(D) - Infor_A(D)
通过A来作为节点分类获取了多少信息
C4.5 是 ID3 的后继者,并且通过动态定义将连续属性值分割成一组离散间隔的离散属性(基于数字变量),消除了特征必须被明确分类的限制。C4.5 将训练的树(即,ID3算法的输出)转换成 if-then 规则的集合。然后评估每个规则的这些准确性,以确定应用它们的顺序。如果规则的准确性没有改变,则需要决策树的树枝来解决。
C5.0 是 Quinlan 根据专有许可证发布的最新版本。它使用更少的内存,并建立比 C4.5 更小的规则集,同时更准确。
CART(Classification and Regression Trees (分类和回归树))与 C4.5 非常相似,但它不同之处在于它支持数值目标变量(回归),并且不计算规则集。CART 使用在每个节点产生最大信息增益的特征和阈值来构造二叉树。
scikit-learn 使用 CART 算法的优化版本。
3.熵(entropy)概念:
信息和抽象,如何度量?
1948年,香农提出了 ”信息熵(entropy)“的概念, 一条信息的信息量大小和它的不确定性有直接的关系,要搞清楚一件非常非常不确定的事情,或者是我们一无所知的事情,需要了解大量信息==>信息量的度量就等于不确定性的多少
比特(bit)来衡量信息的多少,计算公式

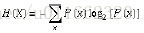
变量的不确定性越大,熵也就越大
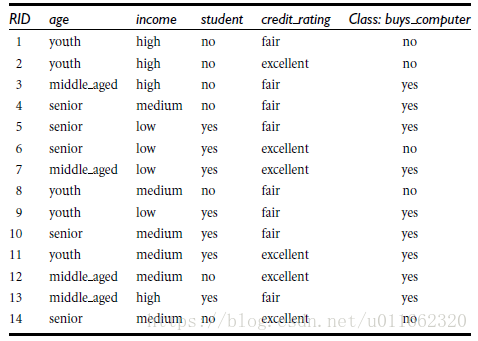
4.例子
通过比较四种属性,age,income,student,credit_raating,来进行分类,判断这个用户是否购买电脑
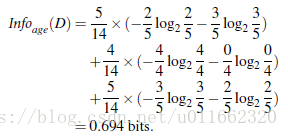

类似,Gain(income) = 0.029, Gain(student) = 0.151, Gain(credit_rating)=0.048
所以,选择age作为第一个根节点
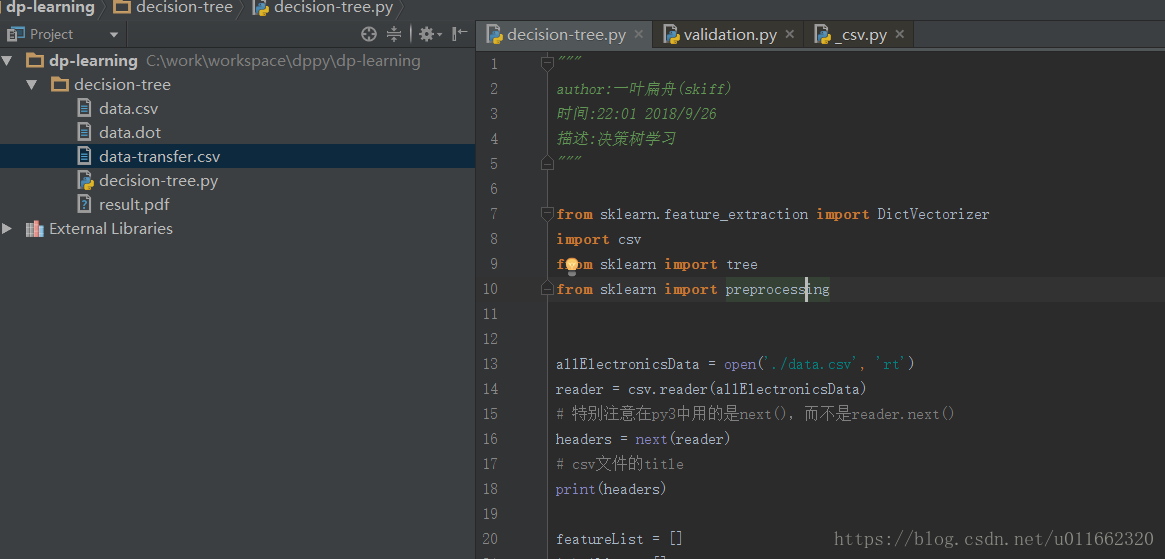
5.例子代码(前提装了scikit-learn等机器学习库)
python代码:
"""
author:一叶扁舟(skiff)
时间:22:01 2018/9/26
描述:决策树学习
"""
from sklearn.feature_extraction import DictVectorizer
import csv
from sklearn import tree
from sklearn import preprocessing
allElectronicsData = open('./data.csv', 'rt')
reader = csv.reader(allElectronicsData)
# 特别注意在py3中用的是next(),而不是reader.next()
headers = next(reader)
# csv文件的title
print(headers)
featureList = []
labelList = []
for row in reader:
# 存入每一行的最后一列数据,是否购买电脑,即分类结果yes or no
labelList.append(row[len(row)-1])
rowDict = {}
for i in range(1, len(row)-1):
# 每一行是一个字典,字典的key是对应列的头标题,value是每一行对应列的值
# 即key为'RID', 'age', 'income', 'student', 'credit_rating', 'class_buys_computer'
rowDict[headers[i]] = row[i]
# 将cvs文件的数据,存到python的集合中
featureList.append(rowDict)
print(featureList)
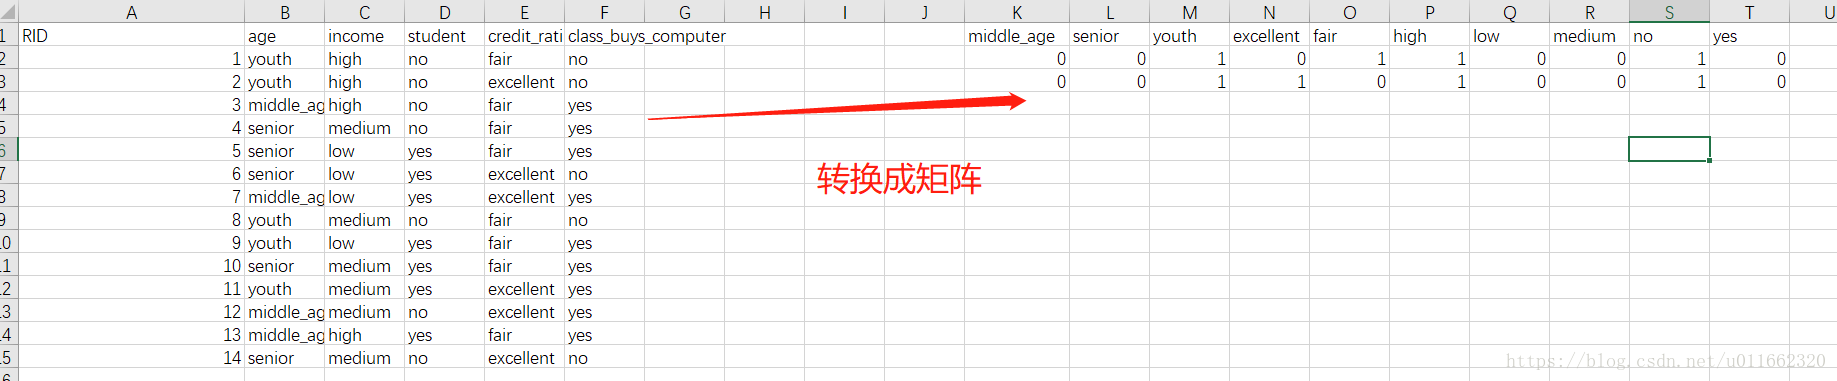
vec = DictVectorizer()
# 将list集合转成0,1格式的矩阵,注意这个特征值矩阵是将特征集合中所有的特征作为矩阵中的一列,如果和定义列值相同则置为1,否则置为0
# 在本特征值集合中总共有10中特征,即矩阵的列为10列,为14*10的矩阵
dummyX = vec.fit_transform(featureList) .toarray()
print("dummyX:n " + str(dummyX))
print(vec.get_feature_names())
print("labelList: " + str(labelList))
# 将分类结果(yes or no),转成矩阵0,1格式
# no : 0
# yes : 1
lb = preprocessing.LabelBinarizer()
dummyY = lb.fit_transform(labelList)
print("dummyY: " + str(dummyY))
# 使用决策树进行分类采用哪种策略进行分类:entropy:使用信息熵进行分类
# clf = tree.DecisionTreeClassifier()
clf = tree.DecisionTreeClassifier(criterion='entropy')
# 建模
clf = clf.fit(dummyX, dummyY)
print("clf: " + str(clf))
# Visualize model
with open("data.dot", 'w') as f:
# 将0,1转成原始的数据,需要传入参数vec.get_feature_names()
f = tree.export_graphviz(clf, feature_names=vec.get_feature_names(), out_file=f)
# 取出第一行学习集的数据
oneRowX = dummyX[0, :]
print("oneRowX: " + str(oneRowX))
newRowX = oneRowX
# 修改将第一数据中的youth改为middle_age
newRowX[0] = 1
newRowX[2] = 0
print("newRowX: " + str(newRowX))
# 测试数据,看学习模型预测的结果
predictedY = clf.predict([newRowX])
# predictedY的结果为1则说明会买电脑
print("predictedY: " + str(predictedY))
6.项目截图
7.结果输出
['RID', 'age', 'income', 'student', 'credit_rating', 'class_buys_computer']
[{'age': 'youth', 'income': 'high', 'student': 'no', 'credit_rating': 'fair'}, {'age': 'youth', 'income': 'high', 'student': 'no', 'credit_rating': 'excellent'}, {'age': 'middle_aged', 'income': 'high', 'student': 'no', 'credit_rating': 'fair'}, {'age': 'senior', 'income': 'medium', 'student': 'no', 'credit_rating': 'fair'}, {'age': 'senior', 'income': 'low', 'student': 'yes', 'credit_rating': 'fair'}, {'age': 'senior', 'income': 'low', 'student': 'yes', 'credit_rating': 'excellent'}, {'age': 'middle_aged', 'income': 'low', 'student': 'yes', 'credit_rating': 'excellent'}, {'age': 'youth', 'income': 'medium', 'student': 'no', 'credit_rating': 'fair'}, {'age': 'youth', 'income': 'low', 'student': 'yes', 'credit_rating': 'fair'}, {'age': 'senior', 'income': 'medium', 'student': 'yes', 'credit_rating': 'fair'}, {'age': 'youth', 'income': 'medium', 'student': 'yes', 'credit_rating': 'excellent'}, {'age': 'middle_aged', 'income': 'medium', 'student': 'no', 'credit_rating': 'excellent'}, {'age': 'middle_aged', 'income': 'high', 'student': 'yes', 'credit_rating': 'fair'}, {'age': 'senior', 'income': 'medium', 'student': 'no', 'credit_rating': 'excellent'}]
dummyX:
 [[0. 0. 1. 0. 1. 1. 0. 0. 1. 0.]
 [0. 0. 1. 1. 0. 1. 0. 0. 1. 0.]
 [1. 0. 0. 0. 1. 1. 0. 0. 1. 0.]
 [0. 1. 0. 0. 1. 0. 0. 1. 1. 0.]
 [0. 1. 0. 0. 1. 0. 1. 0. 0. 1.]
 [0. 1. 0. 1. 0. 0. 1. 0. 0. 1.]
 [1. 0. 0. 1. 0. 0. 1. 0. 0. 1.]
 [0. 0. 1. 0. 1. 0. 0. 1. 1. 0.]
 [0. 0. 1. 0. 1. 0. 1. 0. 0. 1.]
 [0. 1. 0. 0. 1. 0. 0. 1. 0. 1.]
 [0. 0. 1. 1. 0. 0. 0. 1. 0. 1.]
 [1. 0. 0. 1. 0. 0. 0. 1. 1. 0.]
 [1. 0. 0. 0. 1. 1. 0. 0. 0. 1.]
 [0. 1. 0. 1. 0. 0. 0. 1. 1. 0.]]
['age=middle_aged', 'age=senior', 'age=youth', 'credit_rating=excellent', 'credit_rating=fair', 'income=high', 'income=low', 'income=medium', 'student=no', 'student=yes']
labelList: ['no', 'no', 'yes', 'yes', 'yes', 'no', 'yes', 'no', 'yes', 'yes', 'yes', 'yes', 'yes', 'no']
dummyY: [[0]
 [0]
 [1]
 [1]
 [1]
 [0]
 [1]
 [0]
 [1]
 [1]
 [1]
 [1]
 [1]
 [0]]
clf: DecisionTreeClassifier(class_weight=None, criterion='entropy', max_depth=None,
            max_features=None, max_leaf_nodes=None,
            min_impurity_decrease=0.0, min_impurity_split=None,
            min_samples_leaf=1, min_samples_split=2,
            min_weight_fraction_leaf=0.0, presort=False, random_state=None,
            splitter='best')
oneRowX: [0. 0. 1. 0. 1. 1. 0. 0. 1. 0.]
newRowX: [1. 0. 0. 0. 1. 1. 0. 0. 1. 0.]
predictedY: [1]
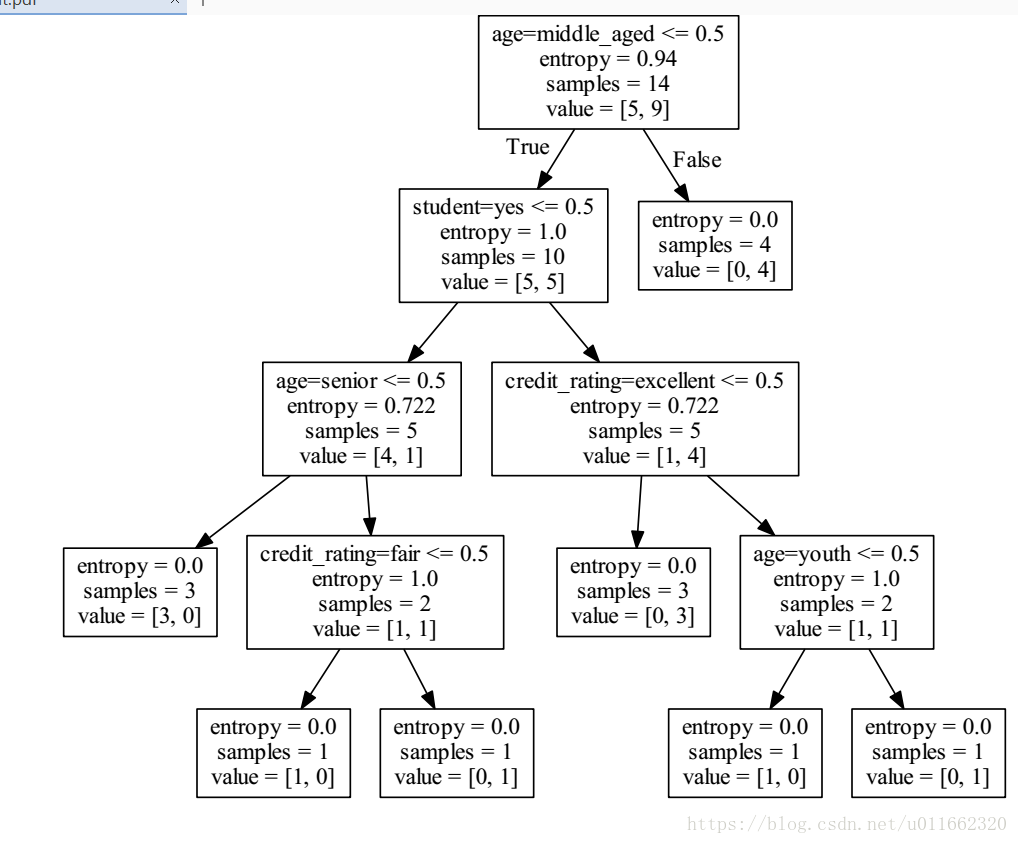
8.利用Graphviz生成可视化图
安装 Graphviz: http://www.graphviz.org/
需要配置环境变量,path里面指向C:Program Files (x86)Graphviz2.38bin
转化dot文件至pdf可视化决策树:dot -Tpdf data.dot -o result.pdf
最后
以上就是壮观太阳最近收集整理的关于机器学习基础笔记--决策树的全部内容,更多相关机器学习基础笔记--决策树内容请搜索靠谱客的其他文章。


发表评论 取消回复