Prometheus 作为监控后起之秀,尽管有不足之处,但是不妨碍我们使用和喜爱它。根据我们长期的使用经验来看,它足以满足大多数场景需求,只不过对于开源软件,往往需要根据业务去二次开发才能发挥出最大能力。
官方网站:
https://prometheus.io/
官方下载地址:
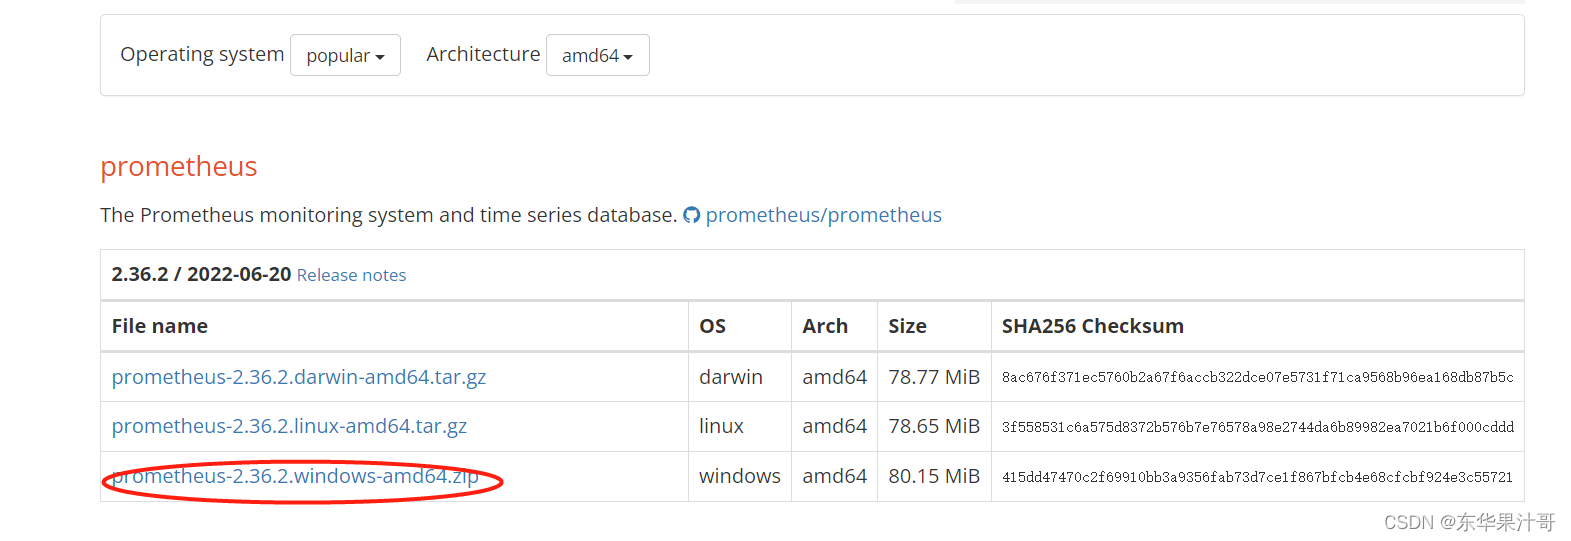
https://prometheus.io/download/
可以下载linux 系统也可以下载windows系统,这里我们选择下载windows版本试试。
下载完成之后,解压到指定目录下。如本地:D:softwareprometheus-2.36.2.windows-amd64
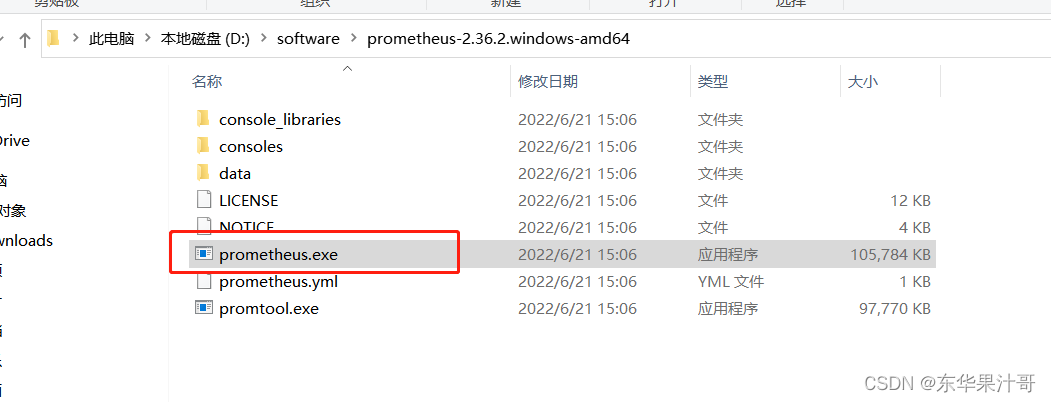
运行prometheus.exe 文件,启动服务。
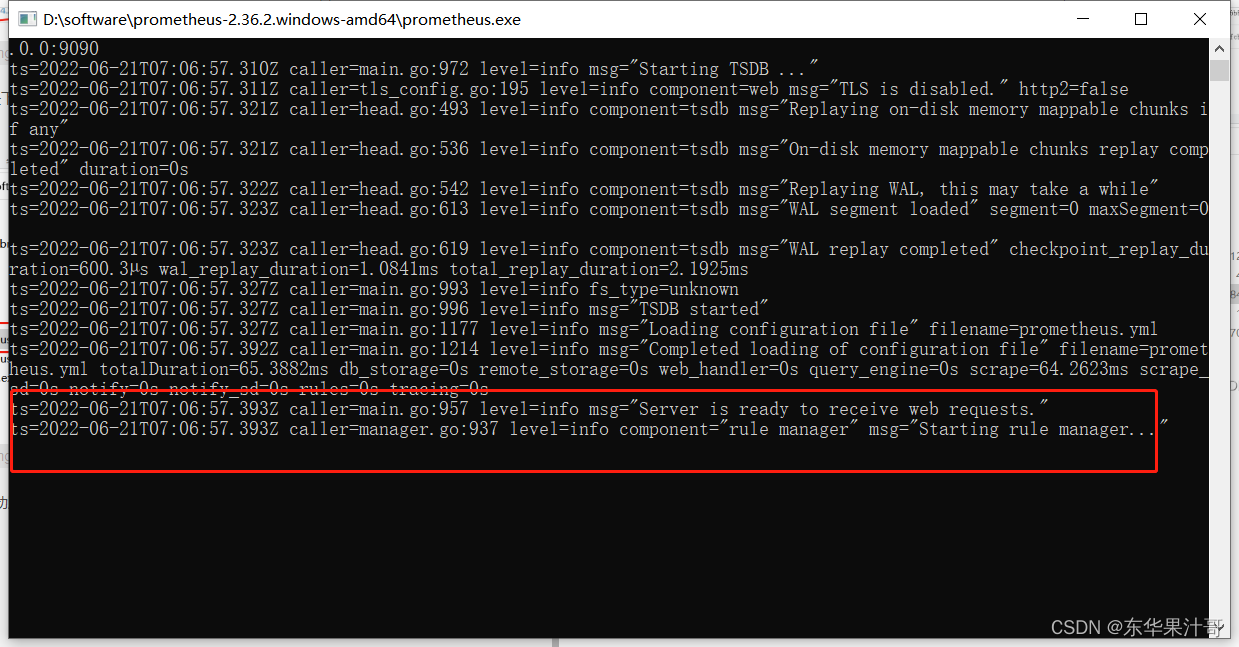
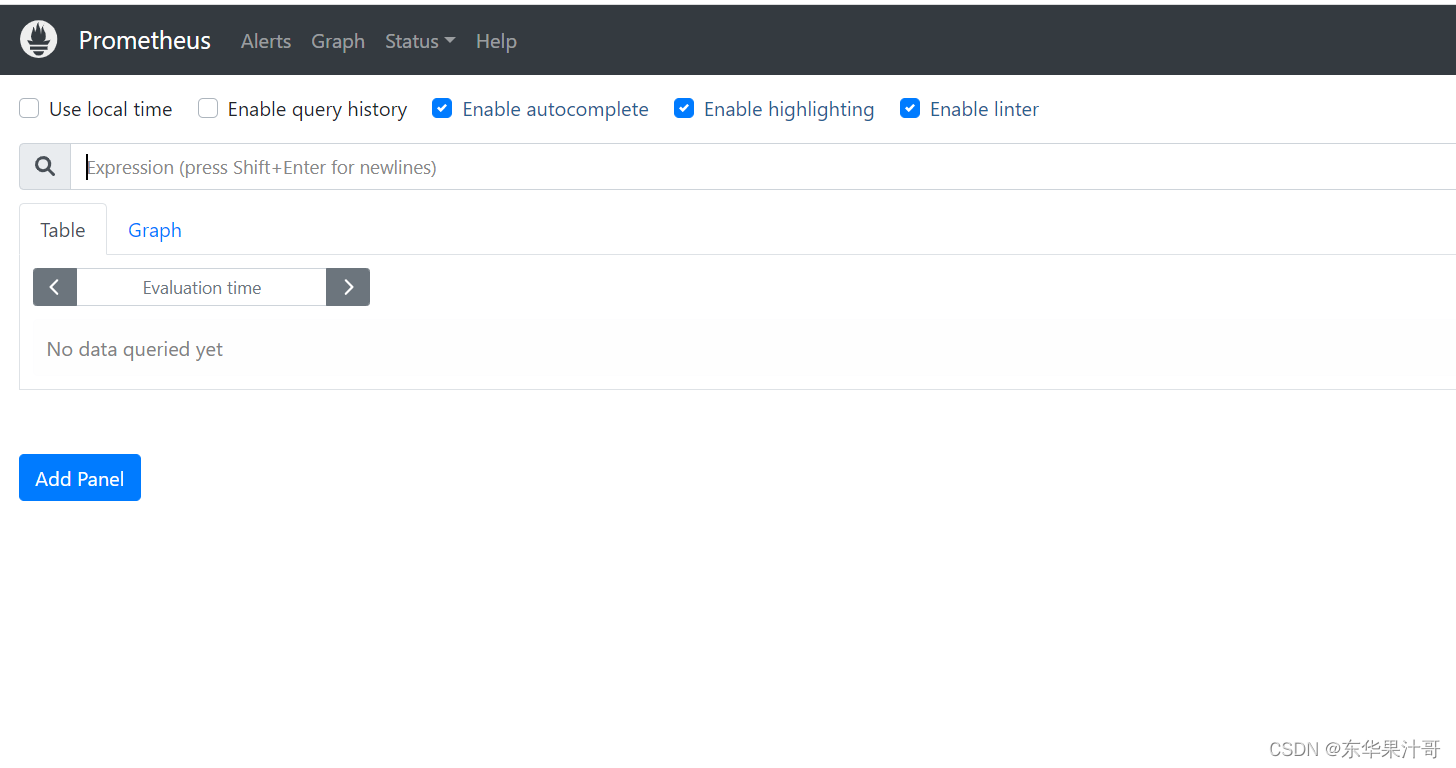
当出现标红部分的字样时,说明我们的服务已经开启。这时候,我们可以打开浏览器,输入地址:
localhost:9090
通过在prometheus.yml配置文件中,添加如下配置。我们让Prometheus可以从node exporter暴露的服务中获取监控指标数据。
scrape_configs:
  - job_name: 'prometheus'
    static_configs:
      - targets: ['localhost:9090']
  - job_name: 'node'
    static_configs:
      - targets: ['localhost:9100']
最后
以上就是花痴电灯胆最近收集整理的关于【prometheus 监控系统】带你了解一款好用的企业监控系统-普罗米修斯的全部内容,更多相关【prometheus内容请搜索靠谱客的其他文章。
本图文内容来源于网友提供,作为学习参考使用,或来自网络收集整理,版权属于原作者所有。


发表评论 取消回复