多个纵坐标
可参考:https://blog.csdn.net/weixin_43794311/article/details/105133372
%matplotlib
import matplotlib.pyplot as plt
import numpy as np

x = np.arange(0, 10, 0.1)
y1 = 0.05 * x**2
y2 = -1 *y1

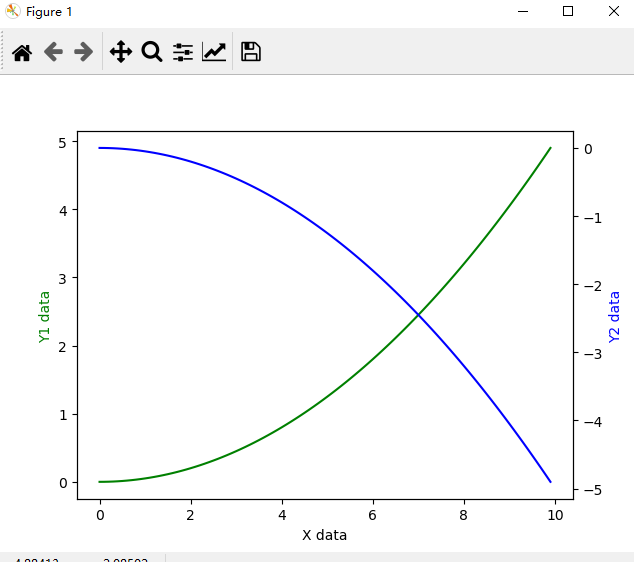
fig, ax1 = plt.subplots()

ax2 = ax1.twinx()    # mirror the ax1,建立一个和ax1在x方向镜像的纵坐标
ax1.plot(x, y1, 'g-')
ax2.plot(x, y2, 'b-')### 数值的刚好相反,是因为y1和y2刚好是取得相反数

ax1.set_xlabel('X data')
ax1.set_ylabel('Y1 data', color='g')
ax2.set_ylabel('Y2 data', color='b')

plt.show()

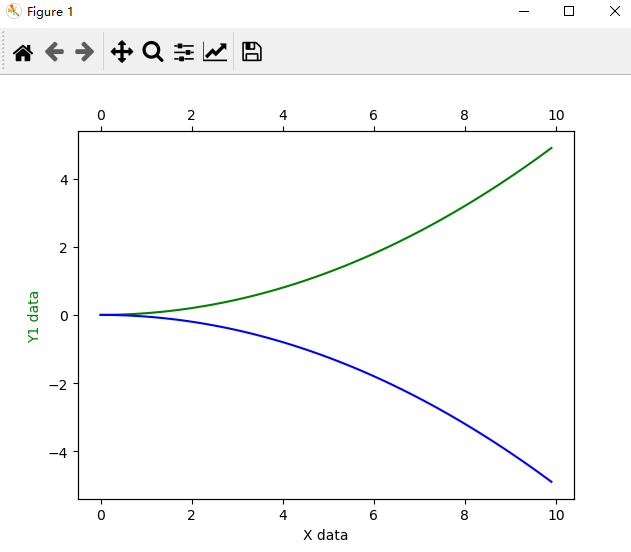
可以看出都是使用的公共x的值,变化的都是y的值,镜像的轴是x轴还是y轴平移不同
ax2 = ax1.twiny() #会显示下图

动画展示
%matplotlib
import numpy as np
from matplotlib import pyplot as plt
from matplotlib import animation
import time

fig, ax = plt.subplots()

x = np.arange(0, 2*np.pi, 0.01) #x∈[0,2Π]以0.01为一个间隔
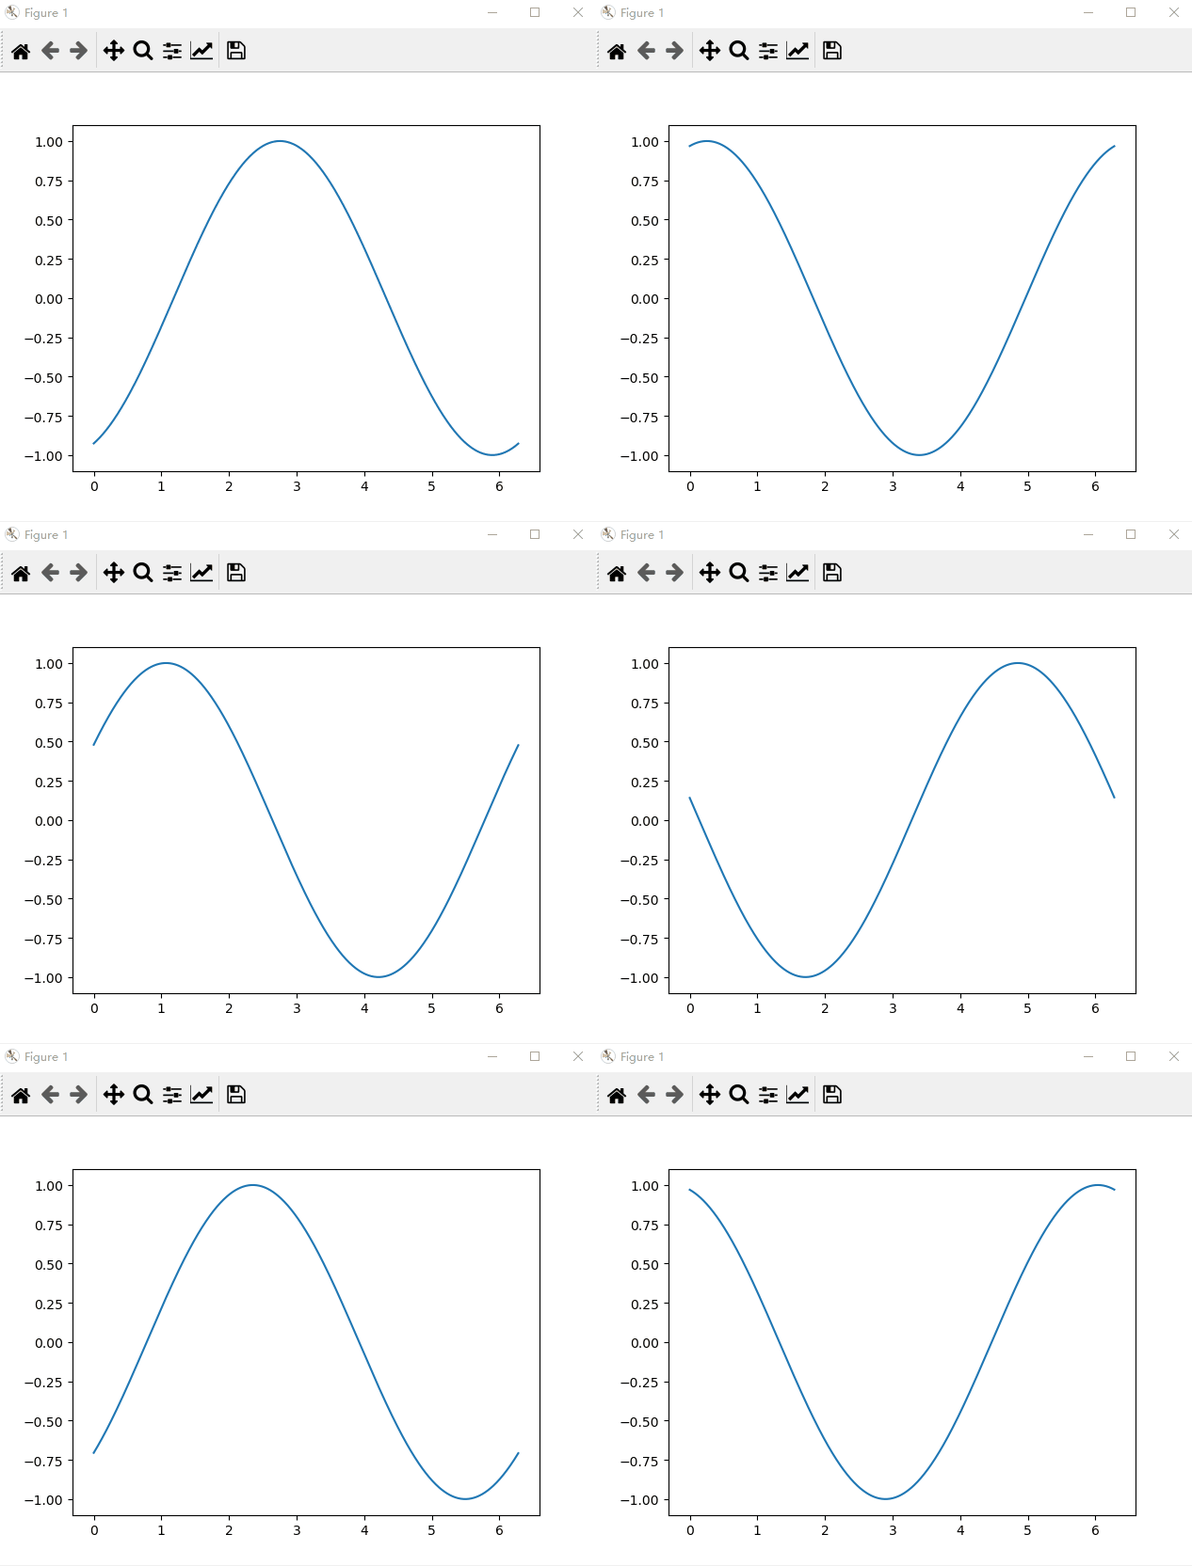
line, = ax.plot(x, np.sin(x)) #画出一个周期的正弦图像


def animate(i):
    line.set_ydata(np.sin(x + i/10.0))  # update the data
#     print (i) #i值是帧数
  #  print(time.time())
    return line,


# Init only required for blitting to give a clean slate.
def init():
    line.set_ydata(np.sin(x))

    return line,

# call the animator.  blit=True means only re-draw the parts that have changed.
# blit=True dose not work on Mac, set blit=False
# interval= update frequency
ani = animation.FuncAnimation(fig=fig, func=animate, frames=100, init_func=init,
                              interval=20, blit=False)

# save the animation as an mp4.  This requires ffmpeg or mencoder to be
# installed.  The extra_args ensure that the x264 codec is used, so that
# the video can be embedded in html5.  You may need to adjust this for
# your system: for more information, see
# http://matplotlib.sourceforge.net/api/animation_api.html
# anim.save('basic_animation.mp4', fps=30, extra_args=['-vcodec', 'libx264'])

plt.show()

最后
以上就是懵懂香烟最近收集整理的关于python-matplotlib(简短实用),多个纵坐标,动画显示的全部内容,更多相关python-matplotlib(简短实用)内容请搜索靠谱客的其他文章。
本图文内容来源于网友提供,作为学习参考使用,或来自网络收集整理,版权属于原作者所有。


发表评论 取消回复