1.使用cdn方式引入echarts
在public 中的index.html中引入

<!DOCTYPE html>
<html lang="en">
  <head>
    <meta charset="utf-8">
    <meta http-equiv="X-UA-Compatible" content="IE=edge">
    <meta name="viewport" content="width=device-width,initial-scale=1.0">
    <link rel="icon" href="<%= BASE_URL %>favicon.ico">
    <title><%= htmlWebpackPlugin.options.title %></title>
    <script src="//cdn.bootcss.com/echarts/4.2.1/echarts.simple.min.js"></script>
  </head>
  <body>
    <noscript>
      <strong>We're sorry but <%= htmlWebpackPlugin.options.title %> doesn't work properly without JavaScript enabled. Please enable it to continue.</strong>
    </noscript>
    <div id="app"></div>
    <!-- built files will be auto injected -->
  </body>
</html>
- 在需要画图表的页面中
<!--  -->
<template>
<div class='toDone-container' >
     <!-- 要给画图的容器高度,否则高度是0,图表显示不出来 -->
    <div id="echarts-box" style="width:100%;height:600px;">

    </div>
</div>
</template>

<script>
import echarts from 'echarts';  // 引入echarts
export default {
name:"ToDone",
components: {},
data() {
return {

};
},
computed: {},
watch: {},
methods: {
    getEcharts() {
        let myChart = echarts.init(document.getElementById("echarts-box"));   // 实例化
        console.log(myChart);
        let options = {  // 配置项
            title: {
                text: '折线图堆叠'
            },
            tooltip: {
                trigger: 'axis'
            },
            legend: {
                data: ['邮件营销', '联盟广告', '视频广告', '直接访问', '搜索引擎']
            },
            grid: {
                left: '3%',
                right: '4%',
                bottom: '3%',
                containLabel: true
            },
            toolbox: {
                feature: {
                    saveAsImage: {}
                }
            },
            xAxis: {
                type: 'category',
                boundaryGap: false,
                data: ['周一', '周二', '周三', '周四', '周五', '周六', '周日']
            },
            yAxis: {
                type: 'value'
            },
            series: [
                {
                    name: '邮件营销',
                    type: 'line',
                    stack: '总量',
                    data: [120, 132, 101, 134, 90, 230, 210]
                },
                {
                    name: '联盟广告',
                    type: 'line',
                    stack: '总量',
                    data: [220, 182, 191, 234, 290, 330, 310]
                },
                {
                    name: '视频广告',
                    type: 'line',
                    stack: '总量',
                    data: [150, 232, 201, 154, 190, 330, 410]
                },
                {
                    name: '直接访问',
                    type: 'line',
                    stack: '总量',
                    data: [320, 332, 301, 334, 390, 330, 320]
                },
                {
                    name: '搜索引擎',
                    type: 'line',
                    stack: '总量',
                    data: [820, 932, 901, 934, 1290, 1330, 1320]
                }
            ]
        }
        myChart.clear();   // 画图前清除下画布
        myChart.setOption(options);
        window.onresize = myChart.resize;  // 窗口大小变化时让图表跟着变化
    }
},
created() {
    this.$nextTick(() =>{
        this.getEcharts();
    })
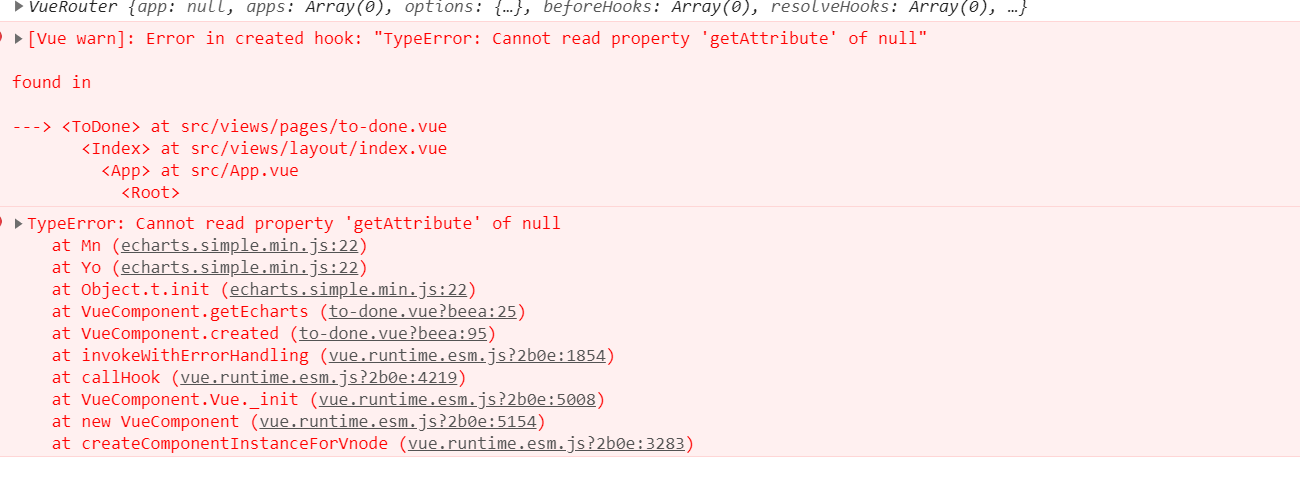
    // 要放在$nextTick中调用,否则此时dom还没渲染完成,生成实例时找不到 id 为echarts-box的容器,就会报错,报错信息如下图1
},
mounted() {

},
beforeCreate() {},
beforeMount() {},
beforeUpdate() {},
updated() {},
beforeDestroy() {},
destroyed() {},
activated() {},
}
</script>
<style lang='less' scoped>

</style>
报错图1

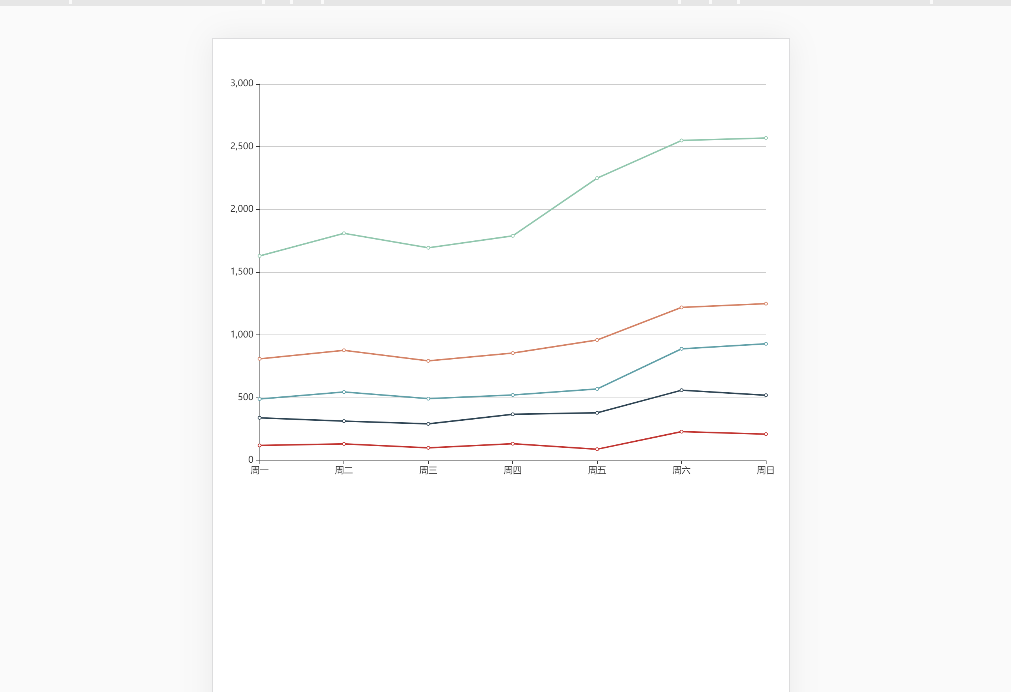
- 完成之后效果图如下

最后
以上就是曾经灯泡最近收集整理的关于vue 项目中使用echarts图表的步骤的全部内容,更多相关vue内容请搜索靠谱客的其他文章。
本图文内容来源于网友提供,作为学习参考使用,或来自网络收集整理,版权属于原作者所有。


发表评论 取消回复