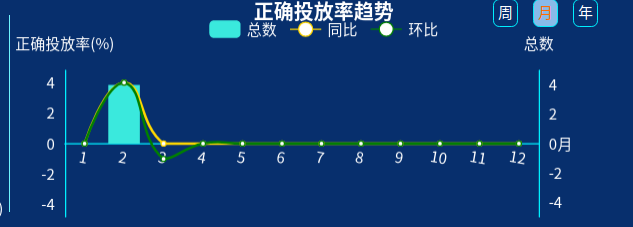
import echarts from ‘echarts’
import { correctLaunchTrend } from ‘@/api/test’
export default {
name: ‘CorrectLaunchTrend’,
data() {
return {
name: ‘正确投放率趋势’,
datestr: ‘month’,
weekStyle: {
color: ‘#ffffff’,
backgroundColor: ‘#072f6d’
},
monthStyle: {
color: ‘#FF6B00’,
backgroundColor: ‘#88BAE9’
},
yearStyle: {
color: ‘#ffffff’,
backgroundColor: ‘#072f6d’
},
option: {
title: {
text: ‘正确投放率趋势’,
x: ‘center’,
textStyle: {
color: ‘#ffffff’,
fontSize: 16
},
},
textStyle: {
color: ‘#ffffff’
},
tooltip: {
trigger: ‘axis’
},
legend: {
data: [‘总数’, ‘同比’, ‘环比’],
show: true,
top: ‘8%’,
textStyle: {
color: ‘#ffffff’
}
},
grid: {
left: ‘3%’,
right: ‘12%’,
bottom: ‘7%’,
containLabel: true
},
toolbox: {
feature: {
saveAsImage: {
show: false
}
}
},
xAxis: [{
type: ‘category’,
name: ‘月’,
position: ‘center’,
splitLine: { // 去除网格
show: false
},
axisLabel: { // 倾斜角度
show: false,
interval: 0,
rotate: -20
},
axisLine: { // 轴线颜色
// onZero: false,
lineStyle: {
color: ‘#00EFFF’,
width: 1
}
},
data: [],
axisTick: { // 去除刻度线
show: false
}
}],
yAxis: [
{
type: ‘value’,
position: ‘left’,
name: ‘正确投放率(%)’,
max: function (value) {
if (Math.abs(value.max) > Math.abs(value.min)) {
return (Math.abs(value.max) * 1.2).toFixed(2)
} else {
return (Math.abs(value.min) * 1.2).toFixed(2)
}
},
min: function (value) {
if (Math.abs(value.max) > Math.abs(value.min)) {
return (-Math.abs(value.max) * 1.2).toFixed(2)
} else {
return (-Math.abs(value.min) * 1.2).toFixed(2)
}
},
splitLine: { // 去除网格
show: false
},
axisLine: {
// onZero: false,
lineStyle: {
color: ‘#00EFFF’,
width: 1
}
},
axisTick: {
show: false
},
},
{
type: ‘value’,
position: ‘right’,
name: ‘总数’,
max: function (value) {
if (Math.abs(value.max) > Math.abs(value.min)) {
return (Math.abs(value.max) * 1.2).toFixed(0)
} else {
return (Math.abs(value.min) * 1.2).toFixed(0)
}
},
min: function (value) {
if (Math.abs(value.max) > Math.abs(value.min)) {
return (-Math.abs(value.max) * 1.2).toFixed(0)
} else {
return (-Math.abs(value.min) * 1.2).toFixed(0)
}
},
minInterval: 1, // 刻度间隔无小数
splitLine: { // 去除网格
show: false
},
axisLine: {
onZero: false,
lineStyle: {
color: ‘#00EFFF’,
width: 1
}
},
axisTick: {
show: false
},
}
],
color: [‘rgba(58, 233, 221, 1)’, ‘#FFD700’, ‘green’],
series: [
{
name: ‘总数’,
type: ‘bar’,
stack: ‘总数’,
tooltip: {
trigger: ‘axis’
},
yAxisIndex: 1,
itemStyle: {
normal: {
borderRadius: 5,
label: {
show: true,
rotate: -10,
position: ‘bottom’,
formatter: ‘{b}’
}
}
},
data: []
},
{
name: ‘同比’,
type: ‘line’,
stack: ‘同比’,
smooth: true,
data: [],
tooltip: {
trigger: ‘axis’
},
yAxisIndex: 0,
},
{
name: ‘环比’,
type: ‘line’,
stack: ‘环比’,
smooth: true,
data: [],
tooltip: {
trigger: ‘axis’
},
yAxisIndex: 0
}
]
}
}
},
mounted() {
this.KaTeX parse error: Expected '}', got 'EOF' at end of input: …arts.init(this.refs.lineChart).setOption(this.option)
})
},
methods: {
getData() {
let that = this
correctLaunchTrend(that.datestr).then(function (response) {
that.option.xAxis[0].data = []
that.option.series[0].data = []
that.option.series[1].data = []
that.option.series[2].data = []
let list = response.data
for (const index in list) {
that.option.xAxis[0].data.push(list[index].timeScale)
that.option.series[0].data.push(list[index].num)
if (that.datestr === ‘week’ || that.datestr === ‘year’) {
that.option.series[1].data = []
that.option.legend.data = [‘总数’, ‘环比’]
that.option.color = [‘rgba(58, 233, 221, 1)’, ‘green’]
} else {
that.option.series[1].data.push((list[index].sameCompared).toFixed(2))
that.option.legend.data = [‘总数’, ‘同比’, ‘环比’]
that.option.color = [‘rgba(58, 233, 221, 1)’, ‘#FFD700’, ‘green’]
}
that.option.series[2].data.push((list[index].trend).toFixed(2))
}
echarts.init(that.$refs.lineChart).setOption(that.option)
}).catch(function (error) {
console.log(error)
})
},
// 获取周数据
getWeek() {
this.weekStyle = { color: ‘#FF6B00’, backgroundColor: ‘#88BAE9’ }
this.monthStyle = { color: ‘#ffffff’, backgroundColor: ‘#072f6d’ }
this.yearStyle = { color: ‘#ffffff’, backgroundColor: ‘#072f6d’ }
this.option.xAxis[0].name = ‘日(近七天)’
this.datestr = ‘week’
this.getData()
},
// 获取月数据
getMonth() {
this.monthStyle = { color: ‘#FF6B00’, backgroundColor: ‘#88BAE9’ }
this.weekStyle = { color: ‘#ffffff’, backgroundColor: ‘#072f6d’ }
this.yearStyle = { color: ‘#ffffff’, backgroundColor: ‘#072f6d’ }
this.option.xAxis[0].name = ‘月’
this.datestr = ‘month’
this.getData()
},
// 获取年数据
getYear() {
this.yearStyle = { color: ‘#FF6B00’, backgroundColor: ‘#88BAE9’ }
this.weekStyle = { color: ‘#ffffff’, backgroundColor: ‘#072f6d’ }
this.monthStyle = { color: ‘#ffffff’, backgroundColor: ‘#072f6d’ }
this.option.xAxis[0].name = ‘年(近五年)’
this.datestr = ‘year’
this.getData()
}
}
}

最后
以上就是心灵美月亮最近收集整理的关于echarts联合图表的全部内容,更多相关echarts联合图表内容请搜索靠谱客的其他文章。


发表评论 取消回复