以下的全部内容都是yolo-v3-spp的预测模块
项目全部代码已上传至GitHub: yolov3-spp-annotations.
目录标题
- 一、predict.py
- 二、几个重要函数
- 2.1、letterbox函数
- 2.2、non_max_suppression函数
- 2.3、scale_coords函数
- 2.4、draw_box函数
- Reference
一、predict.py
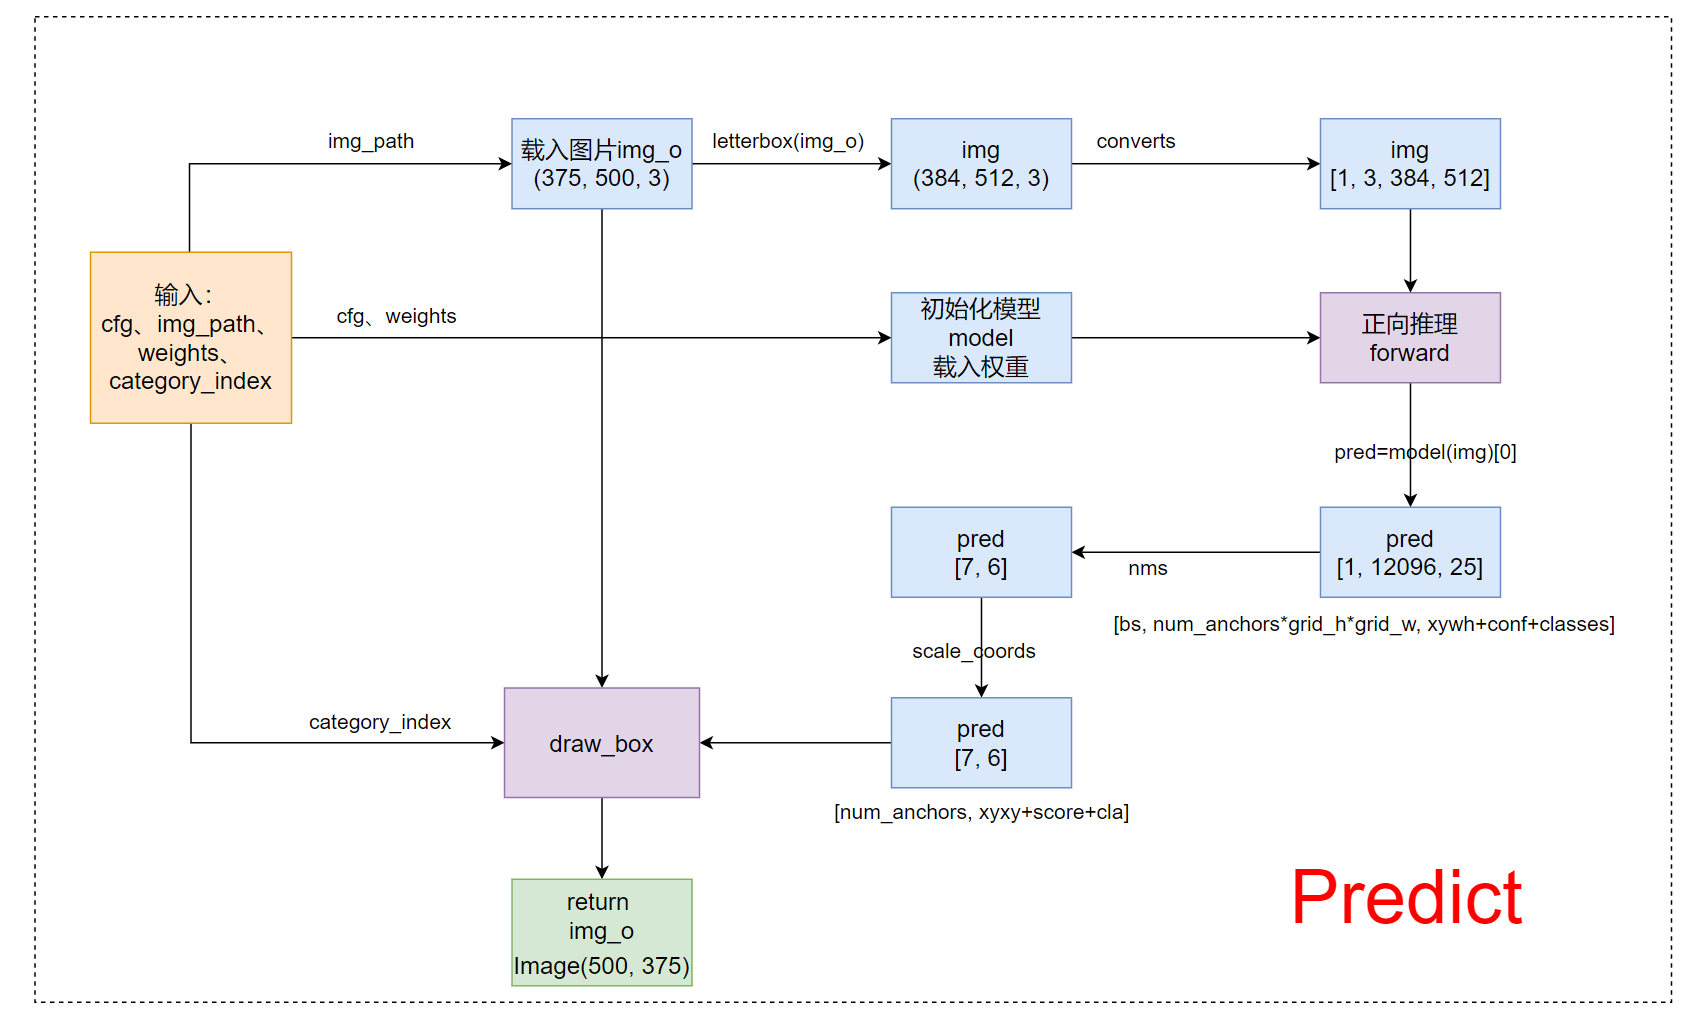
1、整体流程

2、代码
import os
import json
import time
import torch
import cv2
import argparse
import numpy as np
from matplotlib import pyplot as plt
from build_utils import datasets
from modules.model import DarkNet
from train_val_utils.draw_box_utils import draw_box
from train_val_utils.other_utils import time_synchronized, check_file
from train_val_utils.post_processing_utils import non_max_suppression, scale_coords


def main(opt):
    device = torch.device("cuda:0" if torch.cuda.is_available() else "cpu")
    print("Using {} device training.".format(device.type))


    # 1、载入opt参数
    cfg = opt.cfg               # yolo网络配置文件path
    weights = opt.weights       # 训练权重path
    json_path = opt.json_path   # voc classes json path
    img_path = opt.img_path     # 预测图片地址
    img_size = opt.img_size     # 预测图像大小(letterbox后)


    # 2、载入json文件 得到所有class
    json_file = open(json_path, 'r')
    class_dict = json.load(json_file)
    category_index = {v: k for k, v in class_dict.items()}


    # 3、初始化模型 模型载入权重
    model = DarkNet(cfg)
    model.load_state_dict(torch.load(weights, map_location=device)["model"], strict=False)
    model.to(device)


    # eval测试模式
    model.eval()
    with torch.no_grad():
        # 载入原图 img_o (375, 500, 3)  H W C
        img_o = cv2.imread(img_path)  # BGR numpy格式
        assert img_o is not None, "Image Not Found " + img_path

        # letterbox  numpy格式(array)   img:(384, 512, 3) H W C
        # 将原图最长边缩放到指定大小,再将原图较短边按原图比例缩放,最后将较短边两边pad操作缩放到最长边大小(不会失真)
        img = datasets.letterbox(img_o, new_shape=img_size, auto=True, color=(0, 0, 0))[0]

        # Convert (384, 512, 3) => (384, 512, 3) => (3, 384, 512)
        # img[:, :, ::-1]  BGR to RGB => transpose(2, 0, 1) HWC(384, 512, 3)  to  CHW(3, 384, 512)
        img = img[:, :, ::-1].transpose(2, 0, 1)
        img = np.ascontiguousarray(img)  # 使内存是连续的

        # numpy(3, 384, 512) CHW => torch.tensor [3, 384, 512] CHW
        img = torch.from_numpy(img).to(device).float()
        img /= 255.0  # 归一化scale (0, 255) to (0, 1)
        # [3, 384, 512] CHW => [1, 3, 384, 512] BCHW
        img = img.unsqueeze(0)  # add batch dimension

        # start inference
        t1 = time_synchronized()  # 获取当前时间 其实可以用time.time()
        # 推理阶段实际上会有两个返回值 x(相对原图的), p
        # x: predictor数据处理后的输出(数值是相对原图的,这里是img)
        #    [batch_size, anchor_num * grid * grid, xywh + obj + classes]
        #    这里pred[1,12096,25] (实际上是等于x)表示这张图片总共生成了12096个anchor(一个grid中三个anchor)
        # p: predictor原始输出即数据是相对feature map的
        #    [batch_size, anchor_num, grid, grid, xywh + obj + classes]
        pred = model(img)[0]  # only get inference result
        t2 = time_synchronized()
        print("model inference time:", t2 - t1)
        # nms pred=[7,6]=[obj_num, xyxy+score+cls] 这里的xyxy是相对img的
        # pred: 按score从大到小排列; output[0]=第一张图片的预测结果 不一定一次只传入一张图片的
        pred = non_max_suppression(pred)[0]
        t3 = time.time()
        print("nms time:", t3 - t2)

        if pred is None:
            print("No target detected.")
            exit(0)

        # 将nms后的预测结果pred tensor格式(是相对img上的)img.shape=[B,C,H,W]
        # 映射到原图img_o上 img_o.shape=[H, W, C]  pred=(anchor_nums, xyxy+score+class)
        pred[:, :4] = scale_coords(img.shape[2:], pred[:, :4], img_o.shape).round()
        print("pred shape:", pred.shape)

        # tensor.detach()截断tensor变量反向传播的梯度流,因为是预测所以不需要计算梯度信息
        # bboxes、scores、classes: 按score从大到小排列  tensor=>numpy
        bboxes = pred[:, :4].detach().cpu().numpy()  # xyxys
        scores = pred[:, 4].detach().cpu().numpy()   # scores
        classes = pred[:, 5].detach().cpu().numpy().astype(int) + 1  # classes

        # 到这一步,我们就得到了最终的相对原图的所有预测信息bboxes(位置信息)(7,4); scores(7); classes(类别)(7)

        # 画出每个预测结果
        img_o = draw_box(img_o[:, :, ::-1], bboxes, classes, scores, category_index)

        # 显示预测图片
        plt.imshow(img_o)
        plt.show()

        # 保存预测后的图片
        img_o.save("outputs/predict_result.jpg")


if __name__ == "__main__":
    parser = argparse.ArgumentParser()
    parser.add_argument('--cfg', type=str, default='cfg/yolov3-spp.cfg', help="cfg/*.cfg path")
    parser.add_argument('--weights', type=str, default='weights/yolov3spp-voc-512.pt',
                        help='pretrain weights path')
    parser.add_argument('--json-path', type=str, default='data/pascal_voc_classes.json',
                        help="voc_classes_json_path")
    parser.add_argument('--img-path', type=str, default='imgs/2008_000011.jpg',
                        help="predict img path")
    parser.add_argument('--img-size', type=int, default=512,
                        help="predict img path [416, 512, 608] 32的倍数")

    opt = parser.parse_args()

    # 检查文件是否存在
    opt.cfg = check_file(opt.cfg)
    opt.data = check_file(opt.weights)
    opt.hyp = check_file(opt.json_path)
    opt.hyp = check_file(opt.img_path)
    print(opt)

    main(opt)
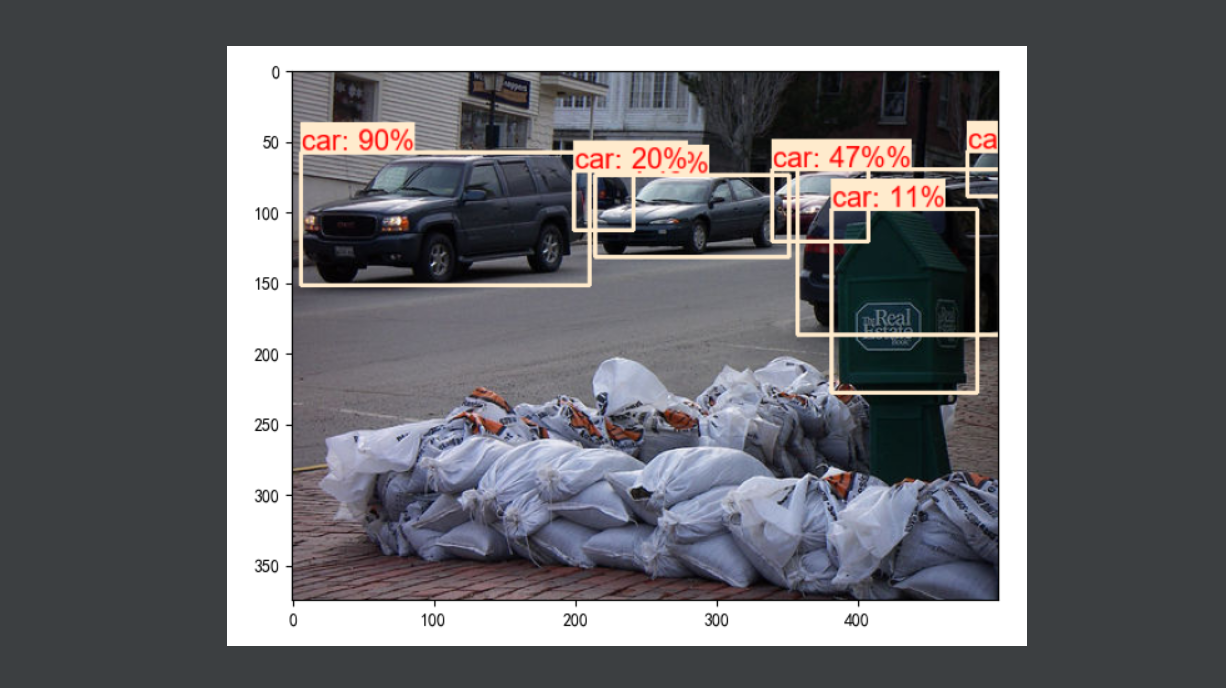
3、执行效果

二、几个重要函数
上面的predict.py就是预测模块的执行脚本,代码还是比较简单的,主要难点就是集中在几下的几个函数,这里详细分析一下。
2.1、letterbox函数
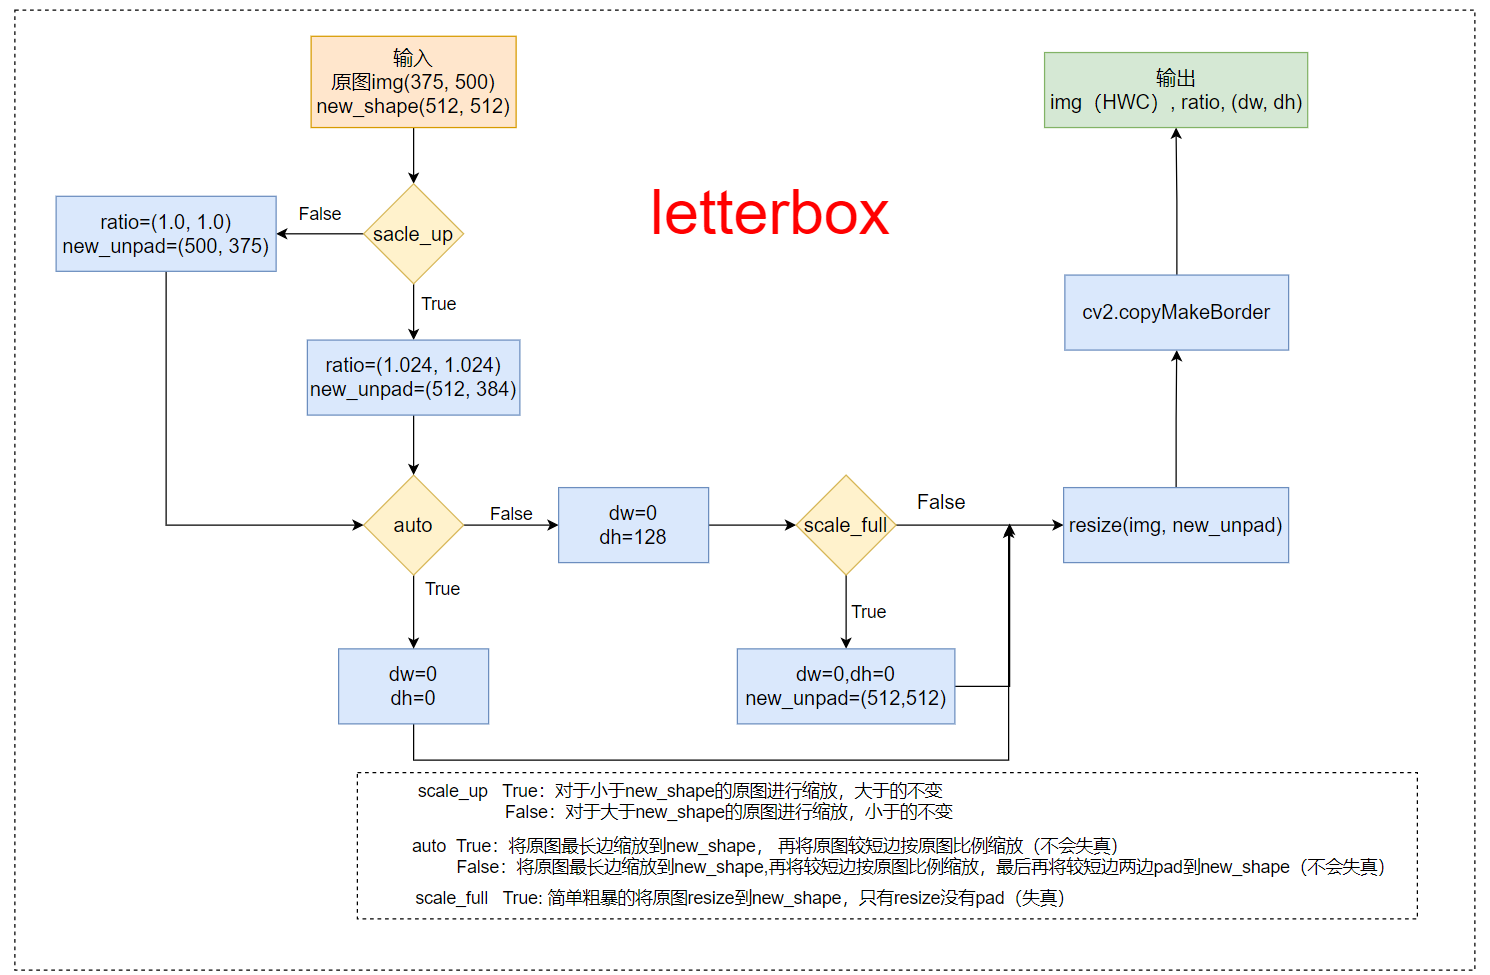
以下代码我作了详细的注解,如果还是看不懂,可以看下图的函数流程
1、函数流程

2、函数代码
datasets.py
import cv2
import matplotlib.pyplot as plt
plt.rcParams['font.sans-serif'] = ['SimHei']  # 显示中文标签
plt.rcParams['axes.unicode_minus'] = False    # 这两行需要手动设置

def letterbox(img: np.ndarray, new_shape=(416, 416), color=(114, 114, 114),
              auto=True, scale_fill=False, scale_up=True):
    """
    将图片缩放调整到指定大小
    :param img: 原图 hwc=(375,500,3)
    :param new_shape: 缩放后的最长边大小
    :param color: pad的颜色
    :param auto: True 保证缩放后的图片保持原图的比例 即 将原图最长边缩放到指定大小,再将原图较短边按原图比例缩放(不会失真)
                 False 将原图最长边缩放到指定大小,再将原图较短边按原图比例缩放,最后将较短边两边pad操作缩放到最长边大小(不会失真)
    :param scale_fill: True 简单粗暴的将原图resize到指定的大小 相当于就是resize 没有pad操作(失真)
    :param scale_up: True  对于小于new_shape的原图进行缩放,大于的不变
                     False 对于大于new_shape的原图进行缩放,小于的不变
    :return: img: letterbox后的图片 HWC
             ratio: wh ratios
             (dw, dh): w和h的pad
    """
    shape = img.shape[:2]  # 原图大小[h, w] = [375, 500]
    if isinstance(new_shape, int):
        new_shape = (new_shape, new_shape)  # (512, 512)

    # scale ratio (new / old)   1.024
    r = min(new_shape[0] / shape[0], new_shape[1] / shape[1])
    if not scale_up:  # (for better test mAP) scale_up = False 对于大于new_shape(r<1)的原图进行缩放,小于new_shape(r>1)的不变
        r = min(r, 1.0)

    # compute padding
    ratio = r, r  # width, height ratios  (1.024, 1.024)
    new_unpad = int(round(shape[1] * r)), int(round(shape[0] * r))  # wh(512, 384) 保证缩放后图像比例不变
    dw, dh = new_shape[1] - new_unpad[0], new_shape[0] - new_unpad[1]  # wh padding dw=0 dh=128
    if auto:  # minimun rectangle 保证原图比例不变,将图像最大边缩放到指定大小
        # 这里的取余操作可以保证padding后的图片是32的整数倍(416x416),如果是(512x512)可以保证是64的整数倍
        dw, dh = np.mod(dw, 64), np.mod(dh, 64)  # wh padding dw=0 dh=0
    elif scale_fill:  # stretch 简单粗暴的将图片缩放到指定尺寸
        dw, dh = 0, 0
        new_unpad = new_shape
        ratio = new_shape[0] / shape[1], new_shape[1] / shape[0]  # wh ratios

    dw /= 2  # divide padding into 2 sides 将padding分到上下,左右两侧
    dh /= 2

    # shape:[h, w]  new_unpad:[w, h]
    if shape[::-1] != new_unpad:  # 将原图resize到new_unpad(长边相同,比例相同的新图)
        img = cv2.resize(img, new_unpad, interpolation=cv2.INTER_LINEAR)
    top, bottom = int(round(dh - 0.1)), int(round(dh + 0.1))  # 计算上下两侧的padding
    left, right = int(round(dw - 0.1)), int(round(dw + 0.1))  # 计算左右两侧的padding

    img = cv2.copyMakeBorder(img, top, bottom, left, right, cv2.BORDER_CONSTANT, value=color)  # add border/pad
    return img, ratio, (dw, dh)

# 下面代码是做个测试,可以删除
if __name__ == '__main__':
    img_o = cv2.imread("../imgs/2008_000011.jpg")  # BGR HWC
    img_o = img_o[:, :, ::-1]  # BGR => RGB
    print("1、原图:", img_o.shape)

    letter_pad_img = letterbox(img_o, new_shape=512, auto=False, color=(255, 255, 255))[0]
    print("2、letter_pad_img(不失真)auto=False, scale_fill=False, scale_up=True:", letter_pad_img.shape)

    letter_img = letterbox(img_o, new_shape=512, auto=True, color=(255, 255, 255))[0]
    print("3、letter_img(不失真)auto=True, scale_fill=False, scale_up=True:", letter_img.shape)

    resize_img = letterbox(img_o, new_shape=512, auto=False, scale_fill=True, color=(0, 0, 0))[0]
    print("4、resize_img(失真)auto=False, scale_fill=True, scale_up=True:", resize_img.shape)


    plt.figure(figsize=(20, 10))
    plt.subplot(1, 4, 1)
    plt.imshow(img_o)
    plt.title('原图: (375, 500, 3)', fontsize=15)

    plt.subplot(1, 4, 2)
    plt.imshow(letter_pad_img)
    plt.title('letter_pad_img(不失真): (512, 512, 3)', fontsize=15)

    plt.subplot(1, 4, 3)
    plt.imshow(letter_img)
    plt.title('letter_img(不失真): (384, 512, 3)', fontsize=15)

    plt.subplot(1, 4, 4)
    plt.imshow(resize_img)
    plt.title('暴力resize_img(失真): (512, 512, 3)', fontsize=15)
    plt.show()
3、执行效果


在推理阶段我们一般用第三种方式就可以了;而在训练阶段要使用letterbox的话一般是使用第二种方式(一般训练的时候输入的是一张正方形的图片)。
2.2、non_max_suppression函数
关于nms的算法步骤和原理部分不懂的朋友可以看我的另一篇博文: 常见的非极大值抑制方法:(Hard) NMS、Soft NMS、DIoU NMS.里面很详细的介绍了各种的nms算法原理及其区别。
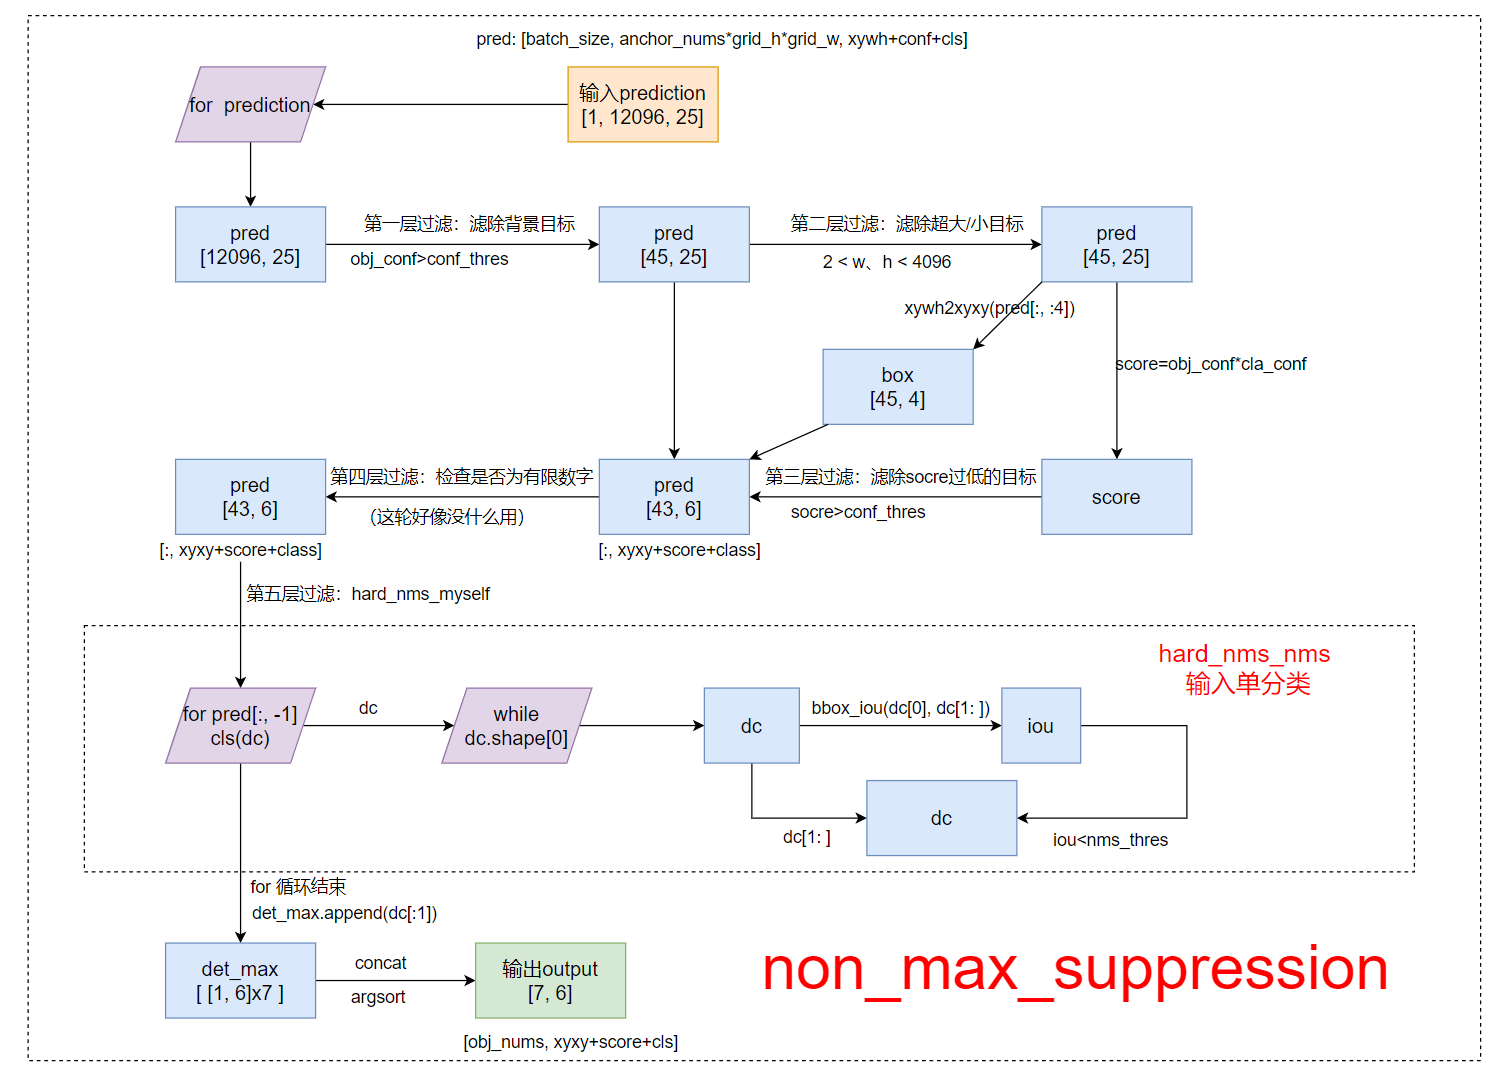
1、函数流程
以 hard_nms_myself (自己实现的单输出hard_nms)为例:

2、函数代码
以下代码我作了详细的注解,如果还是看不懂,可以看上面的函数流程
def non_max_suppression(prediction, conf_thres=0.1,
                        nms_thres=0.6, multi_cls=True, method='hard_nms_myself'):
    """
        Removes detections with lower object confidence score than 'conf_thres'
        Non-Maximum Suppression to further filter detections.
        param:
             prediction: [batch, num_anchors(3个yolo预测层), (x+y+w+h+1+num_classes)]  3个anchor的预测结果总和
             conf_thres: 先进行一轮筛选,将分数过低的预测框(<conf_thres)删除(分数置0)
             nms_thres: iou阈值, 如果其余预测框与target的iou>iou_thres, 就将那个预测框置0
             multi_label: 是否是多标签
             method: nms方法  (https://github.com/ultralytics/yolov3/issues/679)
                              (https://github.com/ultralytics/yolov3/pull/795)
                        -hard_nms: 普通的 (hard) nms 官方实现(c函数库),可支持gpu,只支持单类别输入
                        -hard_nms_batch: 普通的 (hard) nms 官方实现(c函数库),可支持gpu,支持多类别输入
                        -hard_nms_myself: 普通的 (hard) nms 自己实现的,只支持单类别输入
                        -and: 在hard-nms的逻辑基础上,增加是否为单独框的限制,删除没有重叠框的框(减少误检)。
                        -merge: 在hard-nms的基础上,增加保留框位置平滑策略(重叠框位置信息求解平均值),使框的位置更加精确。
                        -soft_nms: soft nms 用一个衰减函数作用在score上来代替原来的置0
                        -diou_nms: 普通的 (hard) nms 的基础上引入DIoU(普通的nms用的是iou)
        Returns detections with shape:
            (x1, y1, x2, y2, object_conf, class)
    """
    # Box constraints
    min_wh, max_wh = 2, 4096  # (pixels) 宽度和高度的大小范围 [min_wh, max_wh]
    output = [None] * len(prediction)  # batch_size个output  存放最终筛选后的预测框结果
    for image_i, pred in enumerate(prediction):
        # 开始  pred = [12096, 25]
        # 第一层过滤   根据conf_thres虑除背景目标(obj_conf<conf_thres 0.1的目标 置信度极低的目标)
        pred = pred[pred[:, 4] > conf_thres]  # pred = [45, 25]

        # 第二层过滤   虑除超小anchor标和超大anchor  x=[45, 25]
        pred = pred[(pred[:, 2:4] > min_wh).all(1) & (pred[:, 2:4] < max_wh).all(1)]

        # 经过前两层过滤后如果该feature map没有目标框了,就结束这轮直接进行下一张图
        if len(pred) == 0:
            continue

        # 计算 score
        pred[..., 5:] *= pred[..., 4:5]  # score = cls_conf * obj_conf

        # Box (center x, center y, width, height) to (x1, y1, x2, y2)
        box = xywh2xyxy(pred[:, :4])

        # Detections matrix nx6 (xyxy, conf, cls)
        if multi_cls or conf_thres < 0.01:
            # 第三轮过滤:针对每个类别score(obj_conf * cls_conf) > conf_thres [43, 6]
            # 这里一个框是有可能有多个物体的,所以要筛选
            # nonzero: 获得矩阵中的非0(True)数据的下标  a.t(): 将a矩阵拆开
            # i: 下标 [43]   j: 类别index [43] 过滤了两个score太低的
            i, j = (pred[:, 5:] > conf_thres).nonzero(as_tuple=False).t()
            # pred = [43, xyxy+score+class] [43, 6]
            # unsqueeze(1): [43] => [43, 1] add batch dimension
            # box[i]: [43,4] xyxy
            # pred[i, j + 5].unsqueeze(1): [43,1] score  对每个i,取第(j+5)个位置的值(第j个class的值cla_conf)
            # j.float().unsqueeze(1): [43,1] class
            pred = torch.cat((box[i], pred[i, j + 5].unsqueeze(1), j.float().unsqueeze(1)), 1)
        else:  # best class only
            conf, j = pred[:, 5:].max(1)  # 一个类别直接取分数最大类的即可
            pred = torch.cat((box, conf.unsqueeze(1), j.float().unsqueeze(1)), 1)[conf > conf_thres]

        # 第三轮过滤后如果该feature map没有目标框了,就结束这轮直接进行下一个feature map
        if len(pred) == 0:
            continue
        # 第四轮过滤  这轮可有可无,一般没什么用 [43, 6] 检测数据是否为有限数
        pred = pred[torch.isfinite(pred).all(1)]

        # 降序排列 为NMS做准备  [43, 6]
        pred = pred[pred[:, 4].argsort(descending=True)]

        # Batched NMS
        # Batched NMS推理时间:0.054
        if method == 'hard_nms_batch':  # 普通的(hard)nms: 官方实现(c函数库),可支持gpu,但支持多类别输入
            # batched_nms:参数1 [43, xyxy]  参数2 [43, score]  参数3 [43, class]  参数4 [43, nms_thres]
            output[image_i] = pred[torchvision.ops.boxes.batched_nms(pred[:, :4], pred[:, 4], pred[:, 5], nms_thres)]
            # print("hard_nms_batch")
            continue

        # All other NMS methods  都是单类别输入
        det_max = []  # 存放分数最高的框 即target
        cls = pred[:, -1]
        for c in cls.unique():  # 对所有的种类(不重复)
            dc = pred[cls == c]  # dc: 选出pred中所有类别是c的结果
            n = len(dc)  # 有多少个类别是c的预测框
            if n == 1:
                # No NMS required if only 1 prediction
                det_max.append(dc)
                continue
            elif n > 500:
                # limit to first 500 boxes: https://github.com/ultralytics/yolov3/issues/117
                # 密集性 主要考虑到NMS是一个速度慢的算法(O(n^2)),预测框太多,算法的效率太慢 所以这里筛选一下(最多500个预测框)
                dc = dc[:500]
            # 推理时间:0.001
            if method == 'hard_nms':  # 普通的(hard)nms: 只支持单类别输入
                det_max.append(dc[torchvision.ops.boxes.nms(dc[:, :4], dc[:, 4], nms_thres)])

            # 推理时间:0.00299 是官方写的3倍
            elif method == 'hard_nms_myself':  # Hard NMS 自己写的 只支持单类别输入
                while dc.shape[0]:  # dc.shape[0]: 当前class的预测框数量
                    det_max.append(dc[:1])  # 让score最大的一个预测框(排序后的第一个)为target
                    if len(dc) == 1:  # 出口 dc中只剩下一个框时,break
                        break
                    # dc[0] :target     dc[1:] :其他预测框
                    iou = bbox_iou(dc[0], dc[1:])  # 计算 普通iou
                    dc = dc[1:][iou < nms_thres]  # remove target and iou > threshold

            # 在hard-nms的逻辑基础上,增加是否为单独框的限制,删除没有重叠框的框(减少误检)。
            elif method == 'and':  # requires overlap, single boxes erased
                while len(dc) > 1:
                    iou = bbox_iou(dc[0], dc[1:])  # iou with other boxes
                    if iou.max() > 0.5:  # 删除没有重叠框的框/iou小于0.5的框(减少误检)
                        det_max.append(dc[:1])
                    dc = dc[1:][iou < nms_thres]  # remove ious > threshold

            # 在hard-nms的基础上,增加保留框位置平滑策略(重叠框位置信息求解平均值),使框的位置更加精确。
            elif method == 'merge':  # weighted mixture box
                while len(dc):
                    if len(dc) == 1:
                        det_max.append(dc)
                        break
                    i = bbox_iou(dc[0], dc) > nms_thres  # i = True/False的集合
                    weights = dc[i, 4:5]     # 根据i,保留所有True
                    dc[0, :4] = (weights * dc[i, :4]).sum(0) / weights.sum()  # 重叠框位置信息求解平均值
                    det_max.append(dc[:1])
                    dc = dc[i == 0]

            # 推理时间:0.0030s
            elif method == 'soft_nms':  # soft-NMS      https://arxiv.org/abs/1704.04503
                sigma = 0.5  # soft-nms sigma parameter
                while len(dc):
                    # if len(dc) == 1:  这是U版的源码 我做了个小改动
                    #     det_max.append(dc)
                    #     break
                    # det_max.append(dc[:1])
                    det_max.append(dc[:1])   # append dc的第一行  即target
                    if len(dc) == 1:
                        break
                    iou = bbox_iou(dc[0], dc[1:])  # 计算target与其他框的iou

                    # 这里和上面的直接置0不同,置0不需要管维度
                    dc = dc[1:]  # dc=target往后的所有预测框
                    # dc必须不包括target及其前的预测框,因为还要和值相乘, 维度上必须相同
                    dc[:, 4] *= torch.exp(-iou ** 2 / sigma)  # 得分衰减
                    dc = dc[dc[:, 4] > conf_thres]

            # 推理时间:0.00299
            elif method == 'diou_nms':  # DIoU NMS  https://arxiv.org/pdf/1911.08287.pdf
                while dc.shape[0]:  # dc.shape[0]: 当前class的预测框数量
                    det_max.append(dc[:1])  # 让score最大的一个预测框(排序后的第一个)为target
                    if len(dc) == 1:  # 出口 dc中只剩下一个框时,break
                        break
                    # dc[0] :target     dc[1:] :其他预测框
                    diou = bbox_iou(dc[0], dc[1:], DIoU=True)  # 计算 diou
                    dc = dc[1:][diou < nms_thres]  # remove dious > threshold  保留True 删去False

        if len(det_max):
            det_max = torch.cat(det_max)  # concatenate  因为之前是append进det_max的
            output[image_i] = det_max[(-det_max[:, 4]).argsort()]  # 排序

    # output tensor [7, 6]
    return output
2.3、scale_coords函数
这个部分的代码比较简单,这里我就不画流程图了,自己看代码理解。
核心思想:将预测的坐标信息coords(相对img1_shape)转换回相对原图尺度(img0_shape)
def scale_coords(img1_shape, coords, img0_shape, ratio_pad=None):
    """
    将预测的坐标信息coords(相对img1_shape)转换回相对原图尺度(img0_shape)
    :param img1_shape: 缩放后的图像大小  [H, W]=[384, 512]
    :param coords: 预测的box信息 [7,4]  [anchor_nums, x1y1x2y2] 这个预测信息是相对缩放后的图像尺寸(img1_shape)的
    :param img0_shape: 原图的大小  [H, W, C]=[375, 500, 3]
    :param ratio_pad: 缩放过程中的缩放比例以及pad  一般不传入
    :return: coords: 相对原图尺寸(img0_shape)的预测信息
    """
    # Rescale coords (xyxy) from img1_shape to img0_shape
    if ratio_pad is None:  # calculate from img0_shape
        # gain = old/new = 1.024  max(img1_shape): 求img1的较长边  这一步对应的是之前的letterbox步骤
        gain = max(img1_shape) / max(img0_shape)
        # wh padding 这一步起不起作用,完全取决于letterbox的方式
        # 当letterbox为letter_pad_img时,pad=(0.0, 64.0); 当letterbox为leeter_img时,pad=(0.0, 0.0)
        pad = (img1_shape[1] - img0_shape[1] * gain) / 2, (img1_shape[0] - img0_shape[0] * gain) / 2
    else:
        gain = ratio_pad[0][0]
        pad = ratio_pad[1]

    # 将相对img1的预测信息缩放得到相对原图img0的预测信息
    coords[:, [0, 2]] -= pad[0]  # x padding
    coords[:, [1, 3]] -= pad[1]  # y padding
    coords[:, :4] /= gain        # 缩放
    # 缩放到原图的预测结果,并对预测值进行了一定的约束,防止预测结果超出图像的尺寸
    clip_coords(coords, img0_shape)
    return coords

def clip_coords(boxes, img_shape):
    """
    Clip bounding xyxy bounding boxes to image shape (height, width)
    c.clamp_(a, b): 将矩阵c中所有的元素约束在[a, b]中间
                    如果某个元素小于a,就将这个元素变为a;如果元素大于b,就将这个元素变为b
    这里将预测得到的xyxy做个约束,是因为当物体处于图片边缘的时候,预测值是有可能超过图片大小的
    :param boxes: 函数开始=>缩放到原图的预测结果[7, 4]
                  函数结束=>缩放到原图的预测结果,并对预测值进行了一定的约束,防止预测结果超出图像的尺寸
    :param img_shape: 原图的shape [H, W, C]=[375, 500, 3]
    """
    boxes[:, 0].clamp_(0, img_shape[1])  # x1
    boxes[:, 1].clamp_(0, img_shape[0])  # y1
    boxes[:, 2].clamp_(0, img_shape[1])  # x2
    boxes[:, 3].clamp_(0, img_shape[0])  # y2
2.4、draw_box函数
最后一步:将所有最终预测框画出来
import collections
from PIL import Image
import PIL.ImageDraw as ImageDraw
import PIL.ImageFont as ImageFont
import numpy as np

STANDARD_COLORS = [
    'AliceBlue', 'Chartreuse', 'Aqua', 'Aquamarine', 'Azure', 'Beige', 'Bisque',
    'BlanchedAlmond', 'BlueViolet', 'BurlyWood', 'CadetBlue', 'AntiqueWhite',
    'Chocolate', 'Coral', 'CornflowerBlue', 'Cornsilk', 'Crimson', 'Cyan',
    'DarkCyan', 'DarkGoldenRod', 'DarkGrey', 'DarkKhaki', 'DarkOrange',
    'DarkOrchid', 'DarkSalmon', 'DarkSeaGreen', 'DarkTurquoise', 'DarkViolet',
    'DeepPink', 'DeepSkyBlue', 'DodgerBlue', 'FireBrick', 'FloralWhite',
    'ForestGreen', 'Fuchsia', 'Gainsboro', 'GhostWhite', 'Gold', 'GoldenRod',
    'Salmon', 'Tan', 'HoneyDew', 'HotPink', 'IndianRed', 'Ivory', 'Khaki',
    'Lavender', 'LavenderBlush', 'LawnGreen', 'LemonChiffon', 'LightBlue',
    'LightCoral', 'LightCyan', 'LightGoldenRodYellow', 'LightGray', 'LightGrey',
    'LightGreen', 'LightPink', 'LightSalmon', 'LightSeaGreen', 'LightSkyBlue',
    'LightSlateGray', 'LightSlateGrey', 'LightSteelBlue', 'LightYellow', 'Lime',
    'LimeGreen', 'Linen', 'Magenta', 'MediumAquaMarine', 'MediumOrchid',
    'MediumPurple', 'MediumSeaGreen', 'MediumSlateBlue', 'MediumSpringGreen',
    'MediumTurquoise', 'MediumVioletRed', 'MintCream', 'MistyRose', 'Moccasin',
    'NavajoWhite', 'OldLace', 'Olive', 'OliveDrab', 'Orange', 'OrangeRed',
    'Orchid', 'PaleGoldenRod', 'PaleGreen', 'PaleTurquoise', 'PaleVioletRed',
    'PapayaWhip', 'PeachPuff', 'Peru', 'Pink', 'Plum', 'PowderBlue', 'Purple',
    'Red', 'RosyBrown', 'RoyalBlue', 'SaddleBrown', 'Green', 'SandyBrown',
    'SeaGreen', 'SeaShell', 'Sienna', 'Silver', 'SkyBlue', 'SlateBlue',
    'SlateGray', 'SlateGrey', 'Snow', 'SpringGreen', 'SteelBlue', 'GreenYellow',
    'Teal', 'Thistle', 'Tomato', 'Turquoise', 'Violet', 'Wheat', 'White',
    'WhiteSmoke', 'Yellow', 'YellowGreen'
]


def filter_low_thresh(boxes, scores, classes, category_index, thresh,
                      box_to_display_str_map, box_to_color_map):
    """
    1、过滤掉scores低于thresh的anchor;
    2、为每个anchor生成显示信息和框框颜色并分别保存在box_to_display_str_map和box_to_color_map中
    :param boxes: 最终预测结果 (anchor_nums, x1+y1+x2+y2)=(7, 4) (相对原图的预测结果) 分类别且按score从大到小排列
    :param scores: 所有预测anchors的得分 (7) 分类别且按score从大到小排列
    :param classes: 所有预测anchors的类别 (7) 分类别且按score从大到小排列
    :param category_index: 所有类别的信息(从data/pascal_voc_classes.json中读出)
    :param thresh: 设置阈值(默认0.1),过滤掉score太低的anchor
    :param box_to_display_str_map: 拿来存放每个anchor的显示信息(list) 每个anchor: tuple(box) = list[显示信息]
    :param box_to_color_map: 拿来存放每个anchor的框框颜色
    """
    for i in range(boxes.shape[0]):  # for anchors
        # 过滤掉score太低的anchor
        if scores[i] > thresh:
            box = tuple(boxes[i].tolist())  # numpy -> list -> tuple
            if classes[i] in category_index.keys():
                class_name = category_index[classes[i]]  # 得到每个anchor的class名
            else:
                class_name = 'N/A'
            display_str = str(class_name)
            display_str = '{}: {}%'.format(display_str, int(100 * scores[i]))  # 显示信息如 car: 90%
            # 将当前anchor的显示信息display_str加入到box_to_display_str_map中 每个anchor: tuple(box) = list[显示信息]
            box_to_display_str_map[box].append(display_str)
            # 为每个anchor对应的目标类别选择一个框框颜色 每个anchor: tuple(box) = list[颜色信息]
            box_to_color_map[box] = STANDARD_COLORS[classes[i] % len(STANDARD_COLORS)]
        else:
            break  # 网络输出概率已经排序过,当遇到一个不满足后面的肯定不满足


def draw_text(draw, box_to_display_str_map, box, left, right, top, bottom, color):
    """
    :param draw: 一个可以在给定图像(image)上绘图的对象
    :param box_to_display_str_map: 每个anchor的显示信息
    :param box: 当前anchor的预测信息 (xyxy)
    :param left: anchor的left
    :param right: anchor的right
    :param top: anchor的top
    :param bottom: anchor的bottom
    :param color: 当前anchor的信息颜色/anchor框框颜色
    :return:
    """
    try:
        # 从指定的文件('arial.ttf')中加载了一个字体对象,并且为指定大小(20)的字体创建了字体对象。
        font = ImageFont.truetype('arial.ttf', 20)
    except IOError:
        font = ImageFont.load_default()  # 加载一个默认的字体

    # 扫描ds(当前anchor的显示信息box_to_display_str_map[box])自动找到当前anchor显示信息的最大的字体大小(高)
    display_str_heights = [font.getsize(ds)[1] for ds in box_to_display_str_map[box]]
    # Each display_str has a top and bottom margin of 0.05x.
    total_display_str_height = (1 + 2 * 0.05) * sum(display_str_heights)

    # 如果添加到边界框顶部的显示字符串的总高度不超过图像顶部,就将字符串堆叠在边界框上方
    # text_bottom: 盛装显示字符的矩形框的top
    if top > total_display_str_height:
        text_bottom = top
    else:
        # 如果添加到边界框顶部的显示字符串的总高度超过图像顶部,就将字符串堆叠在边界框下方
        text_bottom = bottom + total_display_str_height
    # Reverse list and print from bottom to top.
    for display_str in box_to_display_str_map[box][::-1]:
        # 得到当前anchor的显示字符的最佳w和h
        text_width, text_height = font.getsize(display_str)
        # 得到当前anchor的显示字符的margin
        margin = np.ceil(0.05 * text_height)
        # 画盛装显示字符的矩形 传入左下角坐标+右上角坐标
        draw.rectangle([(left, text_bottom - text_height - 2 * margin),
                        (left + text_width, text_bottom)], fill=color)
        # 写入显示字符 传入显示字符的左上角坐标
        draw.text((left + margin, text_bottom - text_height - margin),
                  display_str,  # 显示字符
                  fill='red',   # 字体颜色
                  font=font)    # 加载字体
        text_bottom -= text_height - 2 * margin  # ?


def draw_box(image, boxes, classes, scores, category_index, thresh=0.1, line_thickness=3):
    """
    :param image: 原图 RGB (375, 500, 3) HWC  numpy格式(array)    img_o[:, :, ::-1]:BGR=>RGB
    :param boxes: 最终预测结果 (anchor_nums, x1+y1+x2+y2)=(7, 4) (相对原图的预测结果)
                  按score从大到小排列  numpy格式(array)
    :param classes: 所有预测anchors的类别 (7) 分类别且按score从大到小排列 numpy格式(array)
    :param scores: 所有预测anchors的得分 (7) 分类别且按score从大到小排列  numpy格式(array)
    :param category_index: 所有类别的信息(从data/pascal_voc_classes.json中读出)
    :param thresh: 设置阈值(默认0.1),过滤掉score太低的anchor
    :param line_thickness: 框框直线厚度
    :return:
    """
    box_to_display_str_map = collections.defaultdict(list)  # 拿来存放每个anchor的显示信息
    box_to_color_map = collections.defaultdict(str)  # 拿来存放每个anchor的框框颜色

    # 1、过滤掉scores低于thresh的anchor
    # 2、为每个anchor生成显示信息和框框颜色并分别保存在box_to_display_str_map和box_to_color_map中
    filter_low_thresh(boxes, scores, classes, category_index, thresh, box_to_display_str_map, box_to_color_map)

    # Draw all boxes onto image.
    if isinstance(image, np.ndarray):
        image = Image.fromarray(image)  # array(numpy) 转为Image格式
    draw = ImageDraw.Draw(image)  # 创建一个可以在给定图像(image)上绘图的对象
    for box, color in box_to_color_map.items():
        xmin, ymin, xmax, ymax = box
        (left, right, top, bottom) = (xmin * 1, xmax * 1, ymin * 1, ymax * 1)
        # 为每个anchor画框 顺序:左上->左下->右下->右上->左上
        draw.line([(left, top), (left, bottom), (right, bottom),
                   (right, top), (left, top)], width=line_thickness, fill=color)
        # 在每个框框上写上显示信息
        draw_text(draw, box_to_display_str_map,  box, left, right, top, bottom, color)
    return image
Reference
b站大佬1 霹雳吧啦Wz: YOLOv3 SPP源码解析(Pytorch版)
b站大佬2 比飞鸟贵重的多_HKL: 基于深度学习的目标检测算法
最后
以上就是轻松方盒最近收集整理的关于【YOLO-V3-SPP 源码解读】五、预测模块一、predict.py二、几个重要函数Reference的全部内容,更多相关【YOLO-V3-SPP内容请搜索靠谱客的其他文章。


发表评论 取消回复