python数据分析入门【一】 — DataFrame & Series
下一章内容python数据分析入门【二】 — 数据处理
文章目录
- python数据分析入门【一】 --- DataFrame & Series
- 一、数据准备
- 1、数据结构
- 1.1 Series系列
- 1)创建系列,并修改index
- 2)根据索引访问系列
- 3)系列追加元素
- 4)成员检测
- 5)系列切片
- 6)系列元素重排
- 7)删除元素
- 1.2 DataFrame数据框
- 1)定义DataFrame,并修改index
- 2)按列名,行索引,行与列访问
- 3)修改列名,行索引
- 4)按行索引,列名删除
- 5)增加行,列
- 6) Dataframe中MultiIndex的操作
- 7)Dataframe中CategoricalIndex的操作
- 1.3 备注
- 2、向量化计算
- 2.1 生成等差数列
- 2.2 四则运算
- 2.3 函数计算
- 1)基本数学运算
- 2)获得行列最大最小值
- 2.4 比较计算(结合过滤使用)
- 1)一维数组比较大小
- 2)DataFrame比较大小
- 2.5 矩阵计算
一、数据准备
1、数据结构
1.1 Series系列
系列用于存储一行或者一列的数据,以及与之相关的索引集合
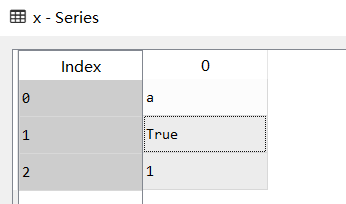
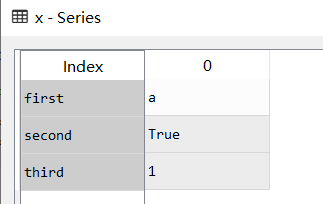
1)创建系列,并修改index
from pandas import Series
x = Series(['a',True,1])
x = Series(['a',True,1],index=['first','second','third'])
2)根据索引访问系列
x[1]
---
Out[4]: True

x['second']
---
Out[3]: True
3)系列追加元素
append方法返回值是一个Series对象,而不是在原有的x上追加Series
#不能追加单个元素,会报TypeError: cannot concatenate object of type "<class 'str'>";
#only pd.Series, pd.DataFrame, and pd.Panel (deprecated) objs are valid 异常
x.append('2')

#追加单个系列,append返回值是一个Series对象,而不是在原有的x上追加Series
x = x.append(Series(['0',5]))
x
---
Out[6]:
first        a
second    True
third        1
0            0
1            5
4)成员检测
用Series的values属性,判断系列中是否存在该值
'0' in x
---
 Out[7]: False

'0' in x.values
---
 Out[8]: True
5)系列切片
x[1:3]
---
Out[9]:
second    True
third        1
dtype: object
6)系列元素重排
定位获取,这个方法常用与随机抽样
x[[0,2,1]]
---
Out[10]:
first        a
third        1
second    True
dtype: object
7)删除元素
Series的drop方法返回值是Series对象,不在原有的x上进行删除
-
根据index删除,主要有两种方法
# 方法1
x.drop(0)
---
Out[11]:
first        a
second    True
third        1
1            5
dtype: object

x.drop('first')
---
Out[12]:
second    True
third        1
0            0
1            5
dtype: object
# 方法2 x.index[3] --- Out[16]: 0 #根据第i个位置上的index进行删除 x.drop(x.index[3]) --- Out[13]: first a second True third 1 1 5 dtype: object -
根据值删除
这里用到了向量化计算,即该计算应用在系列中的所有元素上
# 根据值删除
'0' != x.values
---
Out[15]: array([ True,  True,  True, False,  True])

x['0' != x.values]
---
Out[14]:
first        a
second    True
third        1
1            5
dtype: object
1.2 DataFrame数据框
用于存储多行和多列的数据集合
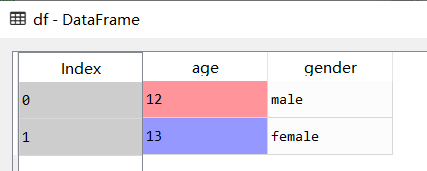
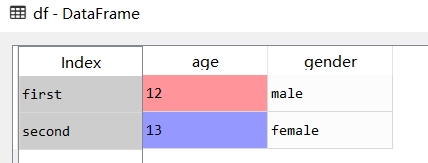
1)定义DataFrame,并修改index
from pandas import DataFrame

df = DataFrame({
    'age': [12, 13],
    'gender': ['male', 'female']
}
)

df = DataFrame({
    'age': [12, 13],
    'gender': ['male', 'female']
},
    index=['first', 'second']
)
2)按列名,行索引,行与列访问
-
按列名访问:单列/多列
- 注意区别两种单列访问形式:一种[],一种是[]里面套Series,输出效果看是否存在列名的Series
- 还可以使用
df.age来获取age列的值,但是这种获取是不含列名的的Series。
# 单列访问1 df['age'] --- Out[5]: first 12 second 13 # 单列访问2 df[['age']] --- Out[63]: age first 12 second 13 # 单列访问3 df.age --- Out[64]: first 12 second 13 # 多列访问 df[['age', 'gender']] --- Out[6]: age gender first 12 male second 13 female -
按行访问(参考时间抽取那一块)
# 按行访问 df[0:2] --- Out[7]: age gender first 12 male second 13 female # 按行索引访问(loc是属性,不是函数) df.loc[["first", "second"]] --- Out[8]: age gender first 12 male second 13 female # 按行索引范围访问(ix是属性) # ============================================================================= # Warning: Starting in 0.20.0, the .ix indexer is deprecated, # in favor of the more strict .iloc and .loc indexers. # ============================================================================= df = DataFrame({ 'age': [12, 13], 'gender': ['male', 'female'] }, index=['2', '6'] ) df.ix[0:1] --- age1 gender1 2 12 male df.ix[0:2] age gender 2 12 male 6 13 female -
按行列访问:
访问单个:at属性;访问多个:iloc属性
# 按行名,列号访问多个元素
df.iloc[0:2, 0:2]
---
Out[10]:
      age  gender
first    12    male
second   13  female

# D:按行名,列名访问单个元素
df.at['first', 'age']
---
Out[11]: 12

df.loc['first'].at['age']
---
Out[11]: 12
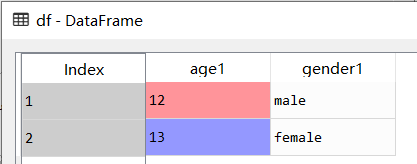
3)修改列名,行索引
修改属性,即在原有的df上修改列名,行索引
"""修改列名"""
df.columns=['age1','gender1']

'''修改行索引'''
df.index = range(1,3)
4)按行索引,列名删除
DataFrame的drop方法返回值是Series对象,不在原有的df上进行删除
'''G:根据行索引删除,axis=0则删除行,axis=1则删除列,默认axis=0'''
df.drop(1,axis=0)
---
Out[16]:
   age1 gender1
2    13  female

df.drop('age1',axis=1)
---
Out[17]:
  gender1
1    male
2  female
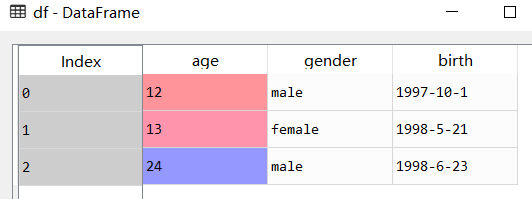
5)增加行,列
'''增加行/列(在原有的数据上加,访问/切片不对原始数据进行修改)'''
#增加行
#注意这种方法效率非常低,不应该用在遍历中
df.index = range(0,2)
df.loc[len(df)] = [24,'male']

#增加列
df["birth"] = ["1997-10-1","1998-5-21","1998-6-23"]
6) Dataframe中MultiIndex的操作
-
在交叉分析中,索引值(列/行)可能存在多重索引
MultiIndex -
如果采用以上的查询方法来访问表格元素,是不可行的,这里使用
pandas.DataFrame.xs方法来访问MultiIndex参考python/pandas dataframe中multiindex的操作
7)Dataframe中CategoricalIndex的操作
参考Pandas多层级索引
1.3 备注
判断是否在原有数据上修改数据,有个比较普遍的判断方式:
- 属性修改即在原有的数据上修改
- 方法修改不在原有的数据上修改,需要重新赋值
2、向量化计算
向量化计算是一种特殊的并行计算的方式,他可以在同一时间执行多次操作,通常是对不同的数据执行同样的一个或一批指令,或者说把指令应用于一个数组/向量。
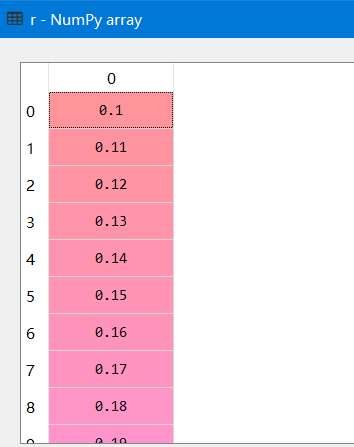
2.1 生成等差数列
import numpy as np

#生成等差数列
r = np.arange(0.1,0.5,0.01)
2.2 四则运算
r + r
---
Out[2]:
array([0.2 , 0.22, 0.24, 0.26, 0.28, 0.3 , 0.32, 0.34, 0.36, 0.38, 0.4 ,
       0.42, 0.44, 0.46, 0.48, 0.5 , 0.52, 0.54, 0.56, 0.58, 0.6 , 0.62,
       0.64, 0.66, 0.68, 0.7 , 0.72, 0.74, 0.76, 0.78, 0.8 , 0.82, 0.84,
       0.86, 0.88, 0.9 , 0.92, 0.94, 0.96, 0.98])

r * r
---
Out[3]:
array([0.01  , 0.0121, 0.0144, 0.0169, 0.0196, 0.0225, 0.0256, 0.0289,
       0.0324, 0.0361, 0.04  , 0.0441, 0.0484, 0.0529, 0.0576, 0.0625,
       0.0676, 0.0729, 0.0784, 0.0841, 0.09  , 0.0961, 0.1024, 0.1089,
       0.1156, 0.1225, 0.1296, 0.1369, 0.1444, 0.1521, 0.16  , 0.1681,
       0.1764, 0.1849, 0.1936, 0.2025, 0.2116, 0.2209, 0.2304, 0.2401])

r - r
---
Out[4]:
array([0., 0., 0., 0., 0., 0., 0., 0., 0., 0., 0., 0., 0., 0., 0., 0., 0.,
       0., 0., 0., 0., 0., 0., 0., 0., 0., 0., 0., 0., 0., 0., 0., 0., 0.,
       0., 0., 0., 0., 0., 0.])

r / r
---
Out[5]:
array([1., 1., 1., 1., 1., 1., 1., 1., 1., 1., 1., 1., 1., 1., 1., 1., 1.,
       1., 1., 1., 1., 1., 1., 1., 1., 1., 1., 1., 1., 1., 1., 1., 1., 1.,
       1., 1., 1., 1., 1., 1.])
2.3 函数计算
1)基本数学运算
'''指数运算'''
np.power(r,5)
---
Out[6]:
array([1.00000000e-05, 1.61051000e-05, 2.48832000e-05, 3.71293000e-05,
       5.37824000e-05, 7.59375000e-05, 1.04857600e-04, 1.41985700e-04,
       1.88956800e-04, 2.47609900e-04, 3.20000000e-04, 4.08410100e-04,
       5.15363200e-04, 6.43634300e-04, 7.96262400e-04, 9.76562500e-04,
       1.18813760e-03, 1.43489070e-03, 1.72103680e-03, 2.05111490e-03,
       2.43000000e-03, 2.86291510e-03, 3.35544320e-03, 3.91353930e-03,
       4.54354240e-03, 5.25218750e-03, 6.04661760e-03, 6.93439570e-03,
       7.92351680e-03, 9.02241990e-03, 1.02400000e-02, 1.15856201e-02,
       1.30691232e-02, 1.47008443e-02, 1.64916224e-02, 1.84528125e-02,
       2.05962976e-02, 2.29345007e-02, 2.54803968e-02, 2.82475249e-02])
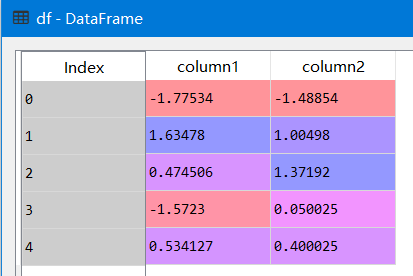
2)获得行列最大最小值
from pandas import DataFrame
df = DataFrame({
    "column1": np.random.randn(5),
    "column2": np.random.randn(5),
})
使用apply()获取最大最小值,行:axis = 1,列:axis = 0
'''获得行/列最小值'''
#列最小值,axis默认为0
df.apply(min)
---
Out[11]:
column1   -1.775344
column2   -1.488538
dtype: float64

#列最大值,axis默认为0
df.apply(max)
---
Out[12]:
column1    1.634778
column2    1.371921
dtype: float64

#行最小值
df.apply(min,axis=1)
Out[13]:
0   -1.775344
1    1.004980
2    0.474506
3   -1.572299
4    0.400025
dtype: float64
2.4 比较计算(结合过滤使用)
1)一维数组比较大小
r > 0.3
Out[7]:
array([False, False, False, False, False, False, False, False, False,
       False, False, False, False, False, False, False, False, False,
       False, False, False,  True,  True,  True,  True,  True,  True,
        True,  True,  True,  True,  True,  True,  True,  True,  True,
        True,  True,  True,  True])

#结合过滤一起使用
r[r > 0.3]
---
Out[8]:
array([0.31, 0.32, 0.33, 0.34, 0.35, 0.36, 0.37, 0.38, 0.39, 0.4 , 0.41,
       0.42, 0.43, 0.44, 0.45, 0.46, 0.47, 0.48, 0.49])
2)DataFrame比较大小
lambda表达式参考这里https://www.cnblogs.com/tianqianlan/p/11082183.html
#all()函数用于判断整个数组中的元素的值是否全部满足条件,如果满足条件返回True,否则返回False。本质上讲,all()实现了或(AND)运算
df.apply(lambda x : np.all(x > 0), axis = 1)
---
Out[14]:
0    False
1     True
2     True
3    False
4     True
dtype: bool

df[df.apply(lambda x : np.all(x > 0), axis = 1)]
---
Out[15]:
    column1   column2
1  1.634778  1.004980
2  0.474506  1.371921
4  0.534127  0.400025
2.5 矩阵计算
np.dot(r,r.T)
---
Out[9]: 4.013999999999998
1.4 备注:
注意向量化使用的原则:
- 代码中尽可能避免显式的for循环
- 过早优化是魔鬼
最后
以上就是大意红酒最近收集整理的关于python数据分析入门【一】 --- DataFrame & Series的全部内容,更多相关python数据分析入门【一】内容请搜索靠谱客的其他文章。


发表评论 取消回复