代码:
# -*- coding: utf-8 -*-
'''
参考链接:https://www.bilibili.com/video/av29987414/?spm_id_from=333.788.videocard.5
1. anchor 和 feature map 是什么关系?
答:
2. anchor 和原始图片是什么关系?
答:
'''
import numpy as np
import matplotlib.pyplot as plt
import matplotlib.patches as patches
import cv2
import pylab
# feature map
size_x = 4
size_y = 4
# 下采样
rpn_stride = 5 # input = 4*8 = 32×32
scales = [1, 2, 4] #[2, 4, 8] # 变长
ratios = [0.5, 1, 2]
def anchor_gen(size_x, size_y, rpn_stride, scales, ratios):
scales, ratios = np.meshgrid(scales, ratios) # 表示九种anchor,挨个的可能
scales, ratios = scales.flatten(), ratios.flatten() # 转换为行向量
# 求anchor的长和宽
# scales^2 = x *y; y = x*ratios; -> scales^2 = x * x * ratios
# scales^2 = x*y = y / ratios * y
scales_y = scales * np.sqrt(ratios) # 本来是面积的ratios , 现在是边路的
scales_x = scales / np.sqrt(ratios) # 1×9
# 原始图片上的anchor 的中心点坐标
shiftx = np.arange(0, size_x) * rpn_stride
shifty = np.arange(0, size_y) * rpn_stride
#input 组合网格坐标
shiftX, shiftY = np.meshgrid(shiftx, shifty)
# 组合anchor中心点和边长
centerX, anchorX = np.meshgrid(shiftX, scales_x)
centerY, anchorY = np.meshgrid(shiftY, scales_y)
# 把anchor的中心点的x和y坐标组合
anchor_center = np.stack([centerY,centerX], axis=2).reshape(-1, 2)
anchor_size = np.stack([anchorY,anchorX], axis=2).reshape(-1, 2)
boxes = np.concatenate([anchor_center - 0.5*anchor_size, anchor_center + 0.5*anchor_size ], axis=1)
return boxes
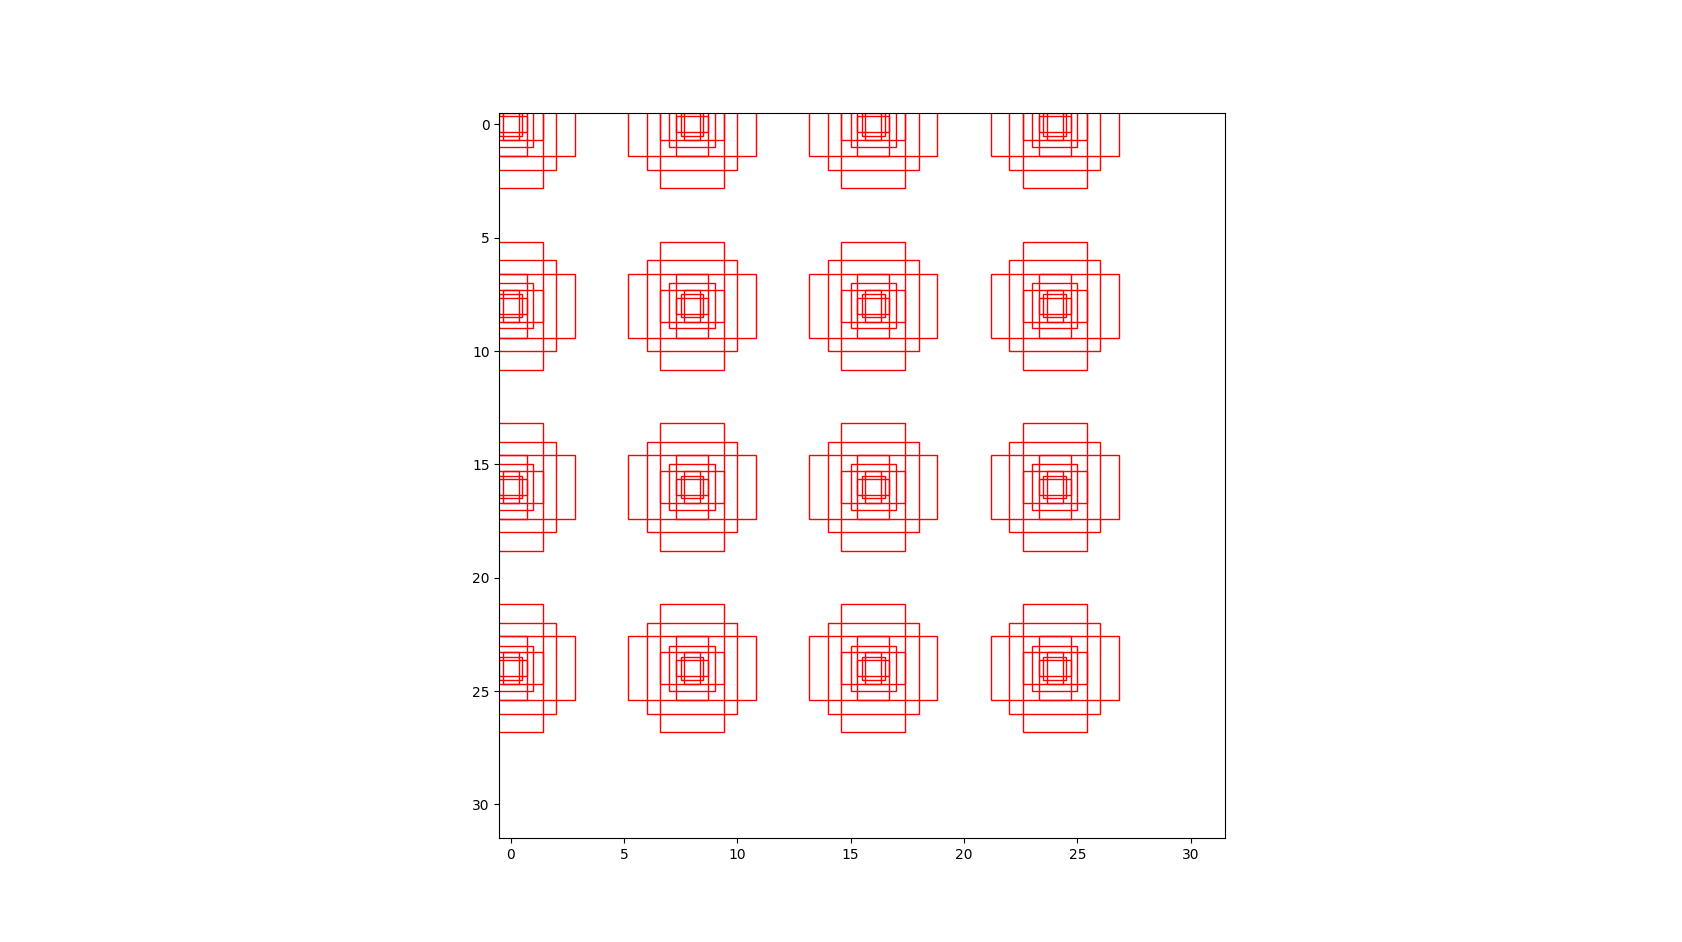
if __name__=='__main__':
anchors = anchor_gen(size_x,size_y,rpn_stride,scales,ratios)
plt.figure(figsize=(10,10)) # 图片显示大小
#img = cv2.imread("./person.jpg", 1)
img = np.ones((size_x*rpn_stride, size_x*rpn_stride, 3))
#plt.imshow(img)
# 打开接口
Axs = plt.gca()
for i in range(anchors.shape[0]):
box = anchors[i] # (x_min,y_min,x_max,y_max)
# Rectangle(x_min,y_min, width, height, angle=0.0, **kwargs)
rec = patches.Rectangle((box[0],box[1]),box[2]-box[0],box[3]-box[1],edgecolor="r",facecolor="none")
Axs.add_patch(rec)
plt.imshow(img)
pylab.show()
'''
np.meshgrid():输入两个坐标向量返回两个坐标矩阵
作用:表示anchor 的坐标
f_x = np.arange(size_x) # feature # *rpn_stride input
f_y = np.arange(size_y) # # *rpn_stride
F_x, F_y = np.meshgrid(f_x, f_y) # 用来表示特征图上每一点的坐标
print(f_x)
[0 1 2 3]
print(F_x)
[0 1 2 3]
[0 1 2 3]
[0 1 2 3]]
print(F_y)
[[0 0 0 0]
[1 1 1 1]
[2 2 2 2]
[3 3 3 3]]
'''
'''
import numpy as np
a = np.array([[1, 2, 3],[4, 5, 6]])
b = np.array([[7, 8, 9],[10, 11, 12]])
zzz = np.stack([a,b], axis=2)
print(a)
print(zzz)
'''
结果:
最后
以上就是伶俐白羊最近收集整理的关于第一课:fasterRCNN之RPN初探&anchors的产生的全部内容,更多相关第一课:fasterRCNN之RPN初探&anchors内容请搜索靠谱客的其他文章。
本图文内容来源于网友提供,作为学习参考使用,或来自网络收集整理,版权属于原作者所有。


发表评论 取消回复