为了大家能够复现各个图中的结果,我附上了所有我编写的MATLAB代码。
创作不易,未经允许,禁止转载。
另外,说明一下,用MATLAB做FFT并不要求数据点个数必须为以2为基数的整数次方。之所以很多资料上说控制数据点数为以2为基数的整数次方,是因为这样就能采用以2为基的FFT算法,提升运算性能。
如果数据点数不是以2为基数的整数次方,处理方法有两种,一种是在原始数据开头或末尾补零,即将数据补到以2为基数的整数次方,这是“补零”的一个用处;第二种是采用以任意数为基数的FFT算法。

快速傅里叶变换 FFT

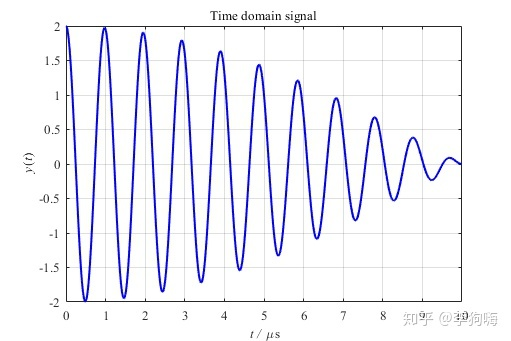
图1. 1000个数据点
如果,直接对这1000个数据点其做快速傅里叶变换,将得到频谱图:
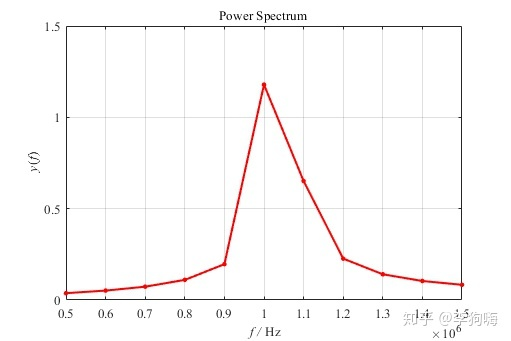
图2. 1000个数据点做FFT的频谱
可以发现,频谱点稀疏,在1MHz附近根本无法将1 MHz 和1.05 MHz 的两个频率分开。
clear;clc
close all
%% FFT
Fs = 100e6;		    % 采样频率 Hz
T = 1/Fs;		    % 采样周期 s
L0 = 1000;                  % 信号长度
L = 1000;                   % 数据长度
t0 = (0:L0-1)*T;            % 信号时间序列
x = cos(2*pi*1e6*t0) + cos(2*pi*1.05e6*t0); % 信号函数
t = (0:L-1)*T;              % 数据时间序列
%% Plot
figure(1)
plot(t*1e6,x,'b-','linewidth',1.5)
title ('fontsize{10}fontname{Times New Roman}Time domain signal')
xlabel('fontsize{10}fontname{Times New Roman}it t /rm mus')
ylabel('fontsize{10}fontname{Times New Roman}it yrm(ittrm)')
grid on;
axis([0 10 -2 2])
set(gca,'FontSize', 10 ,'FontName', 'Times New Roman')
set(gcf,'unit','centimeters','position',[15 10 13.53 9.03],'color','white')
%% FFT
Y = fft(x);                   % 快速傅里叶变换
% 计算双侧频谱 P2。然后基于 P2 和偶数信号长度 L 计算单侧频谱 P1。
P2 = abs(Y/L0);
P1 = P2(1:L/2+1);
P1(2:end-1) = 2*P1(2:end-1);
f = Fs*(0:(L/2))/L;% Rfft
figure(2)
plot(f, P1,'r-','Marker','.','markersize',10,'linewidth',1.5)
axis([0.5e6 1.5e6 0 1.5])
title('fontsize{10}fontname{Times New Roman}Power Spectrum')
xlabel('fontsize{10}fontname{Times New Roman}it f /rm Hz')
ylabel('fontsize{10}fontname{Times New Roman}it yrm(itfrm)')
grid on;
set(gca,'FontSize', 10 ,'FontName', 'Times New Roman')
set(gcf,'unit','centimeters','position',[15 10 13.53 9.03],'color','white')
频率分辨率
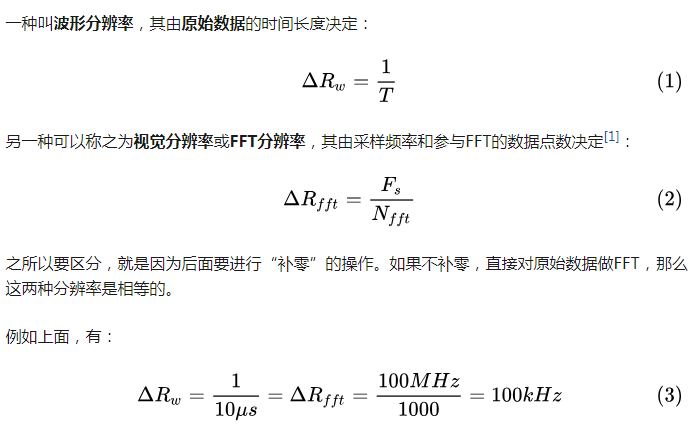
发现频率成分无法被区分开来,第一反应应该就是:频率分辨率不够。那么,如何提高频率分辨率呢?首先要清楚,这里存在两种类型的频率分辨率。
补零

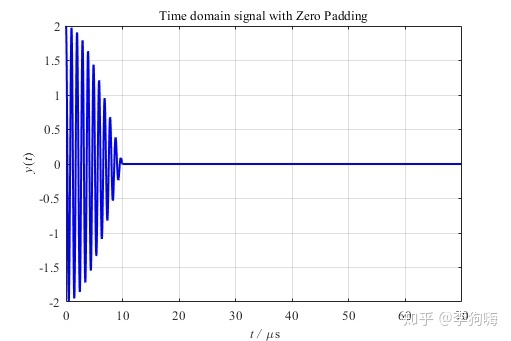
图3. 7000个补零后数据点
此时对其做快速傅里叶变换,结果如下:
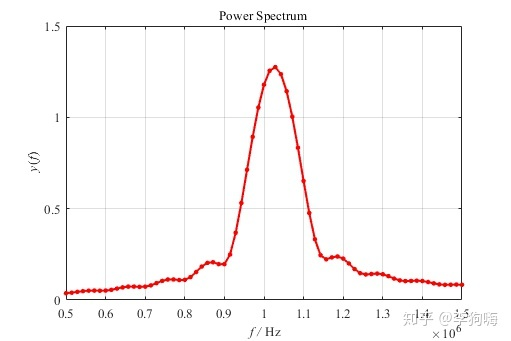
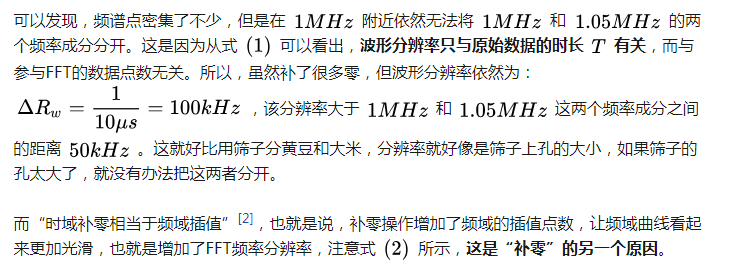
图4. 7000个补零后数据点做FFT的频谱
clear;clc
close all
%% FFT
Fs = 100e6;		    % 采样频率 Hz
T = 1/Fs;		    % 采样周期 s
L0 = 1000;                  % 信号长度
L = 7000;                   % 数据长度
t0 = (0:L0-1)*T;            % 信号时间序列
x = cos(2*pi*1e6*t0) + cos(2*pi*1.05e6*t0); % 信号函数
t = (0:L-1)*T;              % 数据时间序列
y = zeros(1,L);
y(1:L0) = x;
%% Plot
figure(1)
plot(t*1e6,y,'b-','linewidth',1.5)
title('fontsize{10}fontname{Times New Roman}Time domain signal with Zero Padding')
xlabel('fontsize{10}fontname{Times New Roman}it t /rm mus')
ylabel('fontsize{10}fontname{Times New Roman}it yrm(ittrm)')
grid on;
axis([0 70 -2 2])
set(gca,'FontSize', 10 ,'FontName', 'Times New Roman')
set(gcf,'unit','centimeters','position',[15 10 13.53 9.03],'color','white')
%% FFT
Y = fft(y);                   % 快速傅里叶变换
% 计算双侧频谱 P2。然后基于 P2 和偶数信号长度 L 计算单侧频谱 P1。
P2 = abs(Y/L0);
P1 = P2(1:L/2+1);
P1(2:end-1) = 2*P1(2:end-1);
f = Fs*(0:(L/2))/L;% Rfft
figure(2)
plot(f, P1,'r-','Marker','.','markersize',10,'linewidth',1.5)
axis([0.5e6 1.5e6 0 1.5])
title('fontsize{10}fontname{Times New Roman}Power Spectrum')
xlabel('fontsize{10}fontname{Times New Roman}it f /rm Hz')
ylabel('fontsize{10}fontname{Times New Roman}it yrm(itfrm)')
grid on;
set(gca,'FontSize', 10 ,'FontName', 'Times New Roman')
set(gcf,'unit','centimeters','position',[15 10 13.53 9.03],'color','white')
频谱泄漏

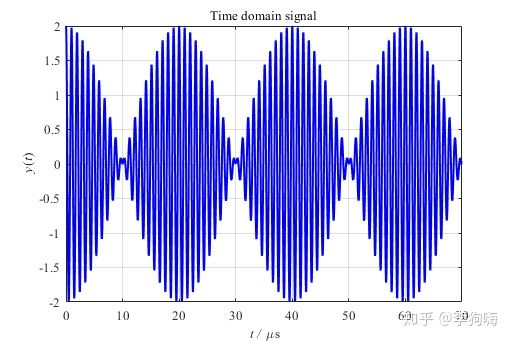
图5. 7000个数据点
对其做快速傅里叶变换,结果如下:
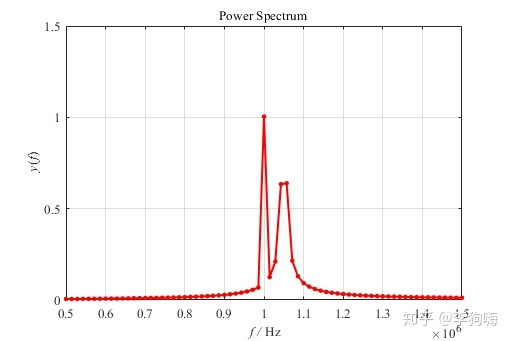
图6. 7000个数据点做FFT的频谱

clear;clc
close all
%% FFT
Fs = 100e6;		    % 采样频率 Hz
T = 1/Fs;		    % 采样周期 s
L0 = 7000;                  % 信号长度
L = 7000;                   % 数据长度
t0 = (0:L0-1)*T;            % 信号时间序列
x = cos(2*pi*1e6*t0) + cos(2*pi*1.05e6*t0); % 信号函数
t = (0:L-1)*T;              % 数据时间序列
%% Plot
figure(1)
plot(t*1e6,x,'b-','linewidth',1.5)
title('fontsize{10}fontname{Times New Roman}Time domain signal')
xlabel('fontsize{10}fontname{Times New Roman}it t /rm mus')
ylabel('fontsize{10}fontname{Times New Roman}it yrm(ittrm)')
grid on;
axis([0 70 -2 2])
set(gca,'FontSize', 10 ,'FontName', 'Times New Roman')
set(gcf,'unit','centimeters','position',[15 10 13.53 9.03],'color','white')
%% FFT
Y = fft(x);                   % 快速傅里叶变换
% 计算双侧频谱 P2。然后基于 P2 和偶数信号长度 L 计算单侧频谱 P1。
P2 = abs(Y/L0);
P1 = P2(1:L/2+1);
P1(2:end-1) = 2*P1(2:end-1);
f = Fs/2*linspace(0,1,L/2+1);% Rfft
figure(2)
plot(f, P1,'r-','Marker','.','markersize',10,'linewidth',1.5)
axis([0.5e6 1.5e6 0 1.5])
title('fontsize{10}fontname{Times New Roman}Power Spectrum')
xlabel('fontsize{10}fontname{Times New Roman}it f /rm Hz')
ylabel('fontsize{10}fontname{Times New Roman}it yrm(itfrm)')
grid on;
set(gca,'FontSize', 10 ,'FontName', 'Times New Roman')
set(gcf,'unit','centimeters','position',[15 10 13.53 9.03],'color','white')
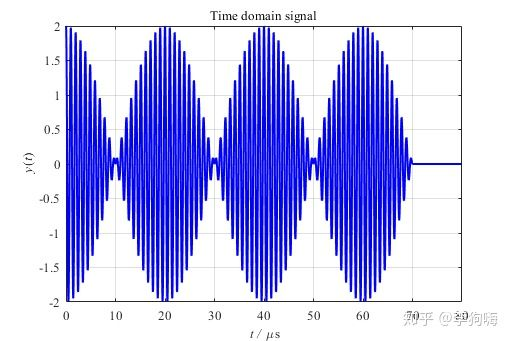
图7. 8000个补零后数据点

对其做快速傅里叶变换,结果如下:
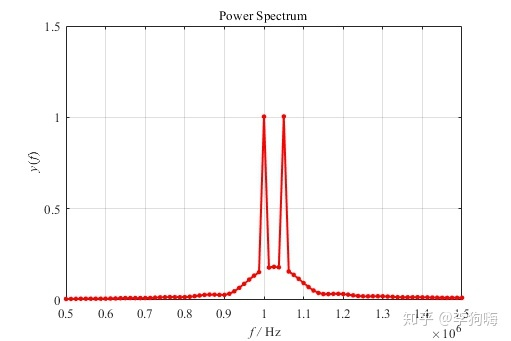
图8. 8000个补零后数据点做FFT的频谱

clear;clc
close all
%% FFT
Fs = 100e6;	            % 采样频率 Hz
T = 1/Fs;		    % 采样周期 s
L0 = 7000;                  % 信号长度
L = 8000;                   % 数据长度
t0 = (0:L0-1)*T;            % 信号时间序列
x = cos(2*pi*1e6*t0) + cos(2*pi*1.05e6*t0); % 信号函数
t = (0:L-1)*T;              % 数据时间序列
y = zeros(1,L);
y(1:L0) = x;
%% Plot
figure(1)
plot(t*1e6,y,'b-','linewidth',1.5)
title('fontsize{10}fontname{Times New Roman}Time domain signal')
xlabel('fontsize{10}fontname{Times New Roman}it t /rm mus')
ylabel('fontsize{10}fontname{Times New Roman}it yrm(ittrm)')
grid on;
axis([0 80 -2 2])
set(gca,'FontSize', 10 ,'FontName', 'Times New Roman')
set(gcf,'unit','centimeters','position',[15 10 13.53 9.03],'color','white')
%% FFT
Y = fft(y);                   % 快速傅里叶变换
% 计算双侧频谱 P2。然后基于 P2 和偶数信号长度 L 计算单侧频谱 P1。
P2 = abs(Y/L0);
P1 = P2(1:L/2+1);
P1(2:end-1) = 2*P1(2:end-1);
f = Fs/2*linspace(0,1,L/2+1);% Rfft
figure(2)
plot(f, P1,'r-','Marker','.','markersize',10,'linewidth',1.5)
axis([0.5e6 1.5e6 0 1.5])
title('fontsize{10}fontname{Times New Roman}Power Spectrum')
xlabel('fontsize{10}fontname{Times New Roman}it f /rm Hz')
ylabel('fontsize{10}fontname{Times New Roman}it yrm(itfrm)')
grid on;
set(gca,'FontSize', 10 ,'FontName', 'Times New Roman')
set(gcf,'unit','centimeters','position',[15 10 13.53 9.03],'color','white')
图8 中会有一些旁瓣出现,这是因为补零影响了原始信号,如果,直接采8000个点作为原始数据,即将程序中的L0改为8000,那么有:
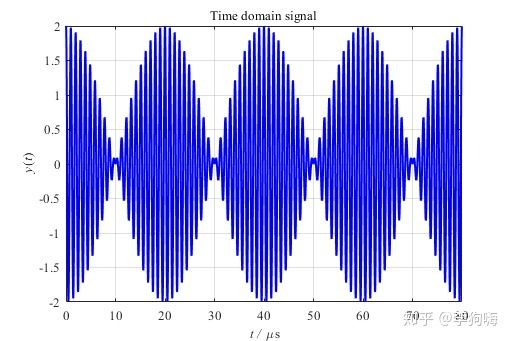
图9. 8000个数据点
并对其做FFT,结果如下
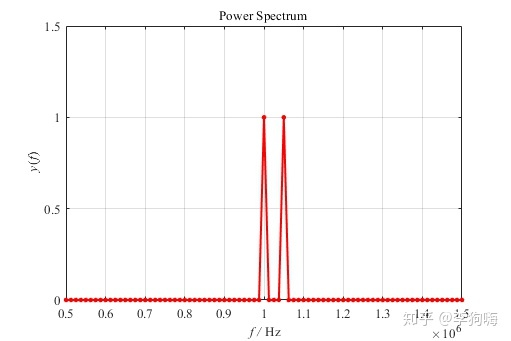
图10. 8000个数据点做FFT的频谱
这样就不存在补零带来的误差了。
参考
- ^Zero Padding http://www.bitweenie.com/listings/fft-zero-padding/
- ^Zero Padding Theorem https://ccrma.stanford.edu/~jos/dft/Zero_Padding_Theorem_Spectral.html
最后
以上就是直率万宝路最近收集整理的关于快速傅里叶变换(FFT)中为什么要“补零”?的全部内容,更多相关快速傅里叶变换(FFT)中为什么要“补零”内容请搜索靠谱客的其他文章。


发表评论 取消回复