参考链接:https://blog.csdn.net/Maggie_zhangxin/article/details/73481417
实现的内容很简单,存为.m文件可以直接在matlab上运行,就是利用Q学习(Q learning)完成自主路径寻优简单示例,并进行可视化,Q学习部分参考了如上链接中的内容,供大家交流学习使用,请多提宝贵意见
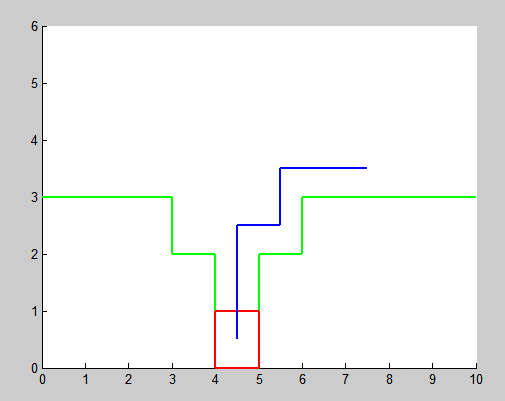
如图为最终路径,红色方框代表机器人,绿色区域代表障碍,中间底部位置(图示红色方框位置)为目标位置,蓝色为运动轨迹
本程序对训练过程进行了可视化,方便理解学习过程,代码如下:
clc;
clear all;
% define state
R=ones(60,60)*-inf;
for i=1:30
   if i-10>0
       R(i,i-10)=0;
   end
   if i+10<31
       R(i,i+10)=0;
   end
   if mod(i,10)~=1
       R(i,i-1)=0;
   end
   if mod(i,10)~=0;
       R(i,i+1)=0;
   end
end
R(24,34)=0;R(25,35)=0;R(26,36)=0;
R(34,24)=0;R(35,25)=0;R(36,26)=0;
R(34,35)=0;R(35,36)=0;R(35,34)=0;R(36,35)=0;
R(35,45)=0;R(45,35)=0;
R(45,55)=100;R(55,45)=0;

% reinforcement learning parameters
gamma=0.9;
q=zeros(size(R));     % q matrix
q1=ones(size(R))*inf; % previous q matrix
count=0;

% visualize obstacle
axis([0,10,0,6]);
hold on;
plot([0,3],[3,3],'g','linewidth',2);
plot([6,10],[3,3],'g','linewidth',2);
plot([3,3],[2,3],'g','linewidth',2);
plot([6,6],[2,3],'g','linewidth',2);
plot([4,4],[0,2],'g','linewidth',2);
plot([5,5],[0,2],'g','linewidth',2);
plot([3,4],[2,2],'g','linewidth',2);
plot([5,6],[2,2],'g','linewidth',2);

% intial state
y=randperm(30);
state=y(1);

% q learning
tic
for episode=0:50000

    qma=max(q(state,:));
    if qma~=0
       x=find(q(state,:)==qma);
    else
       x=find(R(state,:)>=0);
    end
    % choose action
    if size(x,1)>0
        x1=RandomPermutation(x);
        x1=x1(1);
    end
    % update q matrix
    qMax=max(q,[],2);
    q(state,x1)=R(state,x1)+gamma*qMax(x1);

    Y(i)=5.5-floor((x1-1)/10);
    X(i)=0.5+rem(x1-1,10);
    % visualization
    A=plot([X(i)-0.5,X(i)+0.5],[Y(i)-0.5,Y(i)-0.5],'r-','linewidth',2);
    B=plot([X(i)-0.5,X(i)+0.5],[Y(i)+0.5,Y(i)+0.5],'r-','linewidth',2);
    C=plot([X(i)-0.5,X(i)-0.5],[Y(i)-0.5,Y(i)+0.5],'r-','linewidth',2);
    D=plot([X(i)+0.5,X(i)+0.5],[Y(i)-0.5,Y(i)+0.5],'r-','linewidth',2);
    pause(0.05);

     % break if converged: small deviation on q for 1000 consecutive
     if sum(sum(abs(q1-q)))<0.0001 && sum(sum(q))>190
         if count>500,
             episode        % report last episode
             break          % for
         else
             count=count+1; % set counter if deviation of q is small
         end
     else
          q1=q;
          count=0;
     end

     if(R(state,x1)==100)
         y=randperm(30);
         state=y(1);
         pause(0.4);
     else
         state=x1;
     end
        delete(A);
        delete(B);
        delete(C);
        delete(D);

end
toc
%normalization
g=max(max(q));
if g>0,
    q=100*q/g;
end
需要配合函数使用,函数 RandomPermutation.m 在参考链接中给出,原作者:
Copyright Kardi Teknomo(c) 2005
(http://people.revoledu.com/kardi/)
这里一并给出
function y=RandomPermutation(A)
 %%%%%%%%%%%%%%%%%%%%%%%%%%%%%%%%%
 % return random permutation of matrix A
 % unlike randperm(n) that give permutation of integer 1:n only,
 % RandomPermutation rearrange member of matrix A randomly
 % This function is useful for MonteCarlo Simulation,
 %  Bootstrap sampling, game, etc.
 %
 % Copyright Kardi Teknomo(c) 2005
 % (http://people.revoledu.com/kardi/)
 %
 % example: A = [ 2, 1, 5, 3]
 % RandomPermutation(A) may produce [ 1, 5, 3, 2] or [ 5, 3, 2, 3]
 %
 % example:
 % A=magic(3)
 % RandomPermutation(A)
 %%%%%%%%%%%%%%%%%%%%%%%%%%%%%%%%%%%
   [r,c]=size(A);
   b=reshape(A,r*c,1);       % convert to column vector
   x=randperm(r*c);          % make integer permutation of similar array as key
   w=[b,x'];                 % combine matrix and key
   d=sortrows(w,2);          % sort according to key
   y=reshape(d(:,1),r,c);    % return back the matrix
--------------------- 2019-4-24 更新 ----------------------------------
感谢scxDAWN的提醒,示意图里面画训练结束后最终轨迹的程序附在下面,蓝线表示走过的轨迹,如果迭代次数不够多,可能会出现不太合理的轨迹,如果只希望看最终结果而不关心过程,可以把之前 q-learning 训练程序中画图的部分都去掉,可以很快得到最终收敛的结果,然后用下面程序检验训练效果即可:
axis([0,10,0,6]);
%grid on;
%axis equal;
hold on;
    plot([0,3],[3,3],'g','linewidth',2);
    plot([6,10],[3,3],'g','linewidth',2);
    plot([3,3],[2,3],'g','linewidth',2);
    plot([6,6],[2,3],'g','linewidth',2);
    plot([4,4],[0,2],'g','linewidth',2);
    plot([5,5],[0,2],'g','linewidth',2);
    plot([3,4],[2,2],'g','linewidth',2);
    plot([5,6],[2,2],'g','linewidth',2);

st=randperm(30);
s=st(1);
%s=28;

i=1;
while s~=55

    %商
    Y(i)=5.5-floor((s-1)/10);
    %余数
    X(i)=0.5+rem(s-1,10);
    %plot(X,Y,'*');

    A=plot([X(i)-0.5,X(i)+0.5],[Y(i)-0.5,Y(i)-0.5],'r-','linewidth',2);
    B=plot([X(i)-0.5,X(i)+0.5],[Y(i)+0.5,Y(i)+0.5],'r-','linewidth',2);
    C=plot([X(i)-0.5,X(i)-0.5],[Y(i)-0.5,Y(i)+0.5],'r-','linewidth',2);
    D=plot([X(i)+0.5,X(i)+0.5],[Y(i)-0.5,Y(i)+0.5],'r-','linewidth',2);
    pause(0.2);
    if i>1;
    plot([X(i-1),X(i)],[Y(i-1),Y(i)],'b-','linewidth',2);
    end

    qm=max(q(s,:));
    if qm~=0
       ac=find(q(s,:)==qm);
    else
       ac=find(R(s,:)>=0);
    end

    if size(ac,2)>1
        act=RandomPermutation(ac);
        act=act(1);
    else
        act=ac;
    end

        delete(A);
        delete(B);
        delete(C);
        delete(D);

    s=act;
    i=i+1;
end

%商
Y(i)=5.5-floor((s-1)/10);
%余数
X(i)=0.5+rem(s-1,10);
A=plot([X(i)-0.5,X(i)+0.5],[Y(i)-0.5,Y(i)-0.5],'r-','linewidth',2);
B=plot([X(i)-0.5,X(i)+0.5],[Y(i)+0.5,Y(i)+0.5],'r-','linewidth',2);
C=plot([X(i)-0.5,X(i)-0.5],[Y(i)-0.5,Y(i)+0.5],'r-','linewidth',2);
D=plot([X(i)+0.5,X(i)+0.5],[Y(i)-0.5,Y(i)+0.5],'r-','linewidth',2);

if i>1;
    plot([X(i-1),X(i)],[Y(i-1),Y(i)],'b-','linewidth',2);
end
最后
以上就是优美大山最近收集整理的关于Q学习(Q learning) 强化学习的简单例子 Matlab实现 可视化的全部内容,更多相关Q学习(Q内容请搜索靠谱客的其他文章。
本图文内容来源于网友提供,作为学习参考使用,或来自网络收集整理,版权属于原作者所有。


发表评论 取消回复