文章目录
- 1、问题建模
- 赛题理解
- 赛题数据
- 评价指标
- 混淆矩阵
- 线下验证
- 2、数据探索性分析(EDA)
- 3、特征工程
- 特征工程流程
- 实践中遇到的问题
- 4、模型调参
- lightgbm参数介绍
- 核心参数Core Parameters
- 学习控制参数 Learning Control Parameters
- 调参
- 一般步骤
- 学习率learning_rate和估计器数量n_estimators
- 树的最大深度max_depth、叶子节点数num_leaves
- min_data_in_leaf、max_bin
- feature_fraction、bagging_fraction、bagging_freq
- lambda_l1(reg_alpha)、lambda_l2(reg_lambda)
- cat_smooth
- 降低learning_rate,增加迭代次数,验证模型
- 5、模型融合
- 简单加权
- stacking/blending
- bagging/boosting
1、问题建模
赛题理解
赛题数据
每种数据集之间的关系
数据中缺失值的情况
类别特征和数值特征的基本分布
评价指标
分类指标:精确率、召回率、AUC、logloss
回归指标:MAE、MAPE、RMSE
本赛题为多分类问题,常用评价指标为混淆矩阵。
混淆矩阵
准确率通常无法成为分类器的首要性能指标,特别是当你处理有偏数据集时(即某些类比其他类更为频繁)。
可以使用confusion_matrix()函数来获取混淆矩阵
from sklearn.metrics import confusion_matrix

confusion_matrix(y_train_5, y_train_pred)

混淆矩阵中的行表示实际类别,列表示预测类别。
混淆矩阵能提供大量信息,但有时你可能希望指标更简洁一些。正类预测的准确率precision_score是一个有意思的指标,它也称为分类器的精度
from sklearn.metrics import precision_score, recall_score
precision_score(y_train_5, y_train_pred)
召回率recall_score:
recall_score(y_train_5, y_train_pred)
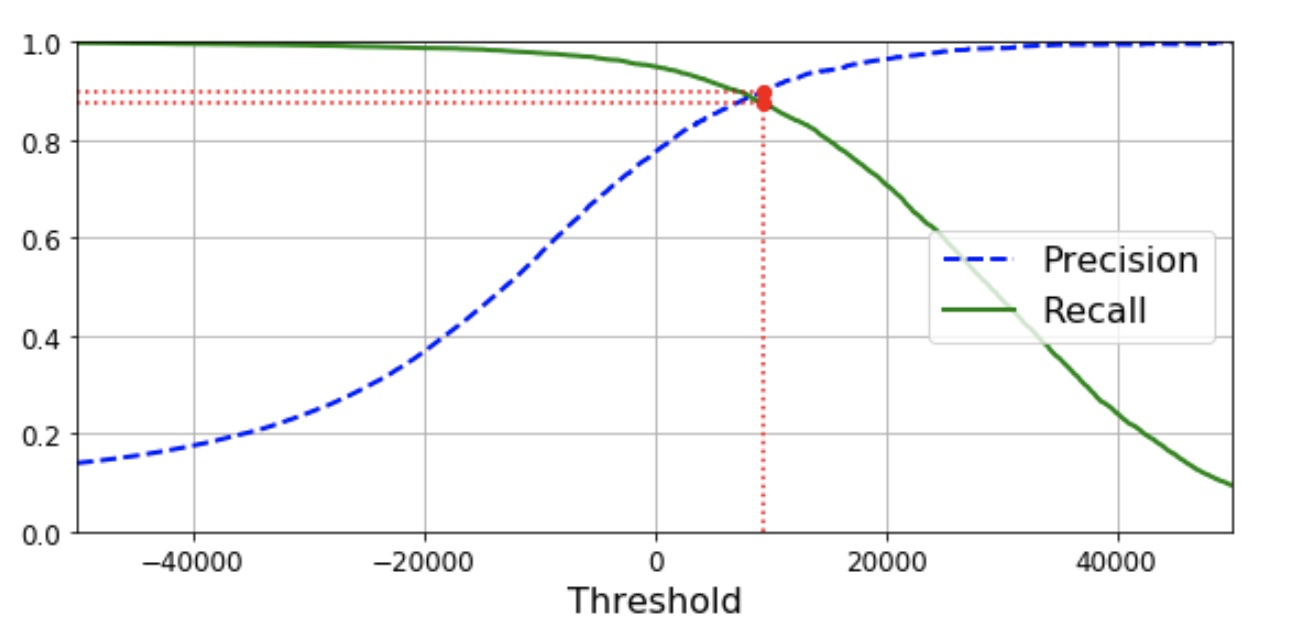
根据精度、召回率-阈值曲线选取合适的阈值:
#绘制精度、召回率相对于阈值的曲线,根据曲线选取合适的阈值
def plot_precision_recall_vs_threshold(precisions, recalls, thresholds):
    plt.plot(thresholds, precisions[:-1], "b--", label="Precision", linewidth=2)
    plt.plot(thresholds, recalls[:-1], "g-", label="Recall", linewidth=2)
    plt.legend(loc="center right", fontsize=16) # Not shown in the book
    plt.xlabel("Threshold", fontsize=16)        # Not shown
    plt.grid(True)                              # Not shown
    plt.axis([-50000, 50000, 0, 1])             # Not shown


recall_90_precision = recalls[np.argmax(precisions >= 0.90)]
threshold_90_precision = thresholds[np.argmax(precisions >= 0.90)]


plt.figure(figsize=(8, 4))                                                                  # Not shown
plot_precision_recall_vs_threshold(precisions, recalls, thresholds)
plt.plot([threshold_90_precision, threshold_90_precision], [0., 0.9], "r:")                 # Not shown
plt.plot([-50000, threshold_90_precision], [0.9, 0.9], "r:")                                # Not shown
plt.plot([-50000, threshold_90_precision], [recall_90_precision, recall_90_precision], "r:")# Not shown
plt.plot([threshold_90_precision], [0.9], "ro")                                             # Not shown
plt.plot([threshold_90_precision], [recall_90_precision], "ro")                             # Not shown
save_fig("precision_recall_vs_threshold_plot")                                              # Not shown
plt.show()
线下验证
- 时序验证
时序型数据,一般会选择与测试集在时间上比较接近的数据作为验证集 - 大多数时候采用 k折交叉验证
2、数据探索性分析(EDA)
- 了解数据
数据类型
数据是否干净
标签是什么类型的
扩展:更进一步了解数据——数据集大小、字段类型、缺失值、特征冗余、时间信息、标签分布是否不平衡、单变量/多变量分布
-
为建模做准备
线下验证集构建是否可能会穿越;
是否存在某些奇异现象(如时序的周期变化现象) -
本赛题的EDA主要流程
1、数据总览:
通过describe()来熟悉数据的相关统计量Train_data.describe()通过
info()来熟悉数据类型
2、判断数据缺失和异常
查看每列的存在nan情况
异常值检测
3、了解预测值的分布
总体分布概况
查看skewness and kurtosis
	sns.distplot(Train_data['label']);
	print("Skewness: %f" % Train_data['label'].skew())
	print("Kurtosis: %f" % Train_data['label'].kurt())
3、特征工程
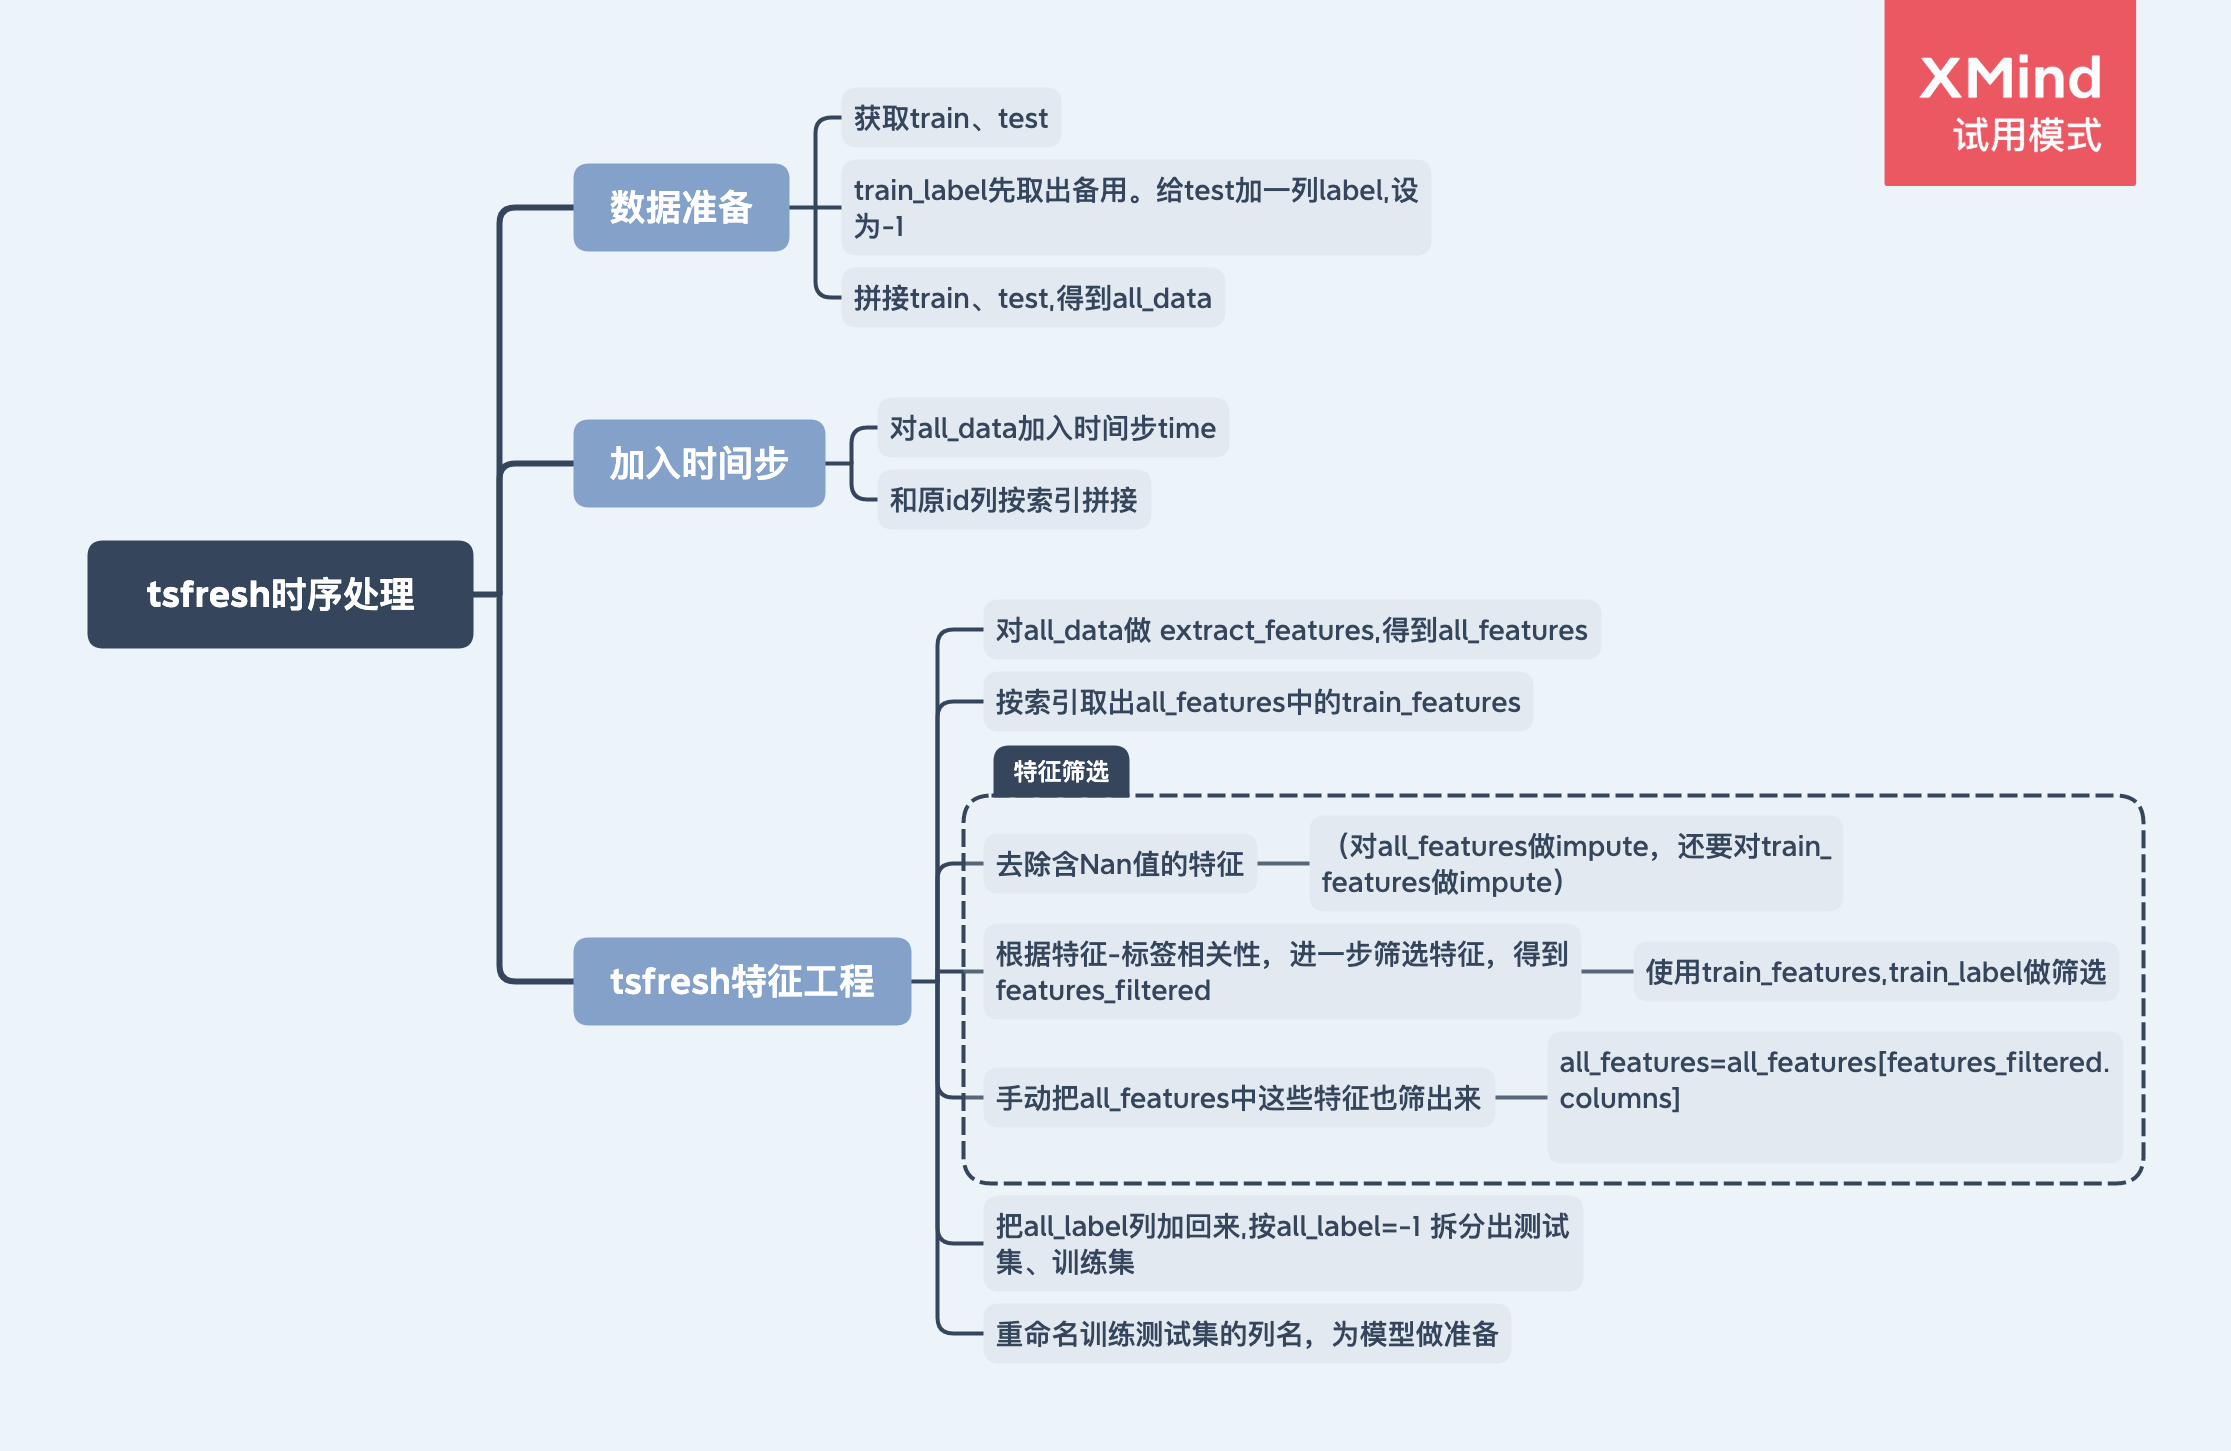
时序特征处理办法:tsfresh
TsFresh能自动地计算出大量的时间序列特征,即所谓的特征,这些特征描述了时间序列的基本特征,如峰数、平均值或最大值或更复杂的特征,如时间反转对称统计。同时通过假设检验来将特征消减到最能解释趋势的特征,称为去相关性。然后,可以使用这些特征集在时间序列上构造统计或机器学习模型,例如在回归或分类任务中使用。
来源:特征工程工具总结-tsfresh
特征工程流程
实践中遇到的问题
1、cpu跑不动tsfresh
换用天池实验室的GPU;注意GPU安装lightgbm、tsfresh包时,pip命令为!pip install lightgbm --user
2、天池实验室安装tsfresh包时,其依赖的包版本不够新
一开始装tsfresh报错,说/opt/conda/lib/python3.6/site-packages/下的scipy包版本太老需要更新,但由于我们没有天池的/opt/conda/lib/python3.6/site-packages/目录下的包的操作权限,在天池terminal中pip install scipy也只是装在了/data/nas/workspace/envs/python3.6/site-packages/目录下。
办法:降低tsfresh版本,使用0.16.0版本的,其依赖的scipy只需要>=1.2.0
!pip install tsfresh==0.16.0 --user
3、特征工程中,是否应该同时对训练集、测试集使用,还是分别对训练集、测试集使用特征工程?
警惕「特征工程」中的陷阱
解决方案:
在划分训练集测试集前,充分打乱数据顺序,对整体数据做统一的特征工程。
(当然如果数据是时序型数据,就不能直接打乱,因为需要用历史数据预测未来数据。对于本赛题,参考下方 第5项 中的解释 )
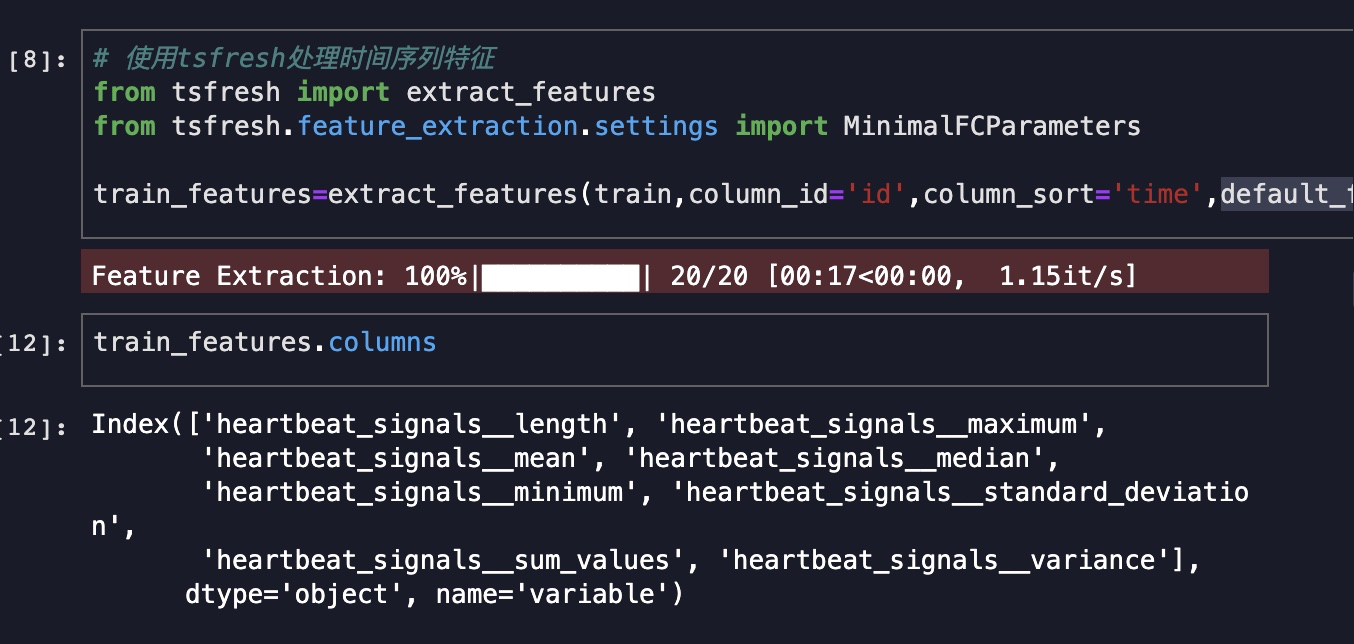
4、tsfresh跑不动大的输入数据
天池GPU大概跑到进度为80%时会卡死,
解决办法:减少tsfresh构造的特征数量,仅使用基础的几个特征(比如maxminmedian等)
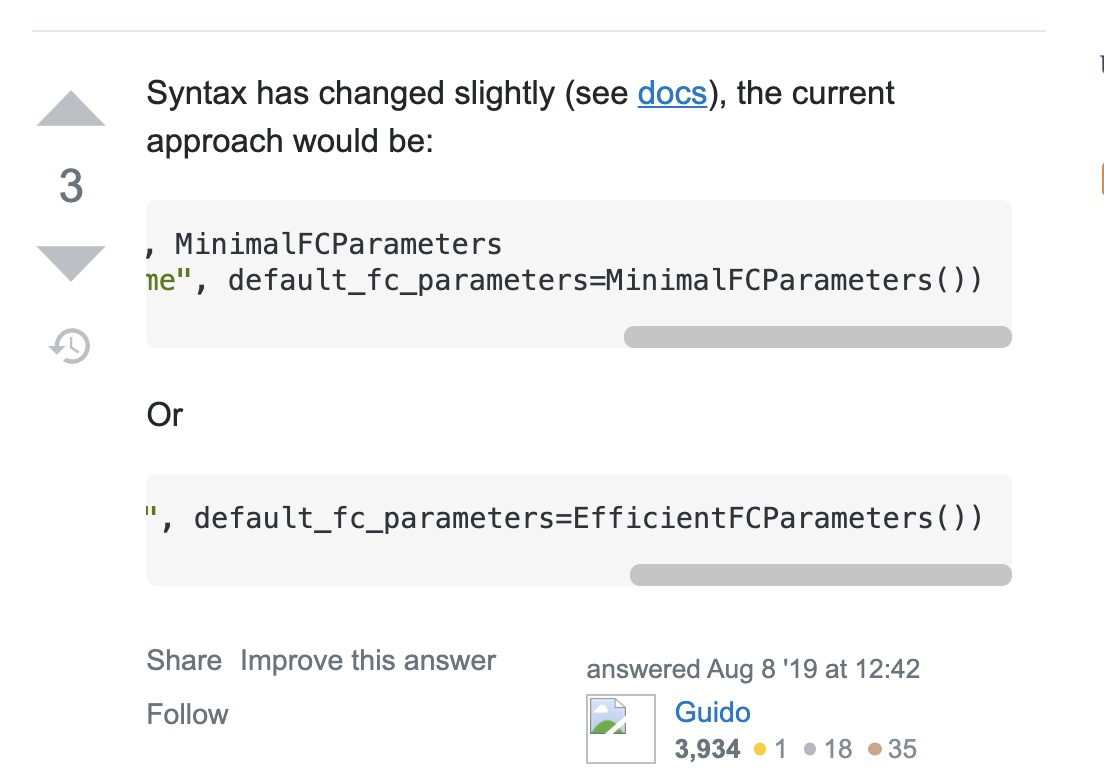
参数设置default_fc_parameters = MinimalFCParameters()注:这种方法得到的特征还是太少了,最后分数都到9000+了,放弃。。。(后面直接下载别人跑完的结果了)
结果:
5、可以把训练测试集分批进行tsfresh吗?
再仔细看看tsfresh的column_id参数,会发现其实tsfresh计算出的新特征,都是以column_id指定的列进行group by分组的,
因此可以 把数据分批用tsfresh处理,只要不把同一个column_id的时间步特征拆开。
所以在本赛题中,上面第3、点的问题,训练集、测试集是否分开做tsfresh,结果应该是一样的。
6、根据特征和标签的相关性 做进一步的特征筛选时,需要根据训练数据 计算相关性,因为只有训练数据的label是正确已知的。
# 根据特征和标签的相关性 做进一步的特征筛选
from tsfresh import select_features
features_filtered=select_features(train_features,train_label)
(但是在前面做 extract_features时需要对全部数据做处理,可以把测试集的label设为-1以便后面拆分 )
all_features=extract_features(all_data,column_id='id',column_sort='time')
扩展:
tsfresh文档中给出的some_feature_selection 方法可以一步完成 特征抽取 和 相关特征过滤的操作。
# X_tsfresh contains the extracted tsfresh features
X_tsfresh = extract_features(...)

# which are now filtered to only contain relevant features
X_tsfresh_filtered = some_feature_selection(X_tsfresh, y, ....)

# we can easily construct the corresponding settings object
kind_to_fc_parameters = tsfresh.feature_extraction.settings.from_columns(X_tsfresh_filtered)
4、模型调参
lightgbm参数介绍
lightgbm 参数(本文只关注实践中最常用的参数,其他参数见官方文档 )
核心参数Core Parameters
| 参数 | 含义 | 更多说明 | 别名 |
|---|---|---|---|
| boosting | 默认gbdt | 可选项:gbdt(传统的梯度提升决策树),rf(随机森林),dart,()goss(基于梯度的单边采样) | boosting_type,boost |
| learning_rate | 学习率,默认0.1 | 控制模型迭代速度,值越大模型迭代越快(每次梯度的步长越大),但容易跳过最优点到达极值点; 越小模型迭代越慢,但更有可能到达最优点。 | shrinkage_rate,eta |
| num_iterations | boosting迭代的次数,默认100 | number of boosting iterations | num_iteration,n_iter,num_tree,num_trees,num_round,num_rounds,num_boost_round,n_estimators |
| num_leaves | 一棵树中最大的叶子数 ,默认31 | max number of leaves in one tree | num_leaf, max_leaves, max_leaf |
学习控制参数 Learning Control Parameters
| 参数 | 含义 | 更多说明 | 别名 |
|---|---|---|---|
| max_depth | 限制树模型的最大深度,默认-1 | 当数据量小时,用来避免过拟合,值<=0时为不限制 | |
| feature_fraction | 随机选取的特征子集的占比,默认1.0 | LightGBM will randomly select a subset of features on each iteration (tree) if feature_fraction is smaller than 1.0. For example, if you set it to 0.8, LightGBM will select 80% of features before training each tree can be used to speed up training can be used to deal with over-fitting | sub_feature, colsample_bytree |
| bagging_fraction | 和 feature_fraction功能一样,但不重采样 ,默认1.0 | like feature_fraction, but this will randomly select part of data without resampling ,can be used to speed up training ,can be used to deal with over-fitting | sub_row, subsample, bagging |
| bagging_freq | bagging频率,默认0 | 0 means disable bagging; k means perform bagging at every k iteration. Every k-th iteration, LightGBM will randomly select bagging_fraction * 100 % of the data to use for the next k iterations | subsample_freq |
| lambda_l1 | L1正则化 ,默认0.0 | reg_alpha | |
| lambda_l2 | L2正则化 , 默认0.0 | reg_lambda, lambda | |
| cat_smooth | 减轻类别特征噪声的参数,默认10.0 | used for the categorical features. can reduce the effect of noises in categorical features, especially for categories with few data |
调参
一般步骤
基于决策树的模型,调参方法都差不多,一般步骤如下:
1、先选较高的学习率learning_rate ,一般取0.1。(为了加快收敛速度)
2、对决策树基本参数调参
3、正则化参数调参
4、降低学习率learning_rate (为了提高准确率)
学习率learning_rate和估计器数量n_estimators
首先取 learning_rate=0.1 ,然后确定估计器类型boosting_type ,默认选择gbdt。
估计器数量n_estimators(即树的数量),可以先将该参数设为一个较大的数。
在网格搜索前,先给其他重要的参数一个初始值。
'boosting': 'gbdt',
'objective': 'binary',
'metric': 'auc',
'max_depth': 5     # 树的最大深度,根据数据集大小选取4-10之间的值。
'num_leaves': 30   # 由于lightGBM是leaves_wise生长,官方建议小于2^max_depth
'subsample'/'bagging_fraction':0.8           # 数据采样
'colsample_bytree'/'feature_fraction': 0.8   # 特征采样
树的最大深度max_depth、叶子节点数num_leaves
确定树的大小和复杂度,这两个参数可同时调整。
from sklearn.model_selection import GridSearchCV
params={
    'max_depth':[4,6,8]
    ,'num_leaves':[20,30,40]
}
gbm=lgb.LGBMClassifier(objective='binary'
                       ,is_unbalance=True
                       ,metric='binary_logloss,auc'
                       ,max_depth=6
                       ,num_leaves=40
                       ,learning_rate=0.1
                       ,feature_fraction=0.7
                       ,min_child_samples=21
                       ,min_child_weight=0.001
                       ,bagging_fraction=1
                       ,bagging_freq=2
                       ,lambda_l1=0.001
                       ,lambda_l2=8
                       ,cat_smooth=0
                       ,num_iterations=200
                      )
gsearch=GridSearchCV(gbm,param_grid=params,scoring='roc_auc',cv=3)
gsearch.fit(train_x,train_y)
print('参数的最佳取值:{0}'.format(gsearch.best_params_))
print('最佳模型得分:{0}'.format(gsearch.best_score_))
print(gsearch.cv_results_['mean_test_score'])
print(gsearch.cv_results_['params'])
min_data_in_leaf、max_bin
这两个参数主要用来防止过拟合。
parameters = {
'min_child_samples': [18,19,20,21,22],
'min_child_weight':[ [0.001,0.002]
}
feature_fraction、bagging_fraction、bagging_freq
随机选择一定比例的特征,防止过拟合。
parameters = {
    'feature_fraction': [0.6, 0.8, 1],
    'bagging_fraction': [0.8,0.9,1],
    'bagging_freq': [2,3,4]
}
lambda_l1(reg_alpha)、lambda_l2(reg_lambda)
cat_smooth
parameters = {
     'cat_smooth': [0,10,20],
}
降低learning_rate,增加迭代次数,验证模型
5、模型融合
简单加权
加权融合在回归中表现为取算术平均,在分类中表现为 投票Voting from sklearn.ensemble import VotingClassifier
stacking/blending
- Stacking
Stacking 是一种分层型的集成框架。核心思想为并行地训练一系列各自独立的不同类模型,然后通过训练一个元模型(meta-model)来将各个模型的输出结果进行结合。
使用第一层交叉验证的验证集的预测结果作为第二层的training_data
(如果是5折交叉验证,则有5个验证集的预测结果,这5个结果,纵向拼接到一起。记作A1)
(第一层有多个学习器时,取各个学习器的验证集的预测结果的横向拼接 (即可能有A1、A2、A3等等))
而第一层交叉验证的 测试集的预测结果 作为第二层的test_data
(如果是5折交叉验证则有5个测试集的预测结果,这5组结果进行加权平均,化成【一组结果】,记作B1)
(第一层有多个学习器时,每个学习器都输出【一组结果】,可能是B1、B2、B3等等,将这三组横向拼接作为第二层的test_data)

图源:https://blog.csdn.net/maqunfi/article/details/82220115
stacking相比较于boosting这种串行集成,有什么优缺点?
stacking一般最后一层用logistic Regression. 有可能过拟合,很少使用。
Boosting : 每次寻找一个可以解决当前错误的分类器,最后再通过权重加和。好处是自带了特征选择,发现有效的特征。也方便去理解高维数据。Boosting集成方法经常被用于改善模型高偏差的情况(欠拟合现象)。
Bagging: 训练多个弱分类器投票解决。随机选取训练集,避免了过拟合。
bagging/boosting
-
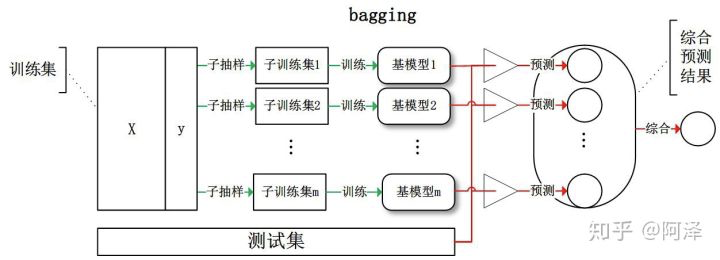
bagging
每个预测器使用的算法都相同,但是在不同的训练集随机子集上进行训练。采样时若将样本放回,这种方法叫bagging(bootstrap=True),不放回叫pasting。
集成通过简单聚合所有预测器的预测来对新实例做出预测。聚合函数通常是统计法用于分类(即最多数的预测,类似于hard voting),平均法用于回归。
-
boosting
boosting框架中,上一个基模型的残差作为下一个分类器的输入,这个过程就是在不断减小偏差,使模型不断逼近“靶心”。
最后
以上就是风趣斑马最近收集整理的关于心跳信号分类预测(tsfresh特征工程)的全部内容,更多相关心跳信号分类预测(tsfresh特征工程)内容请搜索靠谱客的其他文章。



发表评论 取消回复