本文首次在公众号【零妖阁】上发表,为了方便阅读和分享,我们将在其他平台进行自动同步。由于不同平台的排版格式可能存在差异,为了避免影响阅读体验,建议如有排版问题,可前往公众号查看原文。感谢您的阅读和支持!
利用Matlab绘制正方形、圆形、椭圆形,并填充颜色。
1 绘制正方形
2 绘制圆形
3 绘制椭圆形
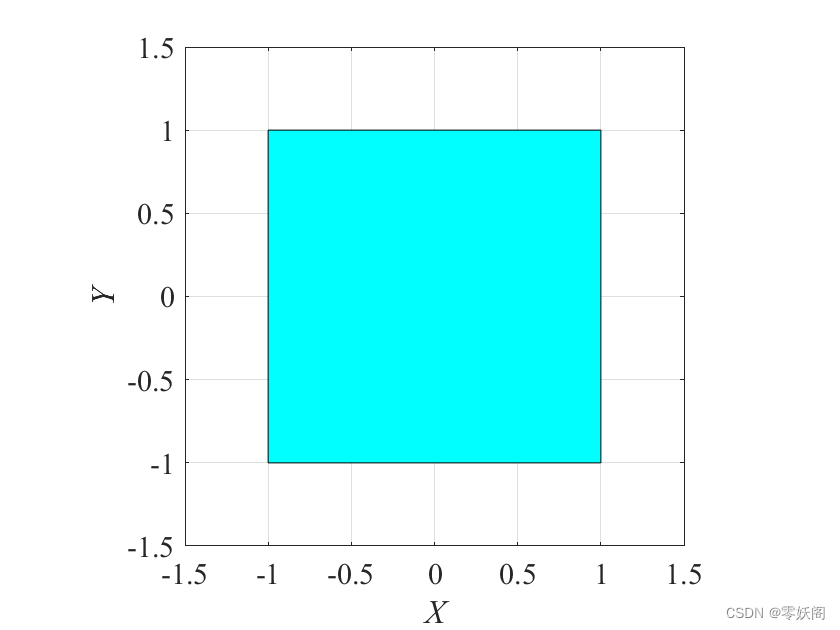
绘制正方形
a = 2;   % 正方形边长
x = [a/2, -a/2, -a/2, a/2];
y = [a/2, a/2, -a/2, -a/2];
%% 绘图
figure;
fill(x, y, 'c');
axis([-a/2-0.5, a/2+0.5, -a/2-0.5, a/2+0.5]);
grid on;
xlabel('X', 'fontsize', 15, 'fontname','Times', 'FontAngle','italic');
ylabel('Y', 'fontsize', 15, 'fontname','Times', 'FontAngle','italic');
set(gca, 'fontsize', 15, 'fontname','Times');
axis square;
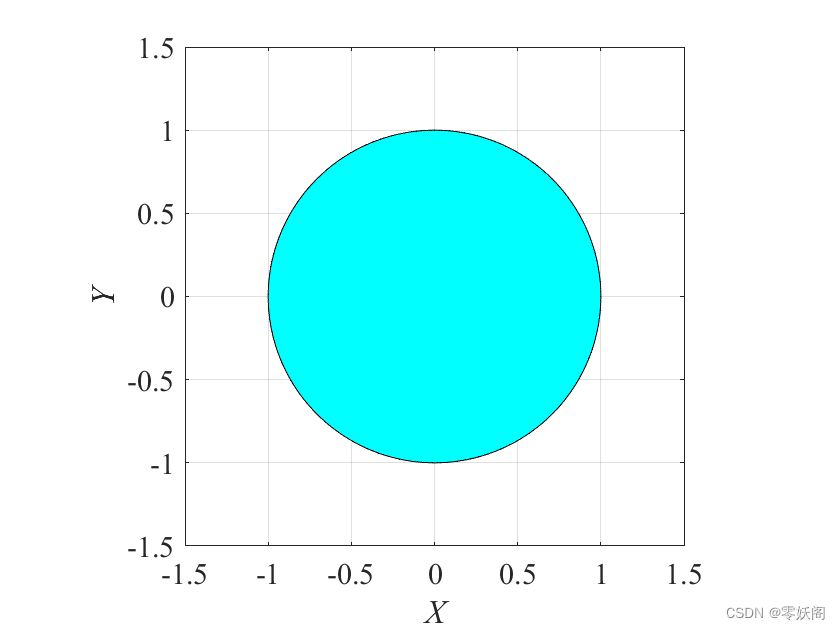
绘制圆形
设圆的半径为
r
r
r ,其参数方程为
{
x
=
r
cos
(
θ
)
y
=
r
sin
(
θ
)
begin{cases} x = rcos(theta) \ y = rsin(theta) end{cases}
{x=rcos(θ)y=rsin(θ)
%% 圆的坐标
r = 1;     % 圆的半径
theta = 0:0.01:2*pi;
x = r*cos(theta);
y = r*sin(theta);
%% 绘图
figure;
fill(x, y, 'c');
axis([-r-0.5, r+0.5, -r-0.5, r+0.5]);
grid on;
xlabel('X', 'fontsize', 15, 'fontname','Times', 'FontAngle','italic');
ylabel('Y', 'fontsize', 15, 'fontname','Times', 'FontAngle','italic');
set(gca, 'fontsize', 15, 'fontname','Times');
axis square;
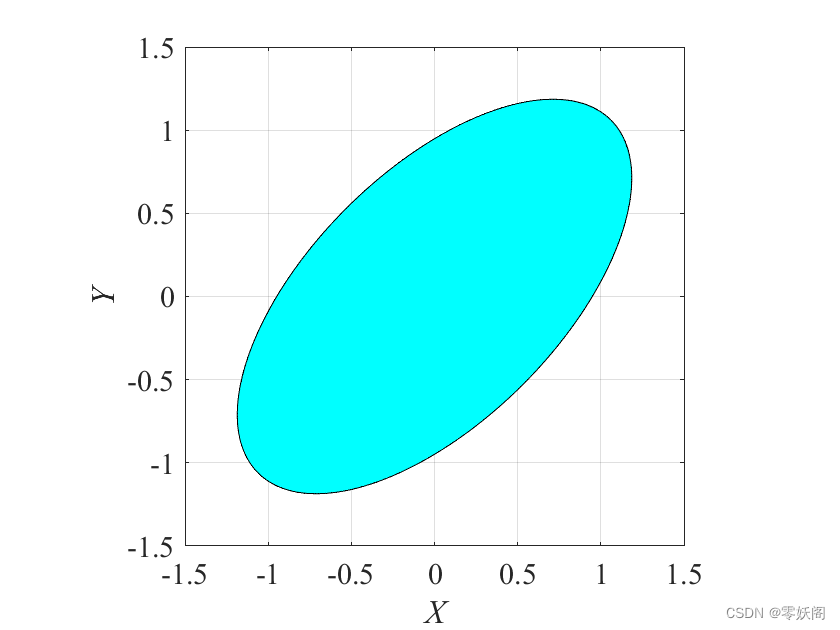
绘制椭圆形
设椭圆的长轴为
2
a
2a
2a ,短轴为
2
b
2b
2b, 其参数方程为
{
x
=
a
cos
(
θ
)
y
=
b
sin
(
θ
)
begin{cases} x = acos(theta) \ y = bsin(theta) end{cases}
{x=acos(θ)y=bsin(θ)
当椭圆逆时针旋转 θ r theta_r θr ,其旋转后的坐标为
[ x ′ y ′ ] = [ cos ( θ r ) − sin ( θ r ) sin ( θ r ) cos ( θ r ) ] [ x y ] left[ begin{matrix} x' \ y' end{matrix} right] = left[ begin{matrix} cos(theta_r) & -sin(theta_r) \ sin(theta_r) & cos(theta_r) end{matrix} right] left[ begin{matrix} x \ y end{matrix} right] [x′y′]=[cos(θr)sin(θr)−sin(θr)cos(θr)][xy]
%% 标准椭圆
a = 3;      % 长轴
b = 1.5;    % 短轴的
theta = 0:0.01:2*pi;
x0 = a/2*cos(theta);
y0 = b/2*sin(theta);
%% 旋转45度后的椭圆坐标
theta_r = pi/4;     % 旋转角度
x = cos(theta_r)*x0 - sin(theta_r)*y0;
y = sin(theta_r)*x0 + cos(theta_r)*y0;
%% 绘图
figure;
fill(x, y, 'c');
axis([-1.5, 1.5, -1.5, 1.5]);
grid on;
xlabel('X', 'fontsize', 15, 'fontname','Times', 'FontAngle','italic');
ylabel('Y', 'fontsize', 15, 'fontname','Times', 'FontAngle','italic');
set(gca, 'fontsize', 15, 'fontname','Times');
axis square;
最后
以上就是等待短靴最近收集整理的关于用Matlab绘制正方形圆形椭圆绘制正方形绘制圆形绘制椭圆形的全部内容,更多相关用Matlab绘制正方形圆形椭圆绘制正方形绘制圆形绘制椭圆形内容请搜索靠谱客的其他文章。


发表评论 取消回复