我们处理好图像后,为了标识出图像的目标区域来,需要利用plot函数或者rectangle函数,这样标识目标后,就保存图像。一般的保存图像可以利用figure中的edit菜单中的copy figure,这样可以完成,但是保存后的图像外围多了一片区域,这是figure的区域,效果如下

于是我们想办法,利用imwrite函数可以保存图像,但是利用plot或者rectangle函数后,并没有改变图像原来的像素值,imwrite函数不可以。怎么办?哈哈……于是就有了下面的一种算法……
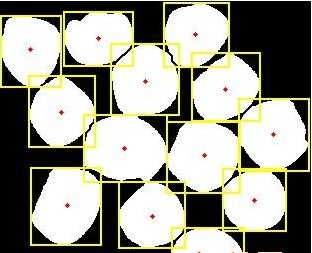
以下面的图像为例,将图像中的白色区域利用矩形标记出来:

具体的程序如下所示:
clc;close all;clear all;
Img=imread('1.jpg');
if ndims(Img)==3
I=rgb2gray(Img);
else
I=Img;
end
I=im2bw(I,graythresh(I));
[m,n]=size(I);
imshow(I);title('binary image');
txt=get(gca,'Title');
set(txt,'fontsize',16);
L=bwlabel(I);
stats=regionprops(L,'all');
set(gcf,'color','w');
set(gca,'units','pixels','Visible','off');
q=get(gca,'position');
q(1)=0;%设置左边距离值为零
q(2)=0;%设置右边距离值为零
set(gca,'position',q);
for i=1:length(stats)
hold on;
rectangle('position',stats(i).BoundingBox,'edgecolor','y','linewidth',2);
temp = stats(i).Centroid;
plot(temp(1),temp(2),'r.');
drawnow;
end
frame=getframe(gcf,[0,0,n,m]);
im=frame2im(frame);
imwrite(im,'a.jpg','jpg');%可以修改保存的格式
保存图像如下所示:

最后
以上就是积极草莓最近收集整理的关于Matlab中对图像应用plot或者rectangle后的图像保存问题的全部内容,更多相关Matlab中对图像应用plot或者rectangle后内容请搜索靠谱客的其他文章。


发表评论 取消回复