我是靠谱客的博主 懦弱巨人,这篇文章主要介绍利用 FFT 运算恢复原来的信号,PSD和原来信号之间的关系一、 信号建模二、 利用FFT恢复信号信号的功率谱密度(周期图求PSD),现在分享给大家,希望可以做个参考。
明:利用FFT运算实现信号的重构
一、 信号建模
% Use Fourier transforms to find the frequency components of a signal buried in noise.

% Specify the parameters of a signal with a sampling frequency of 1 kHz and a signal duration of 1.5 seconds.

Fs = 1000;            % Sampling frequency
T = 1/Fs;             % Sampling period
L = 1500;             % Length of signal
t = (0:L-1)*T;        % Time vector
Form a signal containing a 50 Hz sinusoid of amplitude 0.7 and a 120 Hz sinusoid of amplitude 1.

S = 0.7*sin(2*pi*50*t) + sin(2*pi*120*t);
% Corrupt the signal with zero-mean white noise with a variance of 4.

X = S + 2*randn(size(t));
% Plot the noisy signal in the time domain. It is difficult to identify the frequency components by looking at the signal X(t).

plot(1000*t(1:50),X(1:50))
title('Signal Corrupted with Zero-Mean Random Noise')
xlabel('t (milliseconds)')
ylabel('X(t)')
二、 利用FFT恢复信号
% Compute the Fourier transform of the signal.

Y = fft(X);
% Compute the two-sided spectrum P2. Then compute the single-sided spectrum P1 based on P2 and the even-valued signal length L.

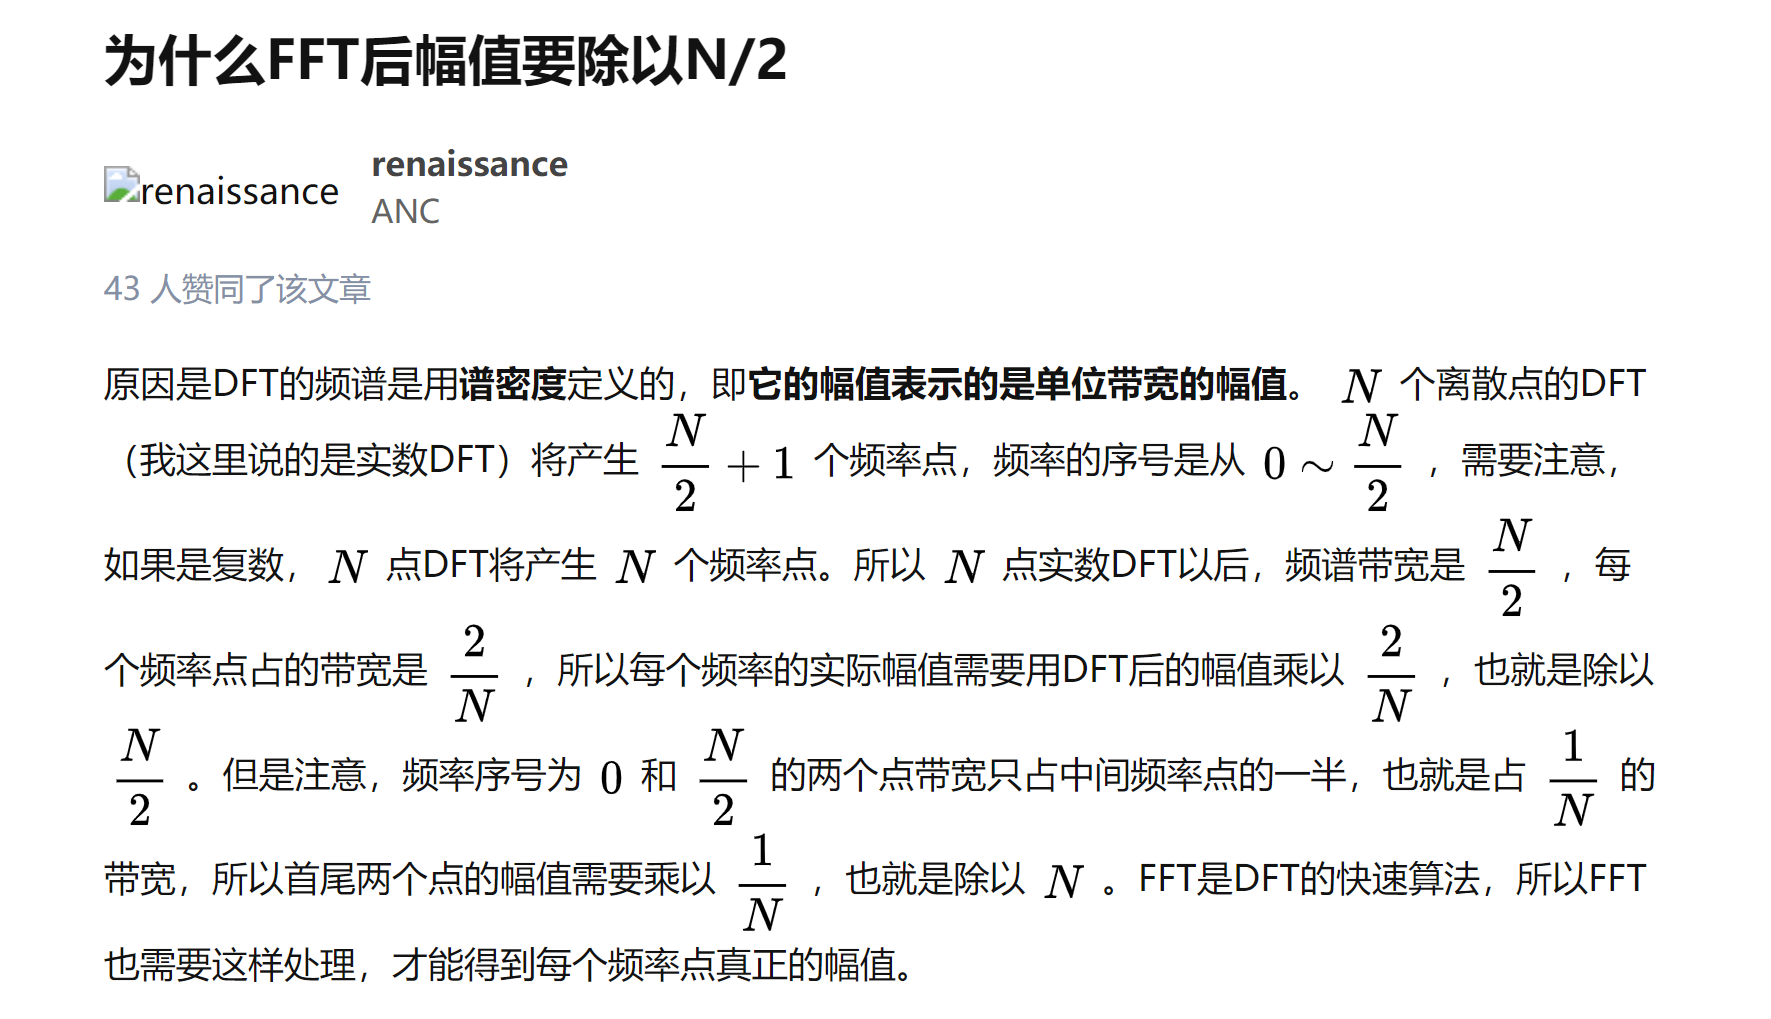
P2 = abs(Y/L);
P1 = P2(1:L/2+1);% 取右半部分
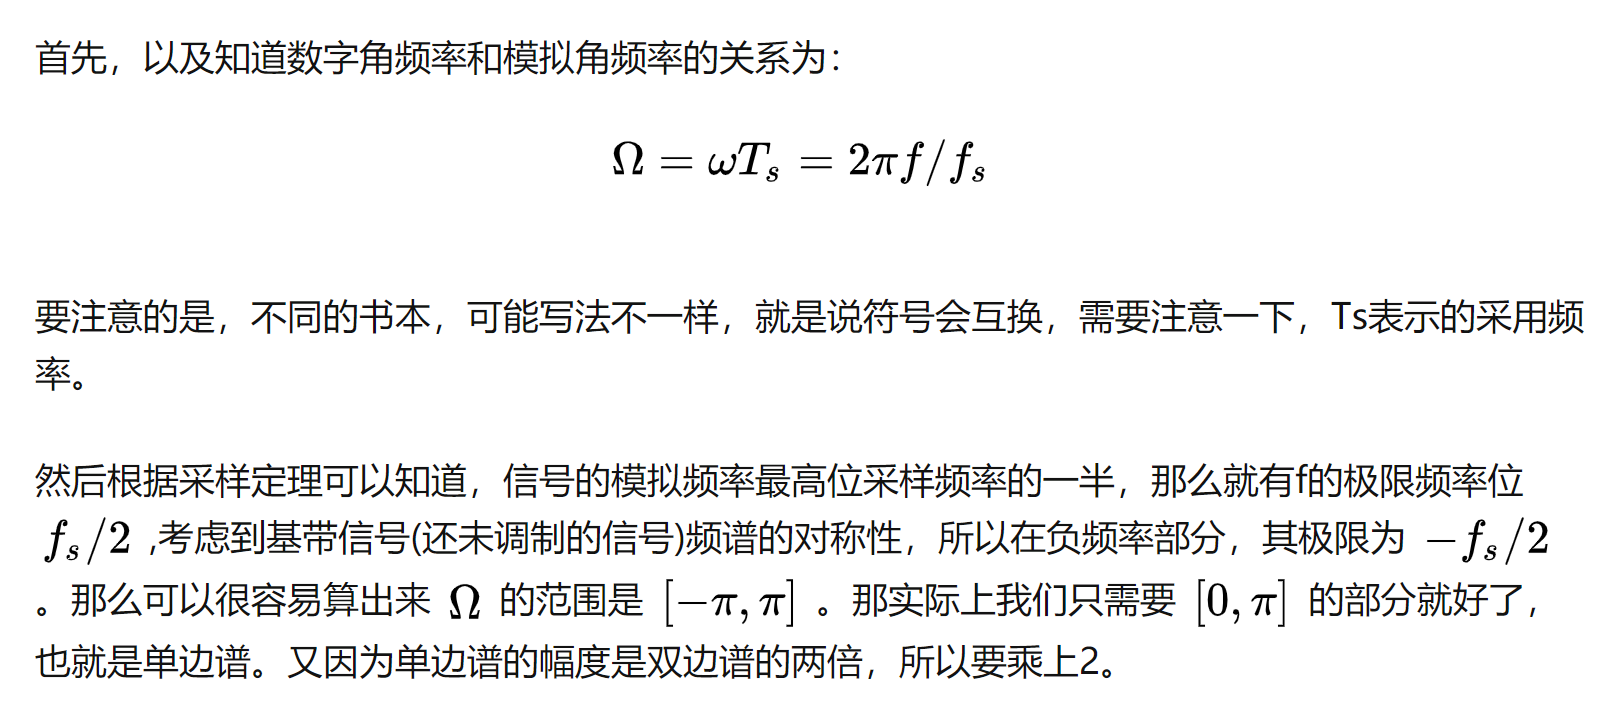
P1(2:end-1) = 2*P1(2:end-1);% 除掉两头的乘2倍
% Define the frequency domain f and plot the single-sided amplitude spectrum P1. The amplitudes are not exactly at 0.7 and 1, as expected, because of the added noise. On average, longer signals produce better frequency approximations.

f = Fs*(0:(L/2))/L; % 频率范围
plot(f,P1)
title('Single-Sided Amplitude Spectrum of X(t)')
xlabel('f (Hz)')
ylabel('|P1(f)|')


% Now, take the Fourier transform of the original, uncorrupted signal and retrieve the exact amplitudes, 0.7 and 1.0.
% 无噪声干扰条件恢复原来信号
Y = fft(S);
P2 = abs(Y/L);
P1 = P2(1:L/2+1);
P1(2:end-1) = 2*P1(2:end-1);

plot(f,P1)
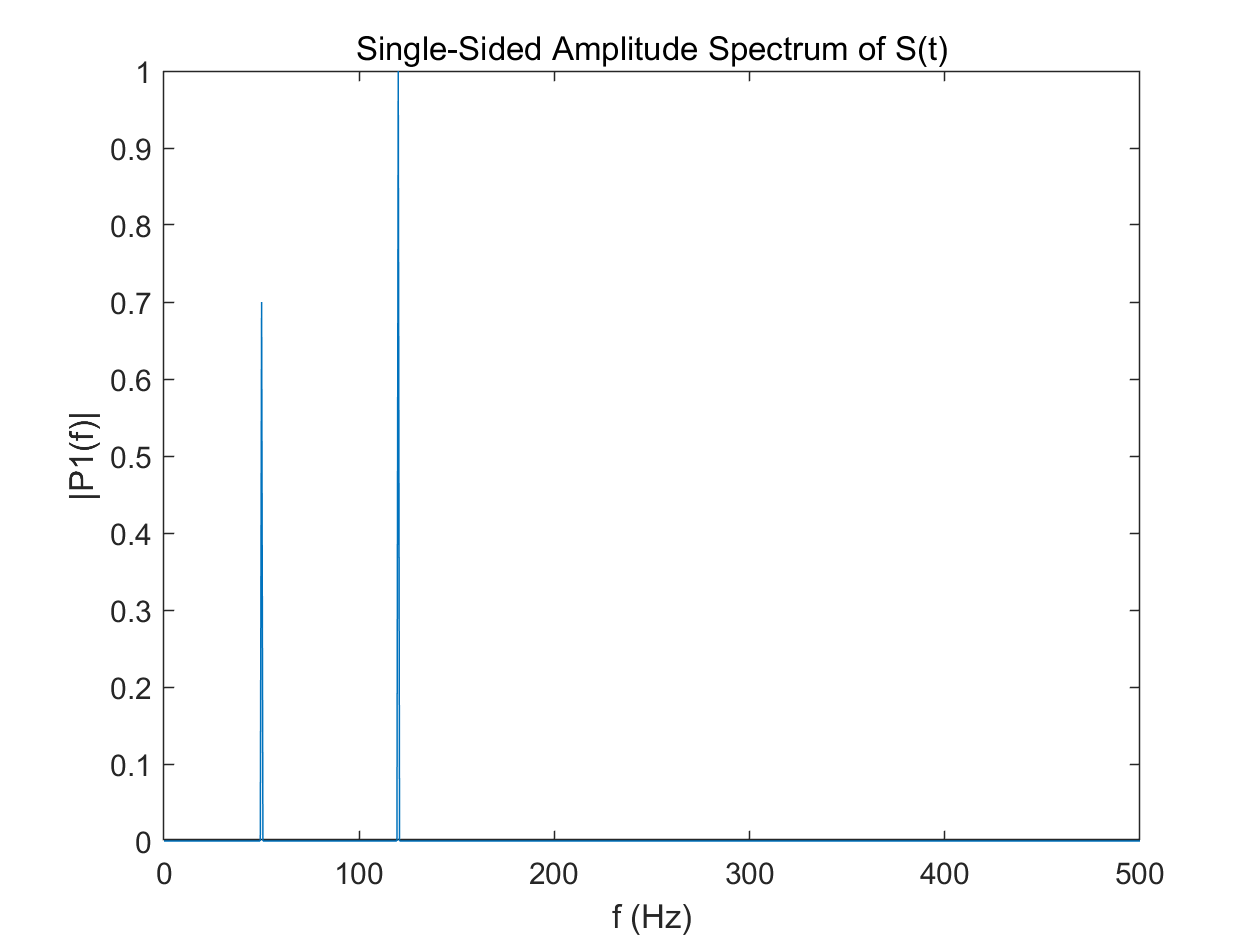
title('Single-Sided Amplitude Spectrum of S(t)')
xlabel('f (Hz)')
ylabel('|P1(f)|')
获取信号的幅度和频率
信号的功率谱密度(周期图求PSD)
功率谱密度与幅度变换之间的关系
具体的步骤是:
信号S经过FFT变换,再除以N,取左半部分,即 1:N/2+1;
(1)对其进行取abs,
然后两端数值保持不变,对中间部分乘以2(因为对称性),即得到对应的幅频部分;
(2)对其进行取abs,并进行平方运算,再除以采样速率Fs,
然后两端数值保持不变,对中间部分乘以2(因为对称性),即得到对应的功率谱密度部分;
对应的频率范围为 f = Fs*(0:(L/2))/L; 即 freq = 0:Fs/length(S):Fs/2;
2.1 对2中对应的功率谱密度数值取对数,即为周期图Periodogram求PSD
%% ------------------------ %%

% 分析由原始信号 求出对应的幅度谱 功率谱 功率谱密度
% 验证自带的函数 periodogram 求功率谱 功率谱密度之间的关系
% fft 得出的未双边带的频谱 转换成对应的单边带频谱为:
% P2 = abs(Y)/L; 幅度谱估计
% P2 = abs(Y).^2/L/L; 功率谱谱估计
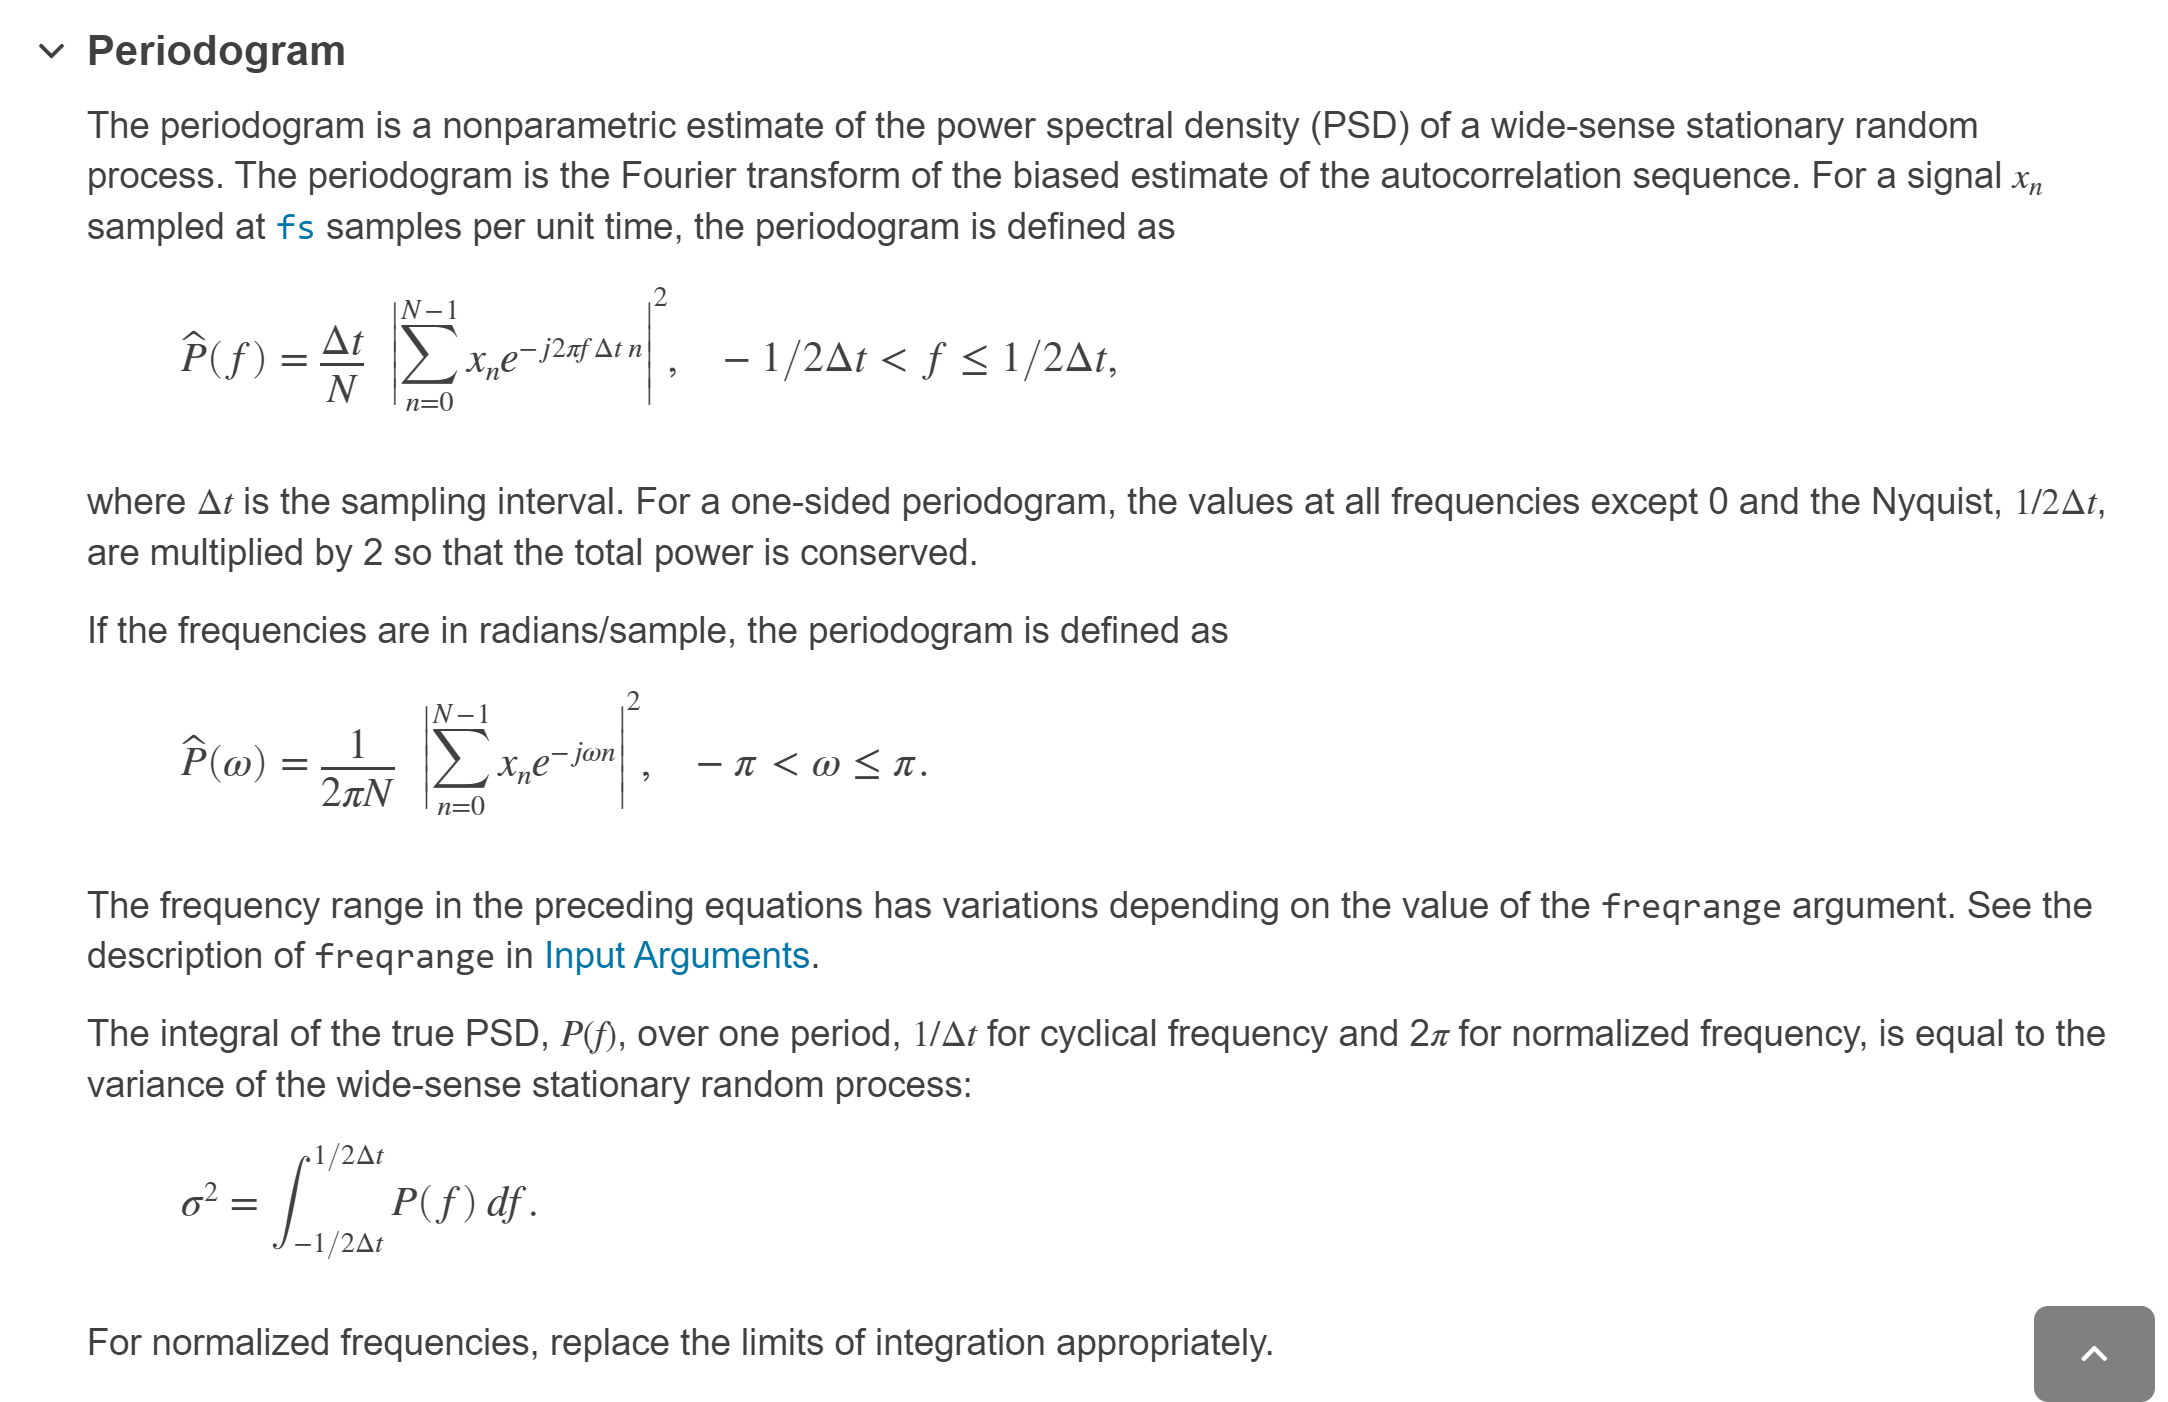
% P2 = abs(Y).^2/L/Fs;  功率谱密度估计

% P1 = P2(1:L/2+1);
% P1(2:end-1) = 2*P1(2:end-1);
% f = (0:(L/2))*Fs/L;
%
%
clc;close all;clear;
% -- 分析实例
rng default
Fs = 1000;            % Sampling frequency
T = 1/Fs;             % Sampling period
L = 1500;             % Length of signal
t = (0:L-1)'*T;        % Time vector

X= 0.7*sin(2*pi*50*t) + sin(2*pi*120*t);
% X = X+ 2*randn(size(t));
plot(1000*t(1:50),X(1:50))
title('Signal Corrupted with Zero-Mean Random Noise')
xlabel('t (milliseconds)')
ylabel('X(t)')
Y = fft(X);
% Compute the two-sided spectrum P2. Then compute the single-sided spectrum P1 based on P2 and the even-valued signal length L.


%% 求幅度谱
P2 = abs(Y)/L;
P1 = P2(1:L/2+1);
P1(2:end-1) = 2*P1(2:end-1);
% Define the frequency domain f and plot the single-sided amplitude spectrum P1. The amplitudes are not exactly at 0.7 and 1, as expected, because of the added noise. On average, longer signals produce better frequency approximations.

f = (0:(L/2))*Fs/L;
figure(2)
plot(f,P1)
title('Single-Sided Amplitude Spectrum of X(t)')
xlabel('f (Hz)')
ylabel('|P1(f)|')
%% 求功率谱
P2 = abs(Y).^2/L/L;
P1 = P2(1:L/2+1);
P1(2:end-1) = 2*P1(2:end-1);
% Define the frequency domain f and plot the single-sided amplitude spectrum P1. The amplitudes are not exactly at 0.7 and 1, as expected, because of the added noise. On average, longer signals produce better frequency approximations.

f = (0:(L/2))*Fs/L;
figure(3)
% plot(f,P1)
plot(f,10*log10(P1))

title('功率谱')
xlabel('f (Hz)')
ylabel('功率')
figure(31)
[a b]=periodogram(X,[],L,Fs,'power');
plot(b,10*log10(a))
figure(gcf)
%% 求功率谱密度
P2 = abs(Y).^2/L/Fs;
P1 = P2(1:L/2+1);
P1(2:end-1) = 2*P1(2:end-1);

f = (0:(L/2))*Fs/L;
figure(4)
plot(f,P1)
title('功率谱密度')
xlabel('f (Hz)')
figure(5)
plot(f,10*log10(P1))
title('功率谱密度')
xlabel('f(Hz)')
figure(51)
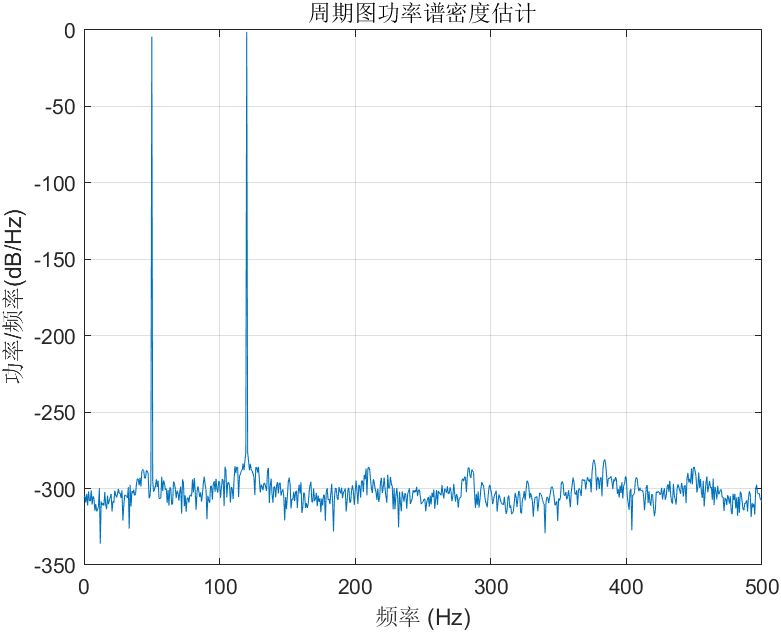
periodogram(X,[],L,Fs);figure(gcf)
% 验证双边带功率谱密度
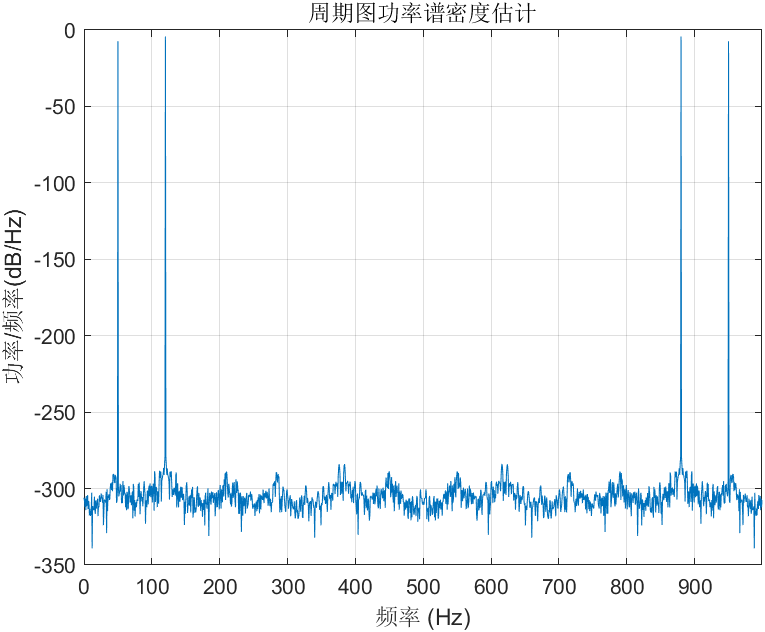
figure(52)
periodogram(X,[],L,Fs,'twosided');figure(gcf)
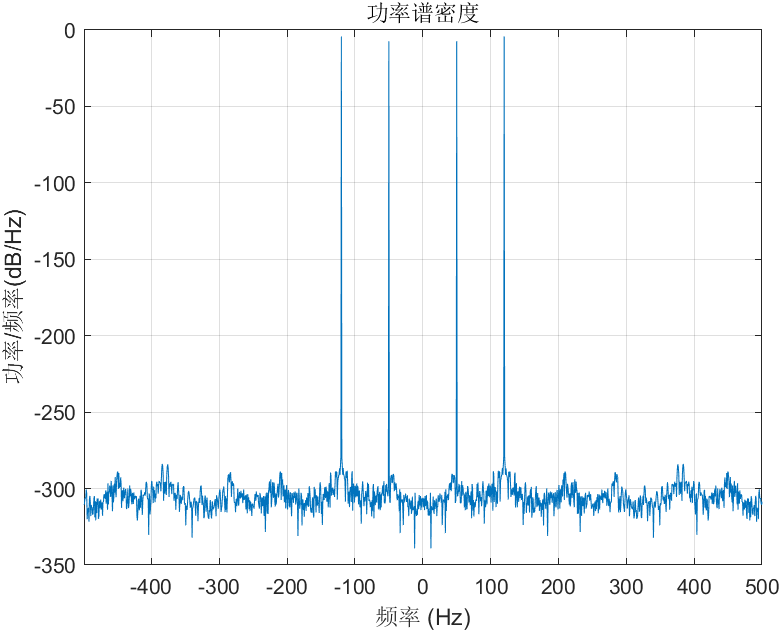
figure(53)
periodogram(X,[],L,Fs,'centered');figure(gcf)

%% dsp
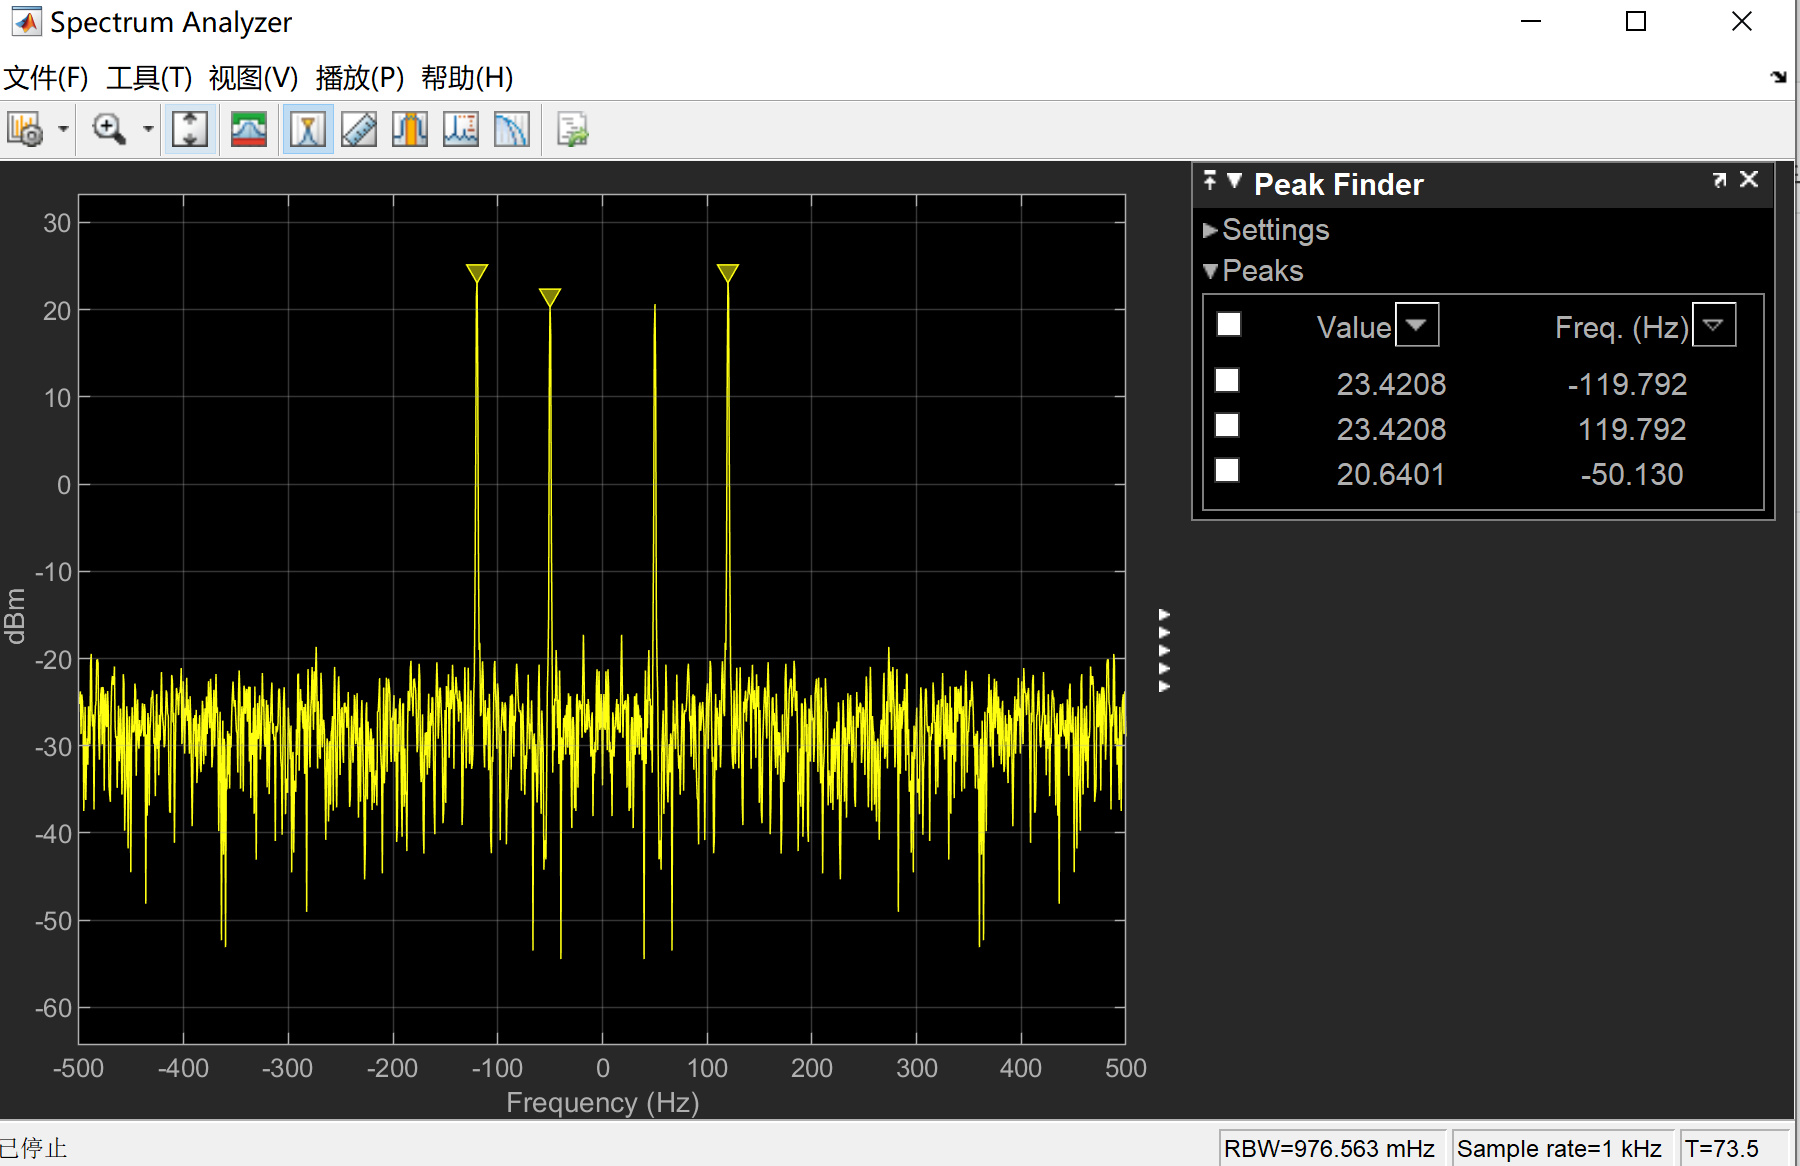
scope = dsp.SpectrumAnalyzer('SampleRate',Fs);
% scope.ViewType = 'Spectrogram';
% scope.RBWSource = 'Property';
% scope.RBW = 500;
% scope.TimeSpanSource = 'Property';
% scope.TimeSpan = 2;
% scope.PlotAsTwoSidedSpectrum = false;
scope.PlotAsTwoSidedSpectrum = true;
% X=X';
for idx = 1:50
  y = X+ 0.05*randn(size(X));
  scope(y);
end

release(scope)
(1) 单边带功率谱密度
(2)双边带功率谱密度
(3)双边带功率谱密度(平移中心)
补充:
数字角频率和模拟角频率之间的关系
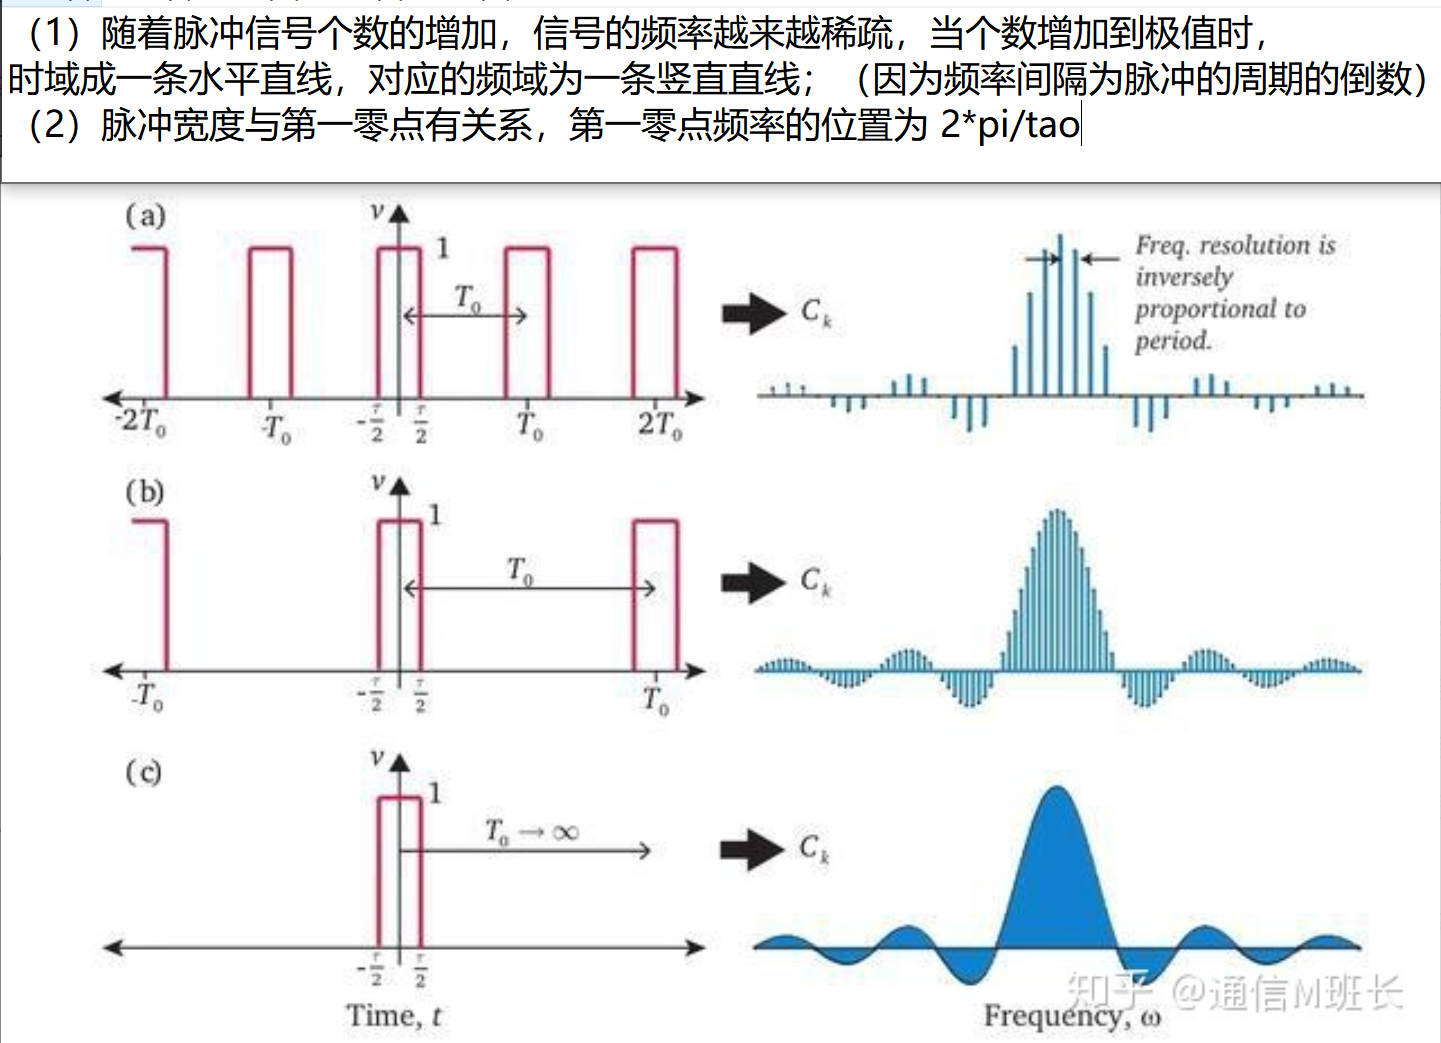
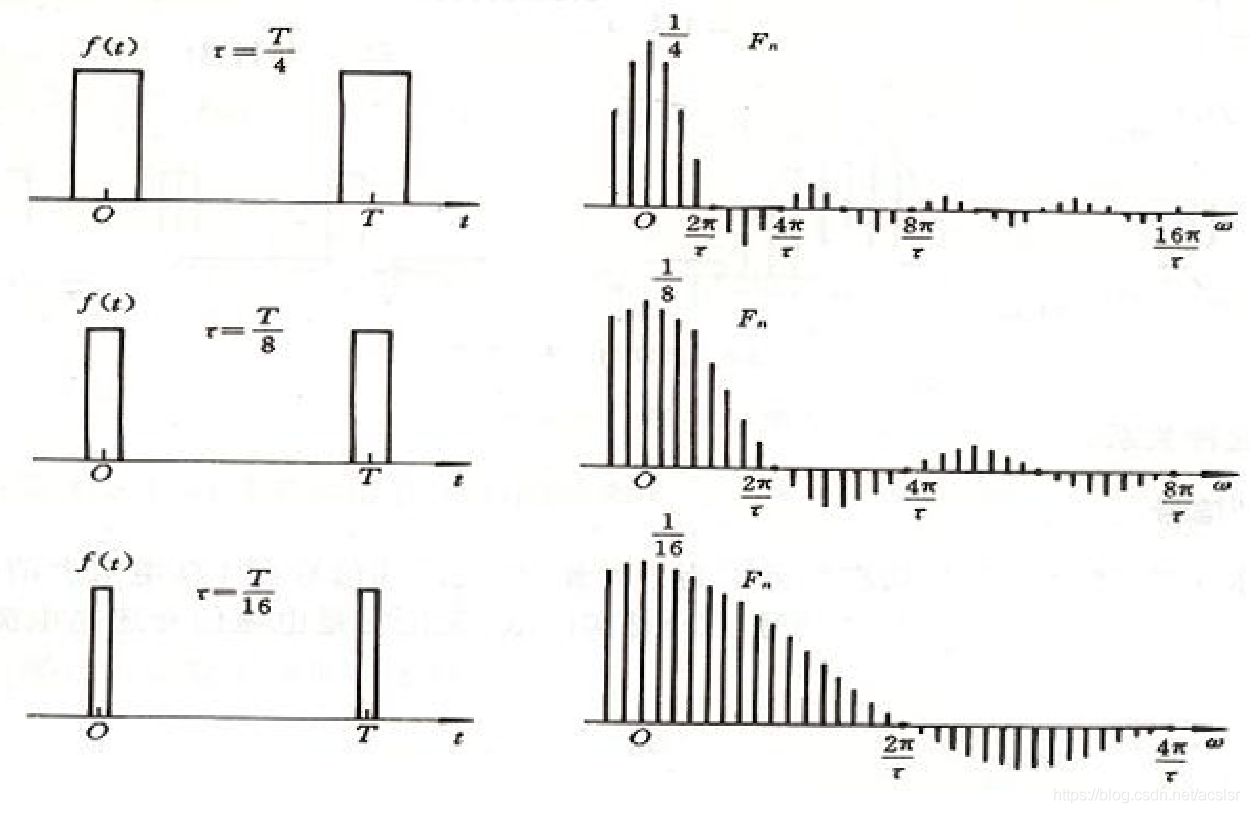
- T不变 τ减小时:普线间距不变,但每两个零点间距离增大。
- τ一定 T增大: 频谱变密,幅度减小。
由此可推出,周期无限长时,信号变为非周期信号,谱线由离散谱变为连续谱。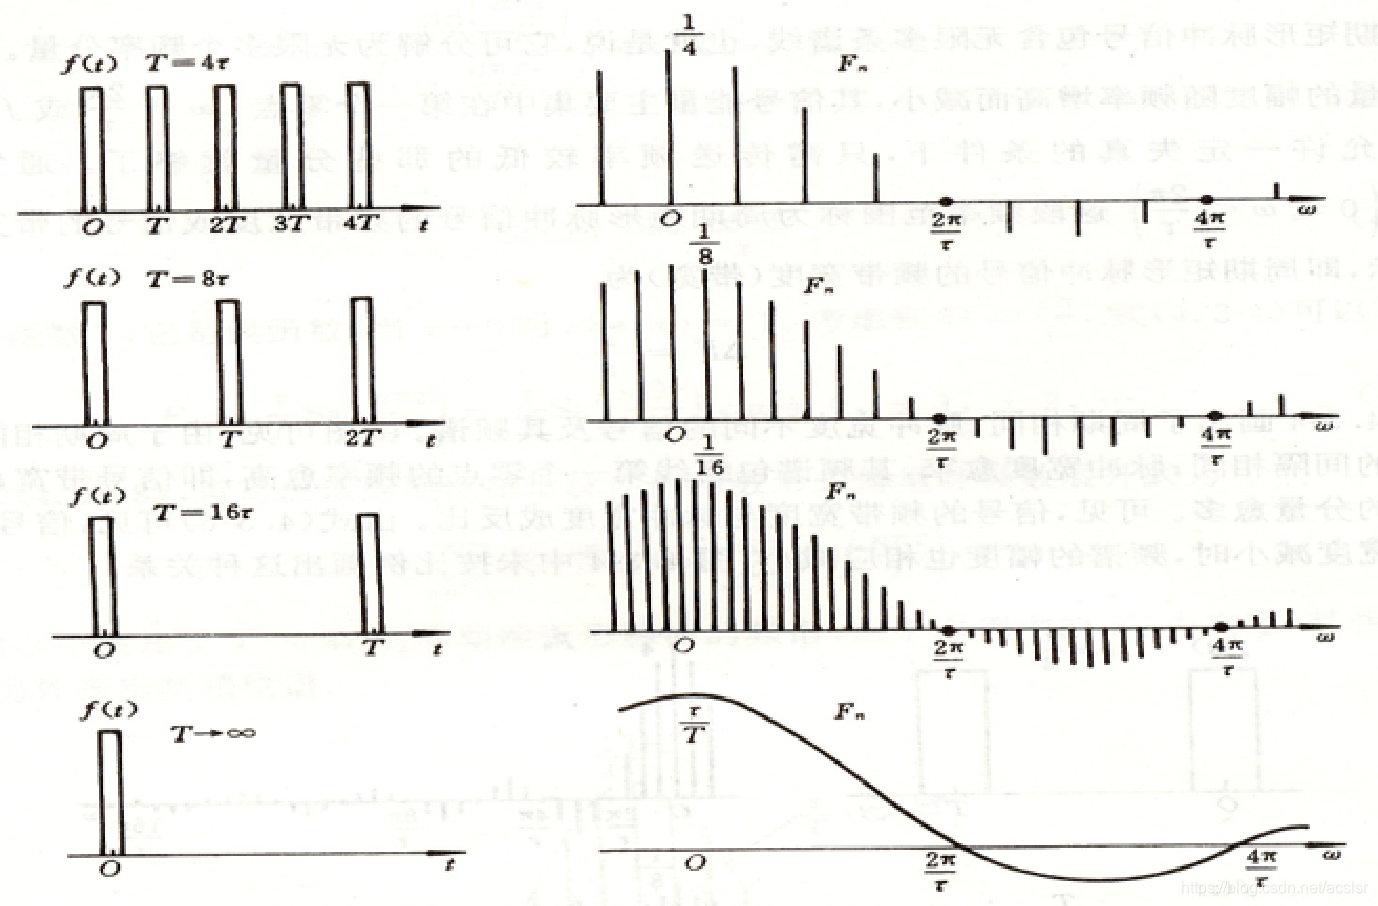
最后
以上就是懦弱巨人最近收集整理的关于利用 FFT 运算恢复原来的信号,PSD和原来信号之间的关系一、 信号建模二、 利用FFT恢复信号信号的功率谱密度(周期图求PSD)的全部内容,更多相关利用内容请搜索靠谱客的其他文章。
本图文内容来源于网友提供,作为学习参考使用,或来自网络收集整理,版权属于原作者所有。


发表评论 取消回复