% this script is used to explain the FFT function
% with the addtional <为什么要进行傅立叶变换>
%----------------------------------------------
% Part1 Amplitude |
%----------------------------------------------
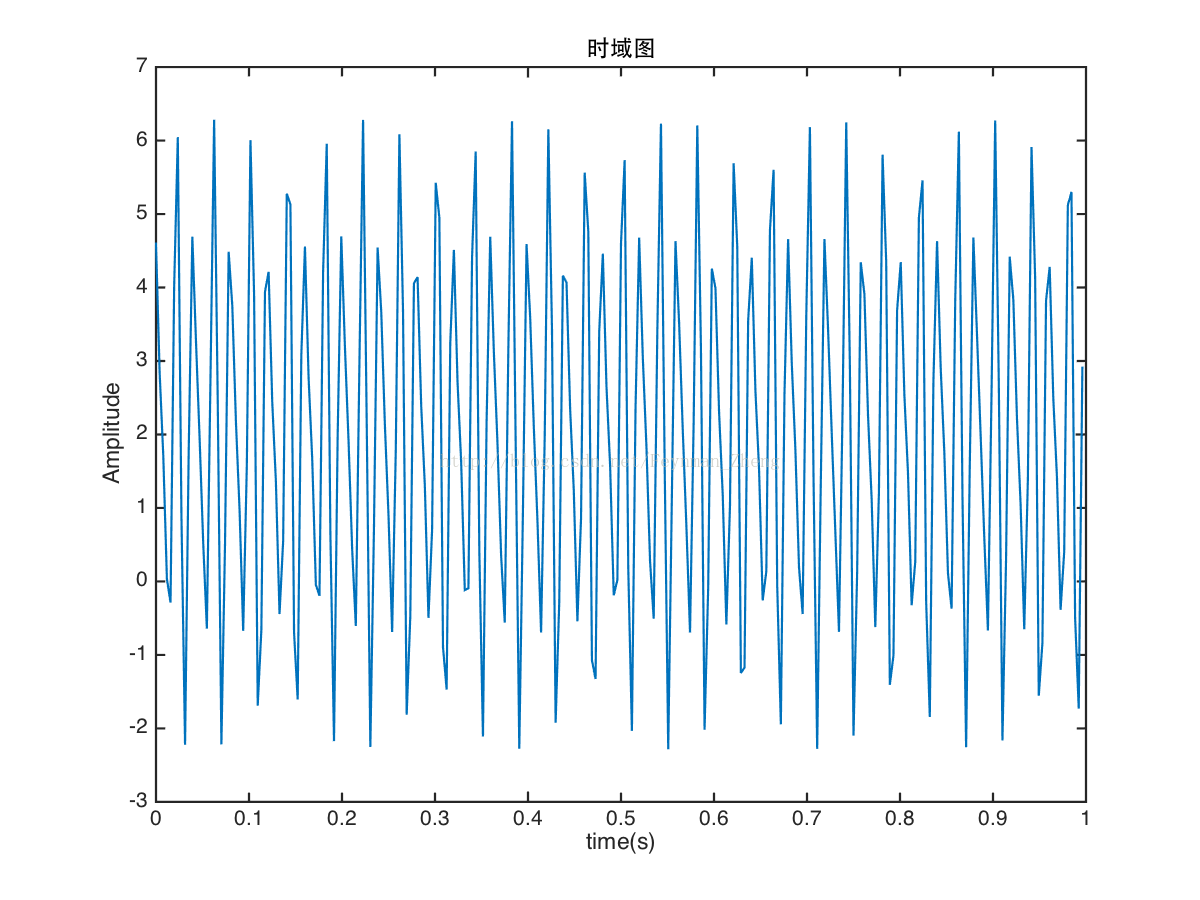
fs = 256;L =256; T=1/fs; %所以是1s的时长信号
t=(0:L-1)*T;
s=2+3*cos(2*pi*50*t-30*pi/180)+1.5*cos(2*pi*75*t+90*pi/180);
% i think the expression is clear enought to read
% what we do next is use a method to show the result
plot(t,s),xlabel('time(s)'),ylabel('Amplitude'),title('时域图');
% 时域图
complexAmplitude = fft(s);
fftA = abs(complexAmplitude);
fftA = fftA(1:L/2+1);
f = fs/2*linspace(0,1,L/2+1); % 上面两行都是到(L/2+1)
% linspeace(0,1,L)的作用: L个点把1等分成(L-1)段
%=========linspace的替代写法=================
% Fs = 1;
% Nf = 512;
% df = Fs/Nf;
% f = 0:df:Fs/2-df;
%----------------------
figure
plot(f,fftA),xlabel('frequency'),ylabel('fftAmplitude'),title('未归一化');
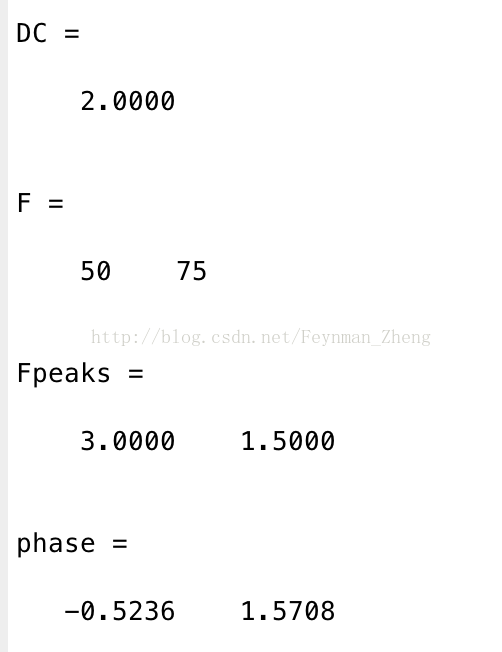
DC = fftA(1)/L;
AC = fftA(2:L/2+1)/L*2;
% 幅度的归一话
% 对于直流,真实幅度*N对应FFT幅度
% 对于交流,真实幅度*N/2对应FFT幅度
realA =[DC,AC];
figure
plot(f,realA),xlabel('frequency'),ylabel('realAmplitude'),ylim([0,max(realA)+1]),
title('归一化'),hold on;;
%=======以上为幅度的计算==========
[Fpeaks,Findex] =findpeaks(realA,'MinPeakHeight',0.01); %findpeaks有一系列选项,可以筛选data
F = Findex-1;
plot(F,Fpeaks,'r^','markerfacecolor',[1 0 0]); %用于标记峰值点
%====
%plot(f,realA,F,Fpeaks,'r^','markerfacecolor',[1 0 0]) 干脆点,一起画得了
%=-===========
plot(0,DC,'rh','markerfacecolor',[1 0 0]) ; %用于标记直流分量
%========== LineSpec ,ylim 画图时的技巧==========
legend('频率成分','幅度','Location','northWest')
% 我想把基波的频率在X轴上面显示出来,但是有些困难。暂时不搞啦。
%----------------------------------------------
% Part2 phase |
%----------------------------------------------
rawphase=complexAmplitude(Findex)
phase = angle(rawphase)
DC,F,Fpeaks,phase
% save the picture
for k = 1:3 figure(k); temp=['fig',num2str(k),'.png']; saveas(gca,temp); end
----------------------------------以下为过程中的三幅图------------------


最后
以上就是清脆网络最近收集整理的关于FFT的幅度和相位的全部内容,更多相关FFT内容请搜索靠谱客的其他文章。
本图文内容来源于网友提供,作为学习参考使用,或来自网络收集整理,版权属于原作者所有。


发表评论 取消回复