Matlab产生离散信号
常见离散信号
冲击信号
n = -5:5;
x = n == 0;% 当n为0时,x的值为1
stem(n, x, 'filled');
axis([-5 5 0 1.1*max(x)]);%规定坐标轴的范围
xlabel('时间(n)');ylabel('幅度(n)');
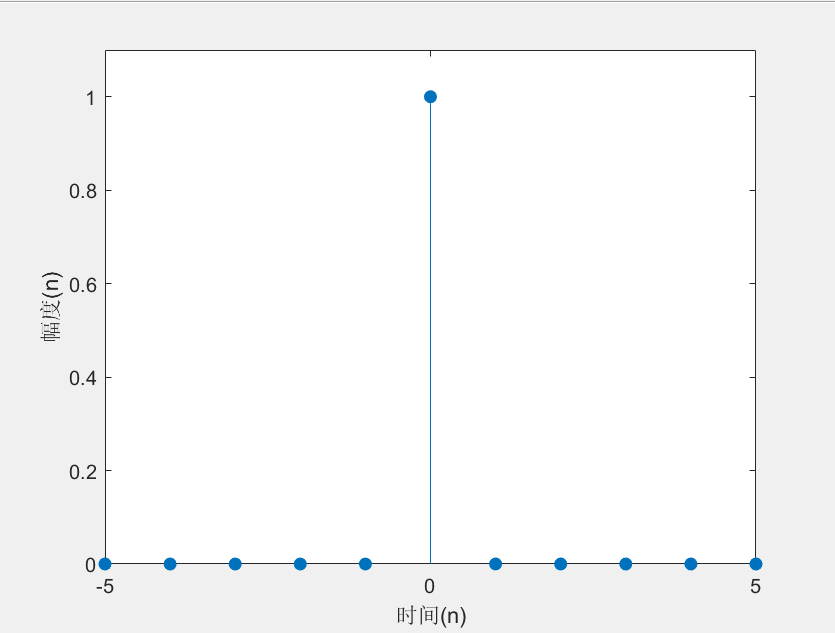
冲击信号
阶跃信号
n = -2:8;
x = n >= 0; % 当n大于等与零时,其值为1
stem(n, x, 'filled');
axis([-4, 4, 0, 1.1*max(x)]);
title('阶跃信号');
xlabel('时间(n)');ylabel('幅度(n)');
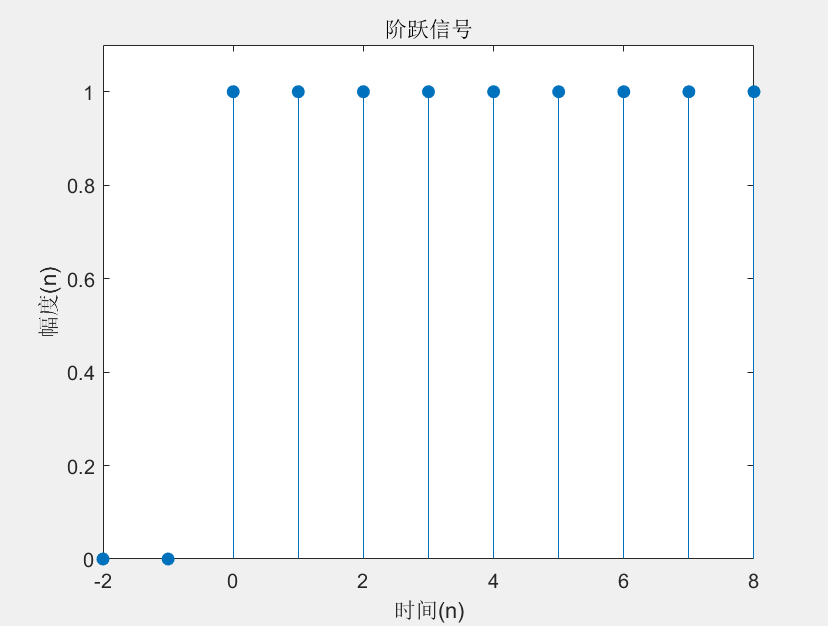
阶跃信号
实指数序列
n1=-10; n2=10;
a1=0.5; a2=2;
na1=n1:0;
x1 = a1.^na1;
na2 = 0:n2;
x2 = a2.^na2;
subplot(2,2,1);
plot(na1,x1);
title('实指数原信号(a<1)');
subplot(2,2,3);
stem(na1,x1,'filled');
title('实指数序列(a<1)');
subplot(2,2,2);
plot(na2,x2);
title('实指数原信号(a>1)');
subplot(2,2,4);
stem(na2,x2,'filled');
title('实指数序列(a>1)');
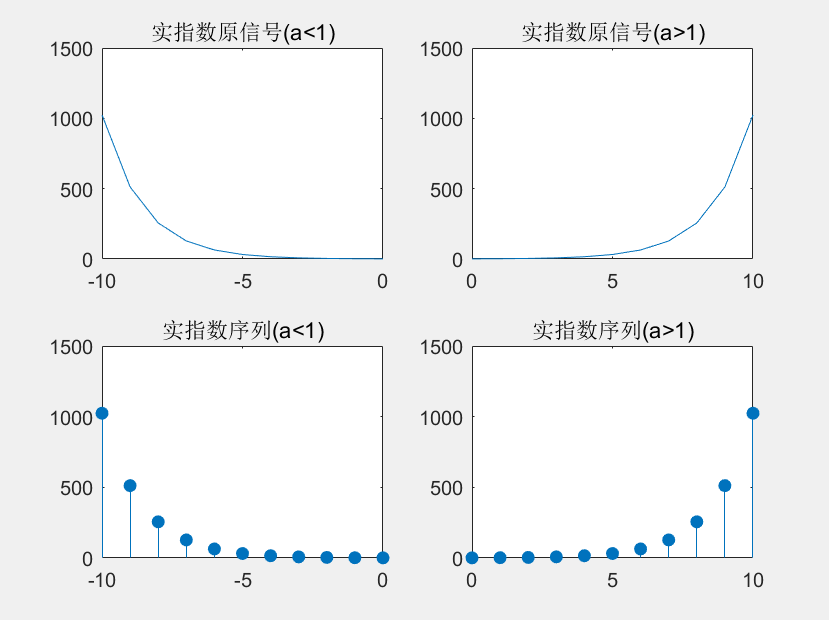
实数序列
复指数序列
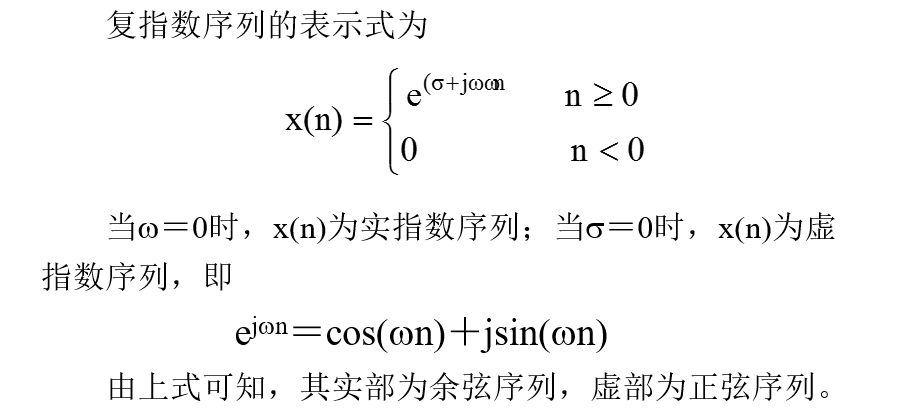
n = -10:0.2:10;
x = exp((-0.2+1j*0.6*pi)*n);
subplot(2,2,1), plot(n, real(x));% real画出实部
subplot(2,2,3), stem(n, real(x), 'filled');
subplot(2,2,2), plot(n, imag(x)); % imag画出虚部
subplot(2,2,4), stem(n, imag(x), 'filled');
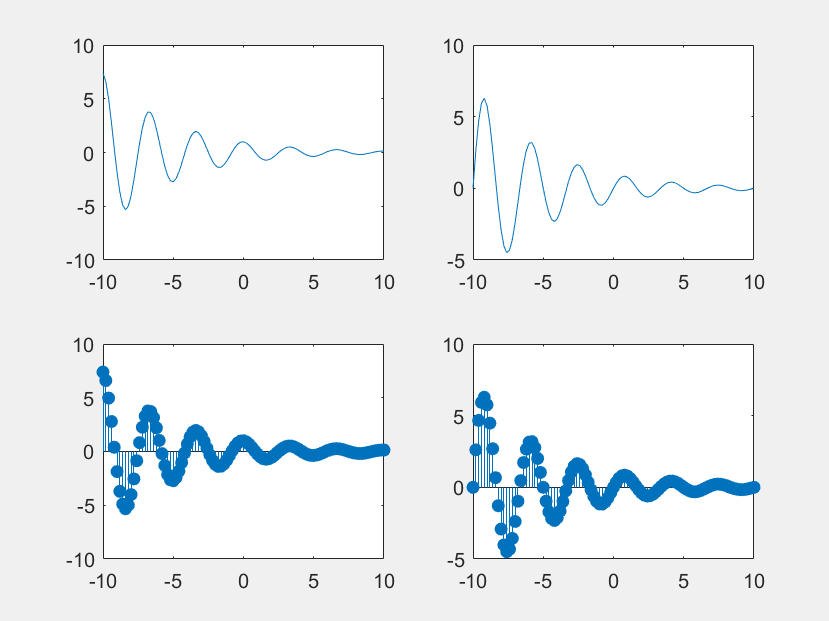
复指数信号
随机信号
tn=0:0.2:15;
N=length(tn);
x=rand(1,N);
subplot(2,1,1);
plot(tn,x);

tn=0:0.5:15;
N=length(tn);
y=rand(1,N);
subplot(2,1,2);
stem(tn,y);
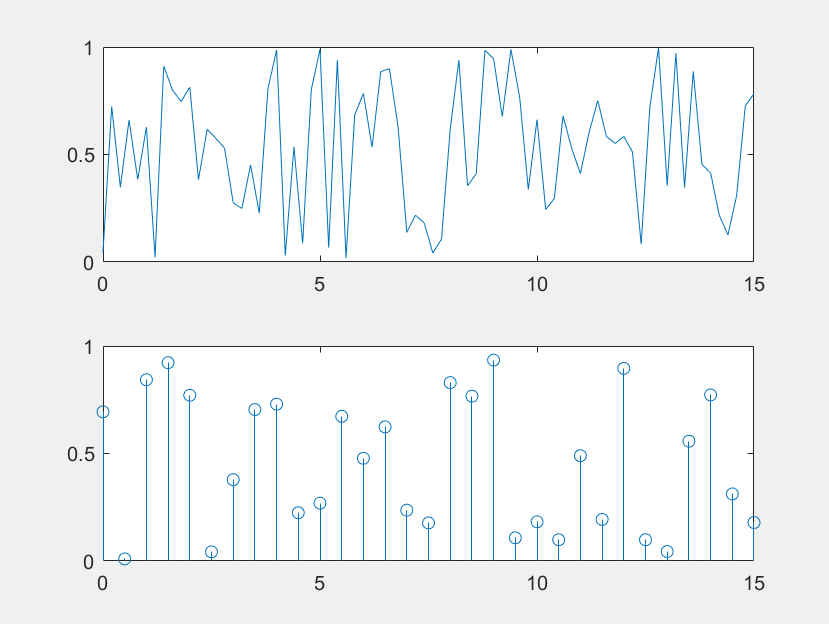
随机信号
转载于:https://www.cnblogs.com/Vincent-Bryan/p/6566652.html
最后
以上就是优美航空最近收集整理的关于MATLAB产生离散信号Matlab产生离散信号的全部内容,更多相关MATLAB产生离散信号Matlab产生离散信号内容请搜索靠谱客的其他文章。
本图文内容来源于网友提供,作为学习参考使用,或来自网络收集整理,版权属于原作者所有。


发表评论 取消回复