该网址包含 Indian_pines, Salinas, Pavia Centre and University, Cuprite, Kennedy Space Center, Botswana等常用高光谱数据及其标签,数据格式为mat
网址链接:Hyperspectral Remote Sensing Scenes
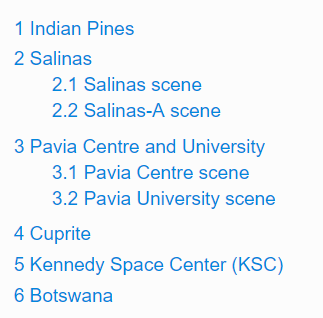
数据目录
————————————————
版权声明:本文为CSDN博主「wild kindom」的原创文章,遵循 CC 4.0 BY-SA 版权协议,转载请附上原文出处链接及本声明。
原文链接:https://blog.csdn.net/weixin_39393430/article/details/88640908
摘自《基于深度卷积神经网络的高光谱图像分类》徐敏
1.Indian Pines 数据集
Indian Pines 是最早的用于高光谱图像分类的测试数据,由机载可视红外成像光谱仪(AVIRIS)于 1992 年对美国印第安纳州一块印度松树进行成像,然后截取尺寸为 145×145 的大小进行标注作为高光谱图像分类测试用途。
AVIRIS 成像光谱仪成像波长范围为 0.4-2.5μm,是在连续的 220 个波段对地物连续成像的,但是由于第 104-108,第 150-163 和第 220 个波段不能被水反射,因此,我们一般使用的是剔除了这 20 个波段后剩下的 200 个波段作为研究的对象。
该光谱成像仪所成的图像的空间分辨率约为 20m,因此,其较容易产生混合像元,给分类带来难度。
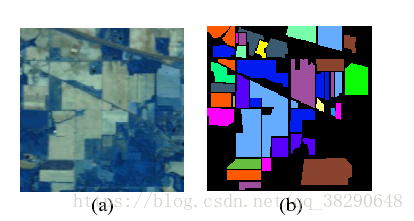
图 2.1(a)是抽取其中 3 个波段的二维矩阵叠加作为 RGB 图像三个通道所成的伪彩色图像。该数据总共有 21025个像素,但是其中只有 10249 个像素是地物像素,其余 10776 个像素均为背景像素,在实际分类中,这些像素是需要剔除的,由于截取的这块区域均是庄稼,总共有 16类,因此不同的地物具有较为相似的光谱曲线,而且这 16 类中,样本的分布极不均匀
145*145=21025=10776(背景,黑)+10249(多种地物,彩) 10249=各类地物占得像素个数。
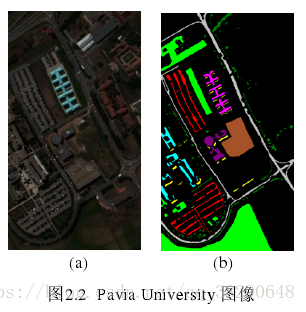
2.Pavia University 数据集
Pavia University 数据是由德国的机载反射光学光谱成像仪(Reflective Optics Spectrographic Imaging System,ROSIS-03)在 2003 年对意大利的帕维亚城所成的像的一部分高光谱数据。该光谱成像仪对 0.43-0.86μm 波长范围内的 115 个波段连续成像,所成图像的空间分辨率为 1.3m。其中 12 个波段由于受噪声影响被剔除,因此一般使用的是剩下 103 个光谱波段所成的图像。该数据的尺寸为 610×340,因此共包含2207400 个像素,但是其中包含大量的背景像素,包含地物的像素总共只有 42776 个,这些像素中共包含 9 类地物,包括树、沥青道路(Asphalt)、砖块(Bricks)、牧场(Meadows)等。
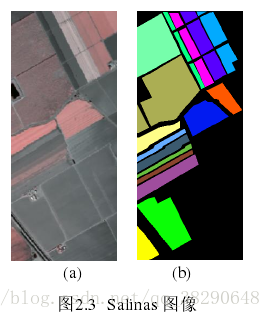
3.Salinas数据集
同 Indian Pines 图像一样,Salinas 数据也是由 AVIRIS 成像光谱仪所拍摄的,它是对美国加利福尼亚州的 Salinas 山谷所成的像。同 Indian Pines 不同的是,它的空间分辨率达到了 3.7m。该图像原本也有 224 个波段,同样的,我们一般使用的也是剔除了第 108-112,154-167,和第 224 个不能被水反射的波段后剩下的 204 个波段的图像。该图像的尺寸为 512×217,因此共包含 111104 个像素,其中有 56975 个像素是背景像素,可应用于分类的像素有 54129 个,这些像素总共分为 16 类,包括休耕地(Fallow)、芹菜(Celery)等。
Hyperspectral Remote Sensing Scenes
Espacios de nombres
- Página
- Discusión
Acciones de página
- Ver
- Historial
Here you can find information over some public available hyperspectral scenes. All of then are Earth Observation images taken from airbornes or satellites.
You can find more information about hyperspectral sensors and remote sensing here.
Contenido
[ocultar]
- 1 Indian Pines
- 2 Salinas
- 2.1 Salinas scene
- 2.2 Salinas-A scene
- 3 Pavia Centre and University
- 3.1 Pavia Centre scene
- 3.2 Pavia University scene
- 4 Cuprite
- 5 Kennedy Space Center (KSC)
- 6 Botswana
Indian Pines
This scene was gathered by AVIRIS sensor over the Indian Pines test site in North-western Indiana and consists of 145times145 pixels and 224 spectral reflectance bands in the wavelength range 0.4–2.5 10^(-6) meters. This scene is a subset of a larger one. The Indian Pines scene contains two-thirds agriculture, and one-third forest or other natural perennial vegetation. There are two major dual lane highways, a rail line, as well as some low density housing, other built structures, and smaller roads. Since the scene is taken in June some of the crops present, corn, soybeans, are in early stages of growth with less than 5% coverage. The ground truth available is designated into sixteen classes and is not all mutually exclusive. We have also reduced the number of bands to 200 by removing bands covering the region of water absorption: [104-108], [150-163], 220. Indian Pines data are available through Pursue's univeristy MultiSpec site.
- Download MATLAB data files: Indian Pines (6.0 MB) | corrected Indian Pines (5.7 MB) | Indian Pines groundtruth (1.1 KB)
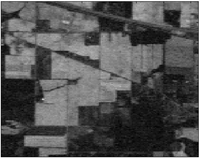
Sample band of Indian Pines dataset
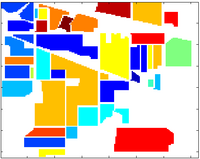
Groundtruth of Indian Pines dataset
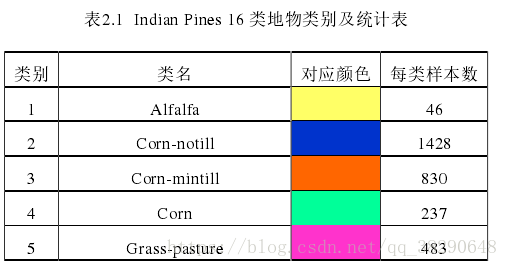
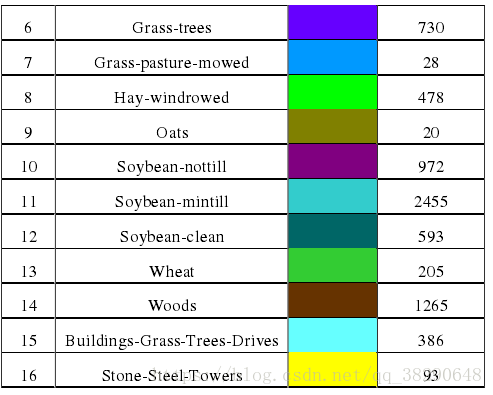
| Groundtruth classes for the Indian Pines scene and their respective samples number | ||
|---|---|---|
| # | Class | Samples |
| 1 | Alfalfa | 46 |
| 2 | Corn-notill | 1428 |
| 3 | Corn-mintill | 830 |
| 4 | Corn | 237 |
| 5 | Grass-pasture | 483 |
| 6 | Grass-trees | 730 |
| 7 | Grass-pasture-mowed | 28 |
| 8 | Hay-windrowed | 478 |
| 9 | Oats | 20 |
| 10 | Soybean-notill | 972 |
| 11 | Soybean-mintill | 2455 |
| 12 | Soybean-clean | 593 |
| 13 | Wheat | 205 |
| 14 | Woods | 1265 |
| 15 | Buildings-Grass-Trees-Drives | 386 |
| 16 | Stone-Steel-Towers | 93 |
Salinas
Salinas scene
This scene was collected by the 224-band AVIRIS sensor over Salinas Valley, California, and is characterized by high spatial resolution (3.7-meter pixels). The area covered comprises 512 lines by 217 samples. As with Indian Pines scene, we discarded the 20 water absorption bands, in this case bands: [108-112], [154-167], 224. This image was available only as at-sensor radiance data. It includes vegetables, bare soils, and vineyard fields. Salinas groundtruth contains 16 classes.
- Download MATLAB data files: Salinas (26.3 MB) | corrected Salinas (25.3 MB) | Salinas groundtruth (4.2 KB)
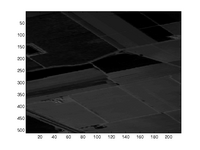
Sample band of Salinas dataset
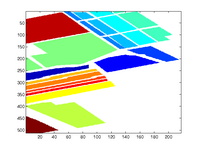
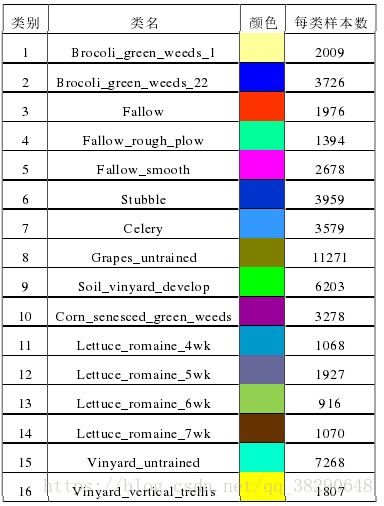
Groundtruth of Salinas dataset
| Groundtruth classes for the Salinas scene and their respective samples number | ||
|---|---|---|
| # | Class | Samples |
| 1 | Brocoli_green_weeds_1 | 2009 |
| 2 | Brocoli_green_weeds_2 | 3726 |
| 3 | Fallow | 1976 |
| 4 | Fallow_rough_plow | 1394 |
| 5 | Fallow_smooth | 2678 |
| 6 | Stubble | 3959 |
| 7 | Celery | 3579 |
| 8 | Grapes_untrained | 11271 |
| 9 | Soil_vinyard_develop | 6203 |
| 10 | Corn_senesced_green_weeds | 3278 |
| 11 | Lettuce_romaine_4wk | 1068 |
| 12 | Lettuce_romaine_5wk | 1927 |
| 13 | Lettuce_romaine_6wk | 916 |
| 14 | Lettuce_romaine_7wk | 1070 |
| 15 | Vinyard_untrained | 7268 |
| 16 | Vinyard_vertical_trellis | 1807 |
Salinas-A scene
An small subscene of Salinas image, denoted Salinas-A, is usually used too. It comprises 86*83 pixels located within the same scene at [samples, lines] = [591-676, 158-240] and includes six classes.
- Download MATLAB data files: Salinas-A (1.5 MB) | corrected Salinas-A (1.5 MB) | Salinas-A groundtruth (587 Bytes)
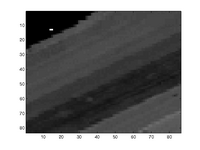
Sample band of Salinas-A dataset
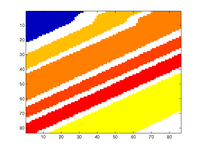
Groundtruth of Salinas-A dataset
| Groundtruth classes for the Salinas-A scene and their respective samples number | ||
|---|---|---|
| # | Class | Samples |
| 1 | Brocoli_green_weeds_1 | 391 |
| 2 | Corn_senesced_green_weeds | 1343 |
| 3 | Lettuce_romaine_4wk | 616 |
| 4 | Lettuce_romaine_5wk | 1525 |
| 5 | Lettuce_romaine_6wk | 674 |
| 6 | Lettuce_romaine_7wk | 799 |
Pavia Centre and University
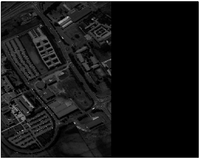
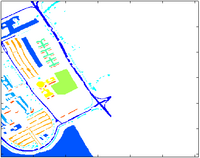
These are two scenes acquired by the ROSIS sensor during a flight campaign over Pavia, nothern Italy. The number of spectral bands is 102 for Pavia Centre and 103 for Pavia University. Pavia Centre is a 1096*1096 pixels image, and Pavia University is 610*610 pixels, but some of the samples in both images contain no information and have to be discarded before the analysis. The geometric resolution is 1.3 meters. Both image groundtruths differenciate 9 classes each. It can be seen the discarded samples in the figures as abroad black strips.
Pavia scenes were provided by Prof. Paolo Gamba from the Telecommunications and Remote Sensing Laboratory, Pavia university (Italy).
Pavia Centre scene
- Download MATLAB data files: Pavia Centre (123.6 MB) | Pavia Centre groundtruth (34.1 KB)
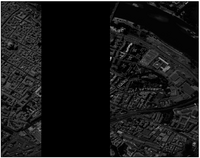
Sample band of Pavia Centre dataset
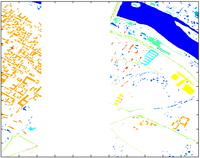
Groundtruth of Pavia Centre dataset
| Groundtruth classes for the Pavia centre scene and their respective samples number | ||
|---|---|---|
| # | Class | Samples |
| 1 | Water | 824 |
| 2 | Trees | 820 |
| 3 | Asphalt | 816 |
| 4 | Self-Blocking Bricks | 808 |
| 5 | Bitumen | 808 |
| 6 | Tiles | 1260 |
| 7 | Shadows | 476 |
| 8 | Meadows | 824 |
| 9 | Bare Soil | 820 |
Pavia University scene
- Download MATLAB data files: Pavia University (33.2 MB) | Pavia University groundtruth (10.7 KB)
Sample band of Pavia University dataset
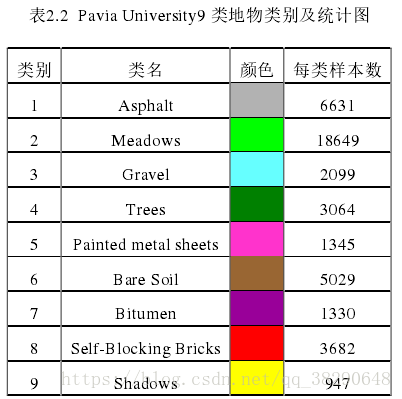
Groundtruth of Pavia University dataset
| Groundtruth classes for the Pavia University scene and their respective samples number | ||
|---|---|---|
| # | Class | Samples |
| 1 | Asphalt | 6631 |
| 2 | Meadows | 18649 |
| 3 | Gravel | 2099 |
| 4 | Trees | 3064 |
| 5 | Painted metal sheets | 1345 |
| 6 | Bare Soil | 5029 |
| 7 | Bitumen | 1330 |
| 8 | Self-Blocking Bricks | 3682 |
| 9 | Shadows | 947 |
Cuprite
This data sets can be retrieved from AVIRIS NASA site. Among the many datasets available, the .mat archive posted here corresponds to the f970619t01p02_r02_sc03.a.rfl reflectance file.
- Download MATLAB data file: Cuprite (95.3 MB)
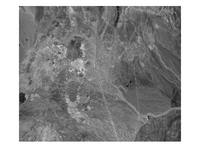
False greyscale image of Cuprite sample.
Kennedy Space Center (KSC)
The NASA AVIRIS (Airborne Visible/Infrared Imaging Spectrometer) instrument acquired data over the Kennedy Space Center (KSC), Florida, on March 23, 1996. AVIRIS acquires data in 224 bands of 10 nm width with center wavelengths from 400 - 2500 nm. The KSC data, acquired from an altitude of approximately 20 km, have a spatial resolution of 18 m. After removing water absorption and low SNR bands, 176 bands were used for the analysis. Training data were selected using land cover maps derived from color infrared photography provided by the Kennedy Space Center and Landsat Thematic Mapper (TM) imagery. The vegetation classification scheme was developed by KSC personnel in an effort to define functional types that are discernable at the spatial resolution of Landsat and these AVIRIS data. Discrimination of land cover for this environment is difficult due to the similarity of spectral signatures for certain vegetation types. For classification purposes, 13 classes representing the various land cover types that occur in this environment were defined for the site.
- Take a fast look to the data! [1]
- Download MATLAB data file: Kennedy Space Center (KSC) (56.8 MB)
- Download MATLAB ground truth file: KSC gt (3.2 kB)
Botswana
The NASA EO-1 satellite acquired a sequence of data over the Okavango Delta, Botswana in 2001-2004. The Hyperion sensor on EO-1 acquires data at 30 m pixel resolution over a 7.7 km strip in 242 bands covering the 400-2500 nm portion of the spectrum in 10 nm windows. Preprocessing of the data was performed by the UT Center for Space Research to mitigate the effects of bad detectors, inter-detector miscalibration, and intermittent anomalies. Uncalibrated and noisy bands that cover water absorption features were removed, and the remaining 145 bands were included as candidate features: [10-55, 82-97, 102-119, 134-164, 187-220]. The data analyzed in this study, acquired May 31, 2001, consist of observations from 14 identified classes representing the land cover types in seasonal swamps, occasional swamps, and drier woodlands located in the distal portion of the Delta.
- Take a fast look to the data! [2]
- Download MATLAB data file: Botswana (78.9 MB)
- Download MATLAB ground truth file: Botswana gt (4.0 kB)
最后
以上就是有魅力书本最近收集整理的关于高光谱数据集Hyperspectral Remote Sensing Scenes的全部内容,更多相关高光谱数据集Hyperspectral内容请搜索靠谱客的其他文章。


发表评论 取消回复