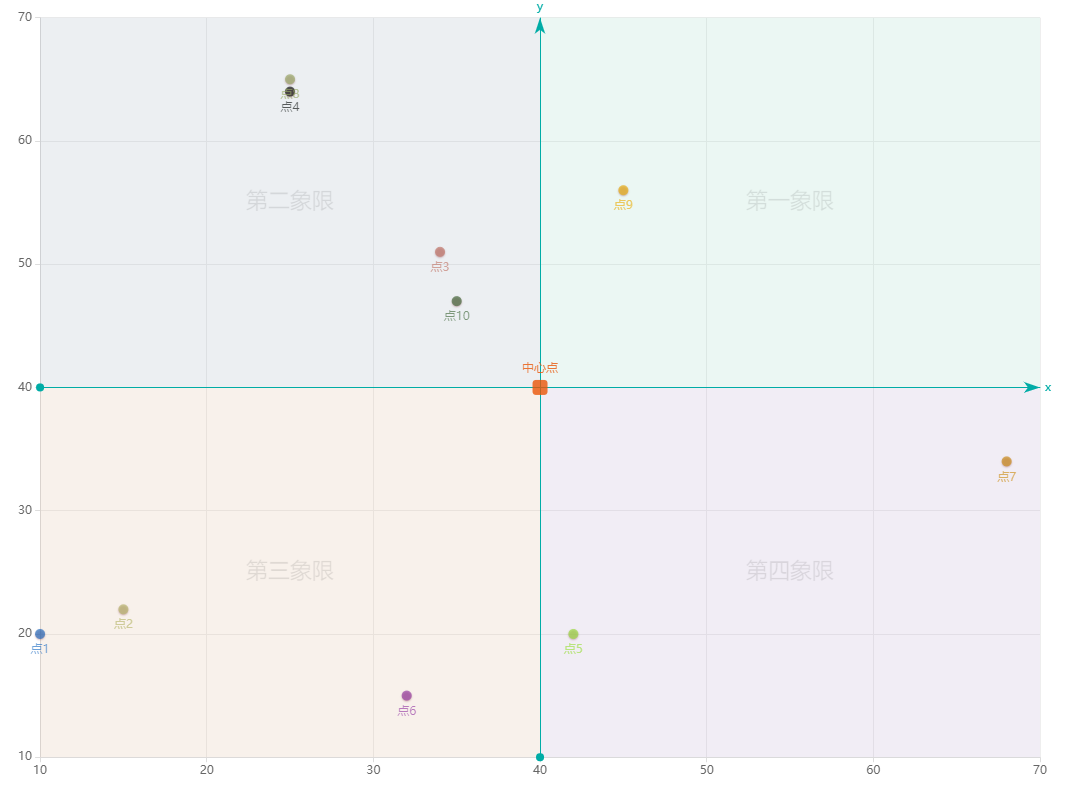
Echarts散点象限图
// 散点数据
const marksData = [
    {
        name: '点1',
        value: [10, 20],
    },
    {
        name: '点2',
        value: [15, 22],
    },
    {
        name: '点3',
        value: [34, 51],
    },
    {
        name: '点4',
        value: [25, 64],
    },
    {
        name: '点5',
        value: [42, 20],
    },
    {
        name: '点6',
        value: [32, 15],
    },
    {
        name: '点7',
        value: [68, 34],
    },
    {
        name: '点8',
        value: [25, 65],
    },
    {
        name: '点9',
        value: [45, 56],
    },
    {
        name: '点10',
        value: [35, 47],
    }
]
// 中心线
const centerLine = [
    {
        name: 'y', xAxis: 40
    },
    {
        name: 'x', yAxis: 40
    }
]
// 中心点
const centerMark = [
    {
        value: '中心点', coord: [40, 40]
    }
]

const option = {
    tooltip: {
        axisPointer: {
            show: true,
            type: 'cross',
            lineStyle: {
                type: 'dashed',
                width: 1
            },
            label: {
                backgroundColor: '#555'
            }
        }
    },
    grid: {
        left: 50,
        right: 50,
        bottom: '4%',
        top: '6%',
        containLabel: true
    },
    xAxis: {
        scale: true,
        axisLine: {
            lineStyle: {
                color: '#ddd'
            }
        },
        axisLabel: {
            color: '#666'
        },
        splitLine: {
            lineStyle: {
                color: '#eee'
            }
        }
    },
    yAxis: {
        scale: true,
        axisLine: {
            lineStyle: {
                color: '#ddd'
            }
        },
        axisLabel: {
            color: '#666'
        },
        splitLine: {
            lineStyle: {
                color: '#eee'
            }
        }
    },
    series: [{
        type: 'scatter',
        data: marksData,
        label: {
            show: true,
            position: 'bottom',
            formatter: '{b}'
        },
        itemStyle: {
            shadowBlur: 2,
            shadowColor: 'rgba(120, 36, 50, 0.5)',
            shadowOffsetY: 1,
            color: function (e) {
                let randomColor = 'rgba(' + Math.floor(Math.random() * 240) + ',' + Math.floor(Math.random() * 240) + ',' + Math.floor(Math.random() * 240) + ',' + '.8' + ')'
                return randomColor.substring()
            }
        },
        // 各象限区域,需要结合中心线的位置来画出四个象限的markArea
        markArea: {
            silent: true,
            data: [
                // 第一象限
                [{
                	// 标域左上角的数据,也就是要设置矩形左边和上边的值
                    name: '第一象限',
                    xAxis: 40, // x 轴开始位置(中心线的值)
                    yAxis: 70, // y 轴结束位置(y轴最大值)
                    itemStyle: {
                        color: 'rgba(56, 180, 139, .1)'
                    },
                    label: {
                        position: 'inside',
                        color: 'rgba(0, 0, 0, .1)',
                        fontSize: 22
                    }
                }, {
                    // 标域右下角的数据,矩形域右边和下边的值
                    yAxis: 40 // y 轴开始位置(中心线的值)
                }],
                // 第二象限
                [{
                    name: '第二象限',
                    yAxis: 70, // y 轴结束位置(取y轴最大值)
                    itemStyle: {
                        color: 'rgba(68, 97, 123, .1)'
                    },
                    label: {
                        position: 'inside',
                        color: 'rgba(0, 0, 0, .1)',
                        fontSize: 22
                    }
                }, {
                    xAxis: 40, // x 轴结束位置(中心线位置)
                    yAxis: 40 // y 轴开始位置(中心线位置)
                }],
                // 第三象限
                [{
                    name: '第三象限',
                    yAxis: 40, // y 轴结束位置(中心线位置)
                    itemStyle: {
                        color: 'rgba(191, 120, 58, .1)'
                    },
                    label: {
                        position: 'inside',
                        color: 'rgba(0, 0, 0, .1)',
                        fontSize: 22
                    }
                }, {
                    xAxis: 40, // x 轴结束位置(中心线位置)
                    yAxis: 10 // y 轴开始位置(y轴最小值)
                }],
                // 第四象限
                [{
                    name: '第四象限',
                    xAxis: 40, // x 轴开始位置(中心线位置)
                    yAxis: 40, // y 轴结束位置(中心线位置)
                    itemStyle: {
                        color: 'rgba(116, 83, 153, .1)'
                    },
                    label: {
                        position: 'inside',
                        color: 'rgba(0, 0, 0, .1)',
                        fontSize: 22
                    }
                }, {
                    yAxis: 10 // y轴开始位置(y轴最小值)
                }]
            ]
        },
        // 中心点交集象限轴
        markLine: {
            silent: true, // 是否不响应鼠标事件
            precision: 2, // 精度
            lineStyle: {
                type: 'solid',
                color: '#00aca6'
            },
            label: {
                color: '#00aca6',
                position: 'end',
                formatter: '{b}'
            },
            data: centerLine
        },
        // 中心点
        markPoint: {
            symbol: 'roundRect',
            symbolSize: 15,
            itemStyle: {
                color: 'rgba(234, 85, 6, .8)'
            },
            label: {
                position: 'top'
            },
            data: centerMark
        }
    }]
}
最后
以上就是活力眼神最近收集整理的关于Echarts散点象限图的全部内容,更多相关Echarts散点象限图内容请搜索靠谱客的其他文章。
本图文内容来源于网友提供,作为学习参考使用,或来自网络收集整理,版权属于原作者所有。


发表评论 取消回复