参考:https://www.jb51.net/article/186659.htm
matplotlib plt.lengend图例放在图像的外侧
1、图例在图中实例
import numpy as np
import matplotlib.pyplot as plt
# 定义x,y
X = np.linspace(0, 2*np.pi, 32, endpoint=True)
C = np.cos(X)
# figure的名称
plt.figure('demon plot')
# 画图
plt.plot(X, C, 'r--', label = 'cos')
# 显示x、y坐标代表的含义
plt.xlabel('Independent variable x')
plt.ylabel('dependent variable y')
# 显示图的标题
plt.title(' demo')
# 显示图例
# ------在图中右下角-------------
'''
loc的可选参数
0: 'best'
1: 'upper right'
2: 'upper left'
3: 'lower left'
4: 'lower right'
5: 'right'
6: 'center left'
7: 'center right'
8: 'lower center'
9: 'upper center'
10: 'center'
'''
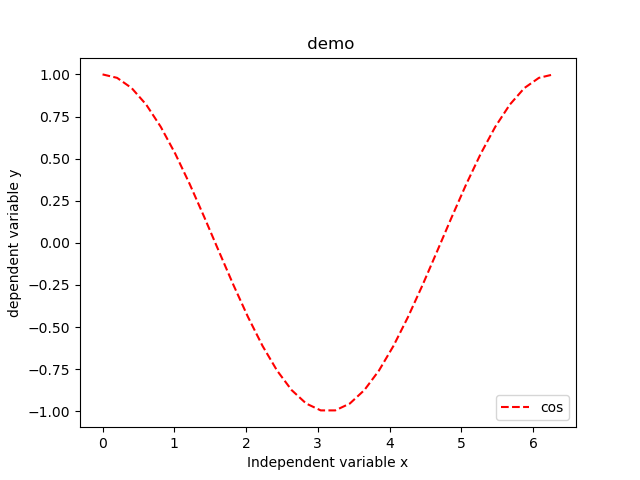
plt.legend(loc='lower right')
plt.show()
运行结果:
|
|
2、图例在图外
plt.legend(bbox_to_anchor=(num1, num2), loc=num3, borderaxespad=num4)说明:bbox_to_anchor被赋予的二元组中,num1用于控制legend的左右移动,值越大越向右边移动,num2用于控制legend的上下移动,值越大,越向上移动。用于微调图例的位置。
num1表示水平位置,num2表示垂直位置。
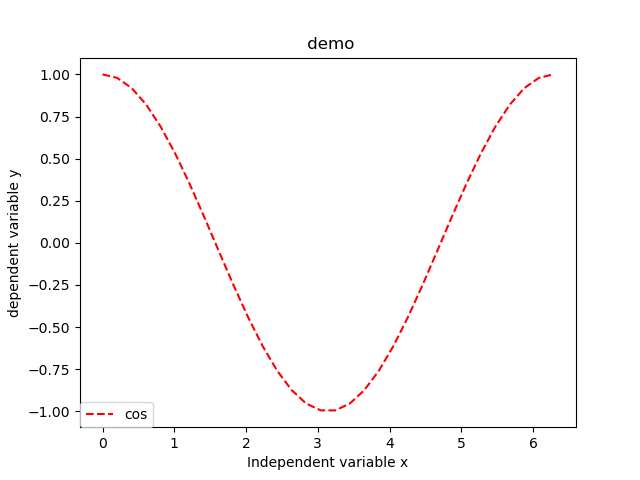
1)num1=0表示legend位于图像的左侧垂直线(其它设置:num2=0,num3=3,num4=0);
import numpy as np
import matplotlib.pyplot as plt

# 定义x,y
X = np.linspace(0, 2*np.pi, 32, endpoint=True)
C = np.cos(X)

# figure的名称
plt.figure('demon plot')
# 画图
plt.plot(X, C, 'r--', label = 'cos')

# 显示x、y坐标代表的含义
plt.xlabel('Independent variable x')
plt.ylabel('dependent variable y')

# 显示图的标题
plt.title(' demo')

# 显示图例

num1 = 0
num2 = 0
num3 = 3
num4 = 0
plt.legend(bbox_to_anchor=(num1, num2), loc=num3, borderaxespad=num4)

plt.show()
运行结果:
|
|
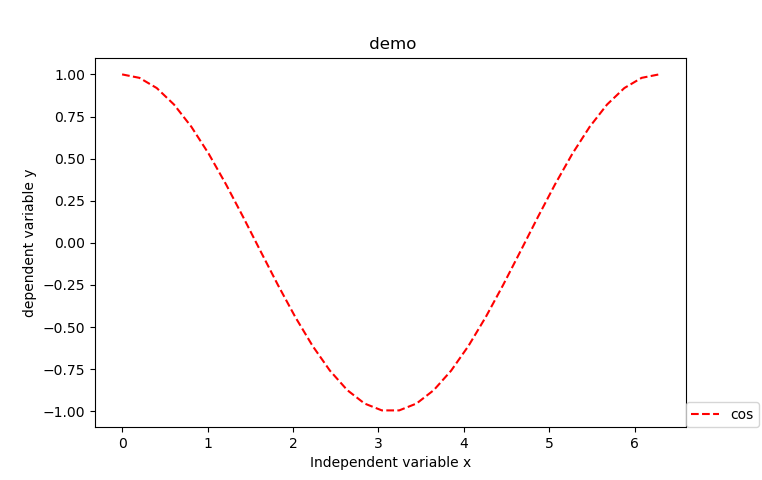
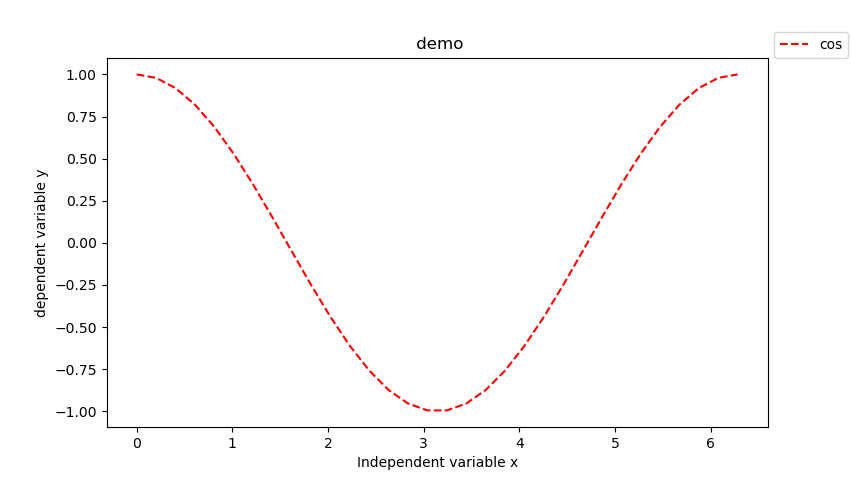
2)num1=1表示legend位于图像的右侧垂直线(其它设置:num2=0,num3=3,num4=0);
运行结果:
|
|
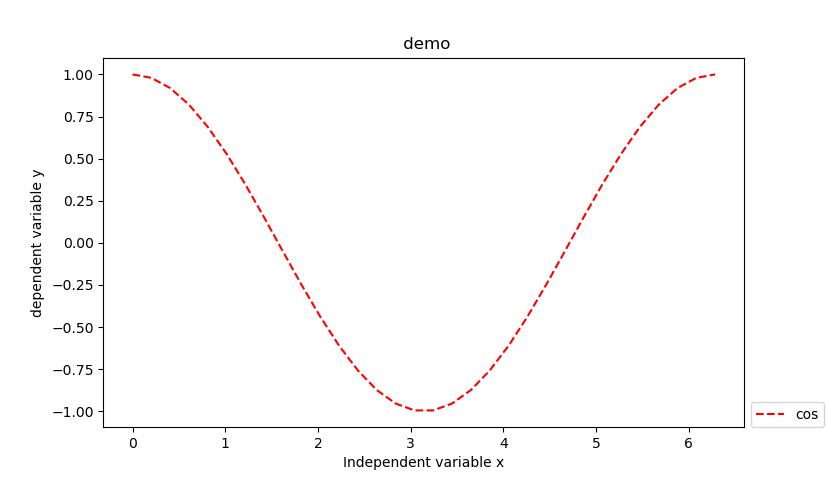
3)为了美观,需要将legend放于图像的外侧,而又距离不是太大,一般设num1=1.01;
运行结果:
|
|

4)num2=0表示legend位于图像下侧水平线(其它设置num1=1.05,num3=3,num4=0);
运行结果:
5 )num2=1表示legend位于图像上侧水平线(其它设置:num1=1.05,num3=3,num4=0)。
运行结果:
|
|
最后
以上就是高大大侠最近收集整理的关于matplotlib plt.lengend图例放在图像的外侧1、图例在图中实例2、图例在图外的全部内容,更多相关matplotlib内容请搜索靠谱客的其他文章。
本图文内容来源于网友提供,作为学习参考使用,或来自网络收集整理,版权属于原作者所有。


发表评论 取消回复