文章目录
- 问题描述
- 解决方案
- 参考文献
问题描述
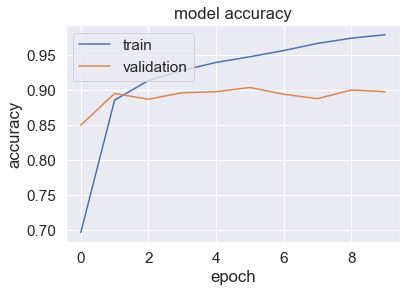
使用 seaborn 后 matplotlib 的样式被改变
import seaborn as sn
import matplotlib.pyplot as plt
def plot_accuracy_loss():
"""绘制准确率和损失的学习曲线"""
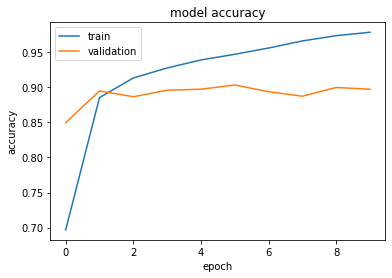
plt.plot([0.696624219417572, 0.8854547142982483, 0.9134230017662048, 0.9277634024620056, 0.9391645193099976,
0.9472699761390686, 0.9561770558357239, 0.9663311839103699, 0.9738131165504456, 0.9787120223045349])
plt.plot([0.8496615886688232, 0.8949055671691895, 0.8867117762565613, 0.895974338054657, 0.897399365901947,
0.9034556746482849, 0.8938368558883667, 0.8874242901802063, 0.8998931050300598, 0.897399365901947])
plt.title('model accuracy')
plt.ylabel('accuracy')
plt.xlabel('epoch')
plt.legend(['train', 'validation'], loc='upper left')
plt.figure()
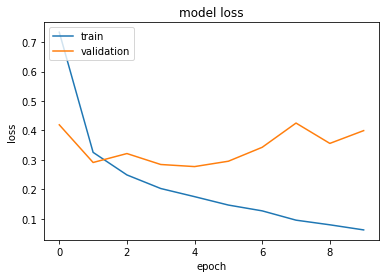
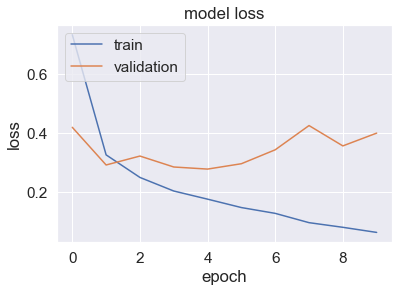
plt.plot([0.7331374883651733, 0.325786828994751, 0.2492501437664032, 0.20318160951137543, 0.17558474838733673,
0.14708386361598969, 0.12740403413772583, 0.09587036073207855, 0.08011940866708755, 0.06278619915246964])
plt.plot([0.4191925525665283, 0.29146718978881836, 0.32174915075302124, 0.28464576601982117, 0.27755457162857056,
0.29574576020240784, 0.3429723381996155, 0.425152450799942, 0.35617774724960327, 0.39953190088272095])
plt.title('model loss')
plt.ylabel('loss')
plt.xlabel('epoch')
plt.legend(['train', 'validation'], loc='upper left')
plt.show()
plot_accuracy_loss()
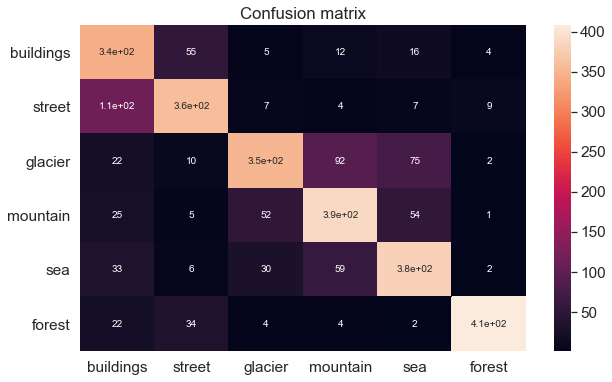
data = [[345, 55, 5, 12, 16, 4],
        [114, 360, 7, 4, 7, 9],
        [22, 10, 352, 92, 75, 2],
        [25, 5, 52, 388, 54, 1],
        [33, 6, 30, 59, 380, 2],
        [22, 34, 4, 4, 2, 408]]
class_names = ['buildings', 'street', 'glacier', 'mountain', 'sea', 'forest']
fig, ax = plt.subplots(figsize=(10, 6))
sn.set(font_scale=1.4)
sn.heatmap(
    data,
    annot=True,
    annot_kws={'size': 10},
    xticklabels=class_names,
    yticklabels=class_names,
    ax=ax
)
ax.set_title('Confusion matrix')
plt.show()
plot_accuracy_loss()
解决方案
调用 sn.reset_orig() 即可
而 plt.style.use('default') 会改变别的东西,例如默认图像大小,不建议使用
参考文献
- seaborn to reset back to the matplotlib
- Seaborn configuration hides default matplotlib
- matplotlib.pyplot.subplot
- Changes to the default style
- Controlling figure aesthetics
最后
以上就是细心荔枝最近收集整理的关于使用seaborn后matplotlib的样式被改变的坑——重置样式问题描述解决方案参考文献的全部内容,更多相关使用seaborn后matplotlib内容请搜索靠谱客的其他文章。
本图文内容来源于网友提供,作为学习参考使用,或来自网络收集整理,版权属于原作者所有。


发表评论 取消回复