plt.axes:python中灵活地画子图方法
最近在修改文章的时候遇到了要画出大小不同的子图问题,一直以来都是采用plt.subplot(num_rows, num_cols, fig_index)直接来画子图的,但是发现这种方法很难调整子图的大小,于是采用plt.axes来解决问题。
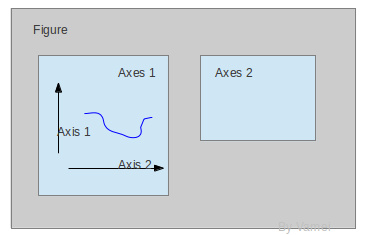
首先来看下Figure和Axes对象,在python的matplotlib库中,整个图像为一个Figure对象,在Figure对象中可以包含一个或多个Axes对象,每个Axes对象都是一个拥有自己坐标系统的绘图区域,其逻辑关系如下:

- plt.axes官方文档
- 代码块高亮
- 图片链接和图片上传
- LaTex数学公式
- UML序列图和流程图
- 离线写博客
- 导入导出Markdown文件
- 丰富的快捷键
plt.axes官方文档
- axes() by itself creates a default full subplot(111) window axis.
- axes(rect, facecolor=‘w’) where rect = [left, bottom, width, height] in normalized (0, 1) units. facecolor is the background color for the axis, default white.
- axes(h) where h is an axes instance makes h the current axis. An Axes instance is returned.
rect=[左,下,宽,高] 规定的矩形区域(范围是0~1),rect矩形简写,这里的数值都是以figure大小为比例,因此,若是要两个axes并排显示,那么axes[2]的左=axes[1].左+axes[1].宽,这样axes[2]才不会和axes[1]重叠。
参数facecolor是用于调整背景色的,网上很多博客直接抄旧版的博客采用的参数仍旧是axisbg,然而自matplotlib2.0+版本后就将axisbg改成了facecolor了。
代码块
- 三个子图
import matplotlib.pyplot as plt
import numpy as np

# create some data to use for the plot
dt = 0.001
t = np.arange(0.0, 10.0, dt)
r = np.exp(-t[:1000]/0.05)               # impulse response
x = np.random.randn(len(t))
s = np.convolve(x, r)[:len(x)]*dt  # colored noise

# the main axes is subplot(111) by default
plt.plot(t, s)
plt.axis([0, 1, 1.1*np.amin(s), 2*np.amax(s)])
plt.xlabel('time (s)')
plt.ylabel('current (nA)')
plt.title('Gaussian colored noise')

# this is an inset axes over the main axes
a = plt.axes([.65, .6, .2, .2], facecolor='y')
n, bins, patches = plt.hist(s, 400, normed=1)
plt.title('Probability')
plt.xticks([])
plt.yticks([])

# this is another inset axes over the main axes
b = plt.axes([0.2, 0.6, .2, .2], facecolor='y')
plt.plot(t[:len(r)], r)
plt.title('Impulse response')
plt.xlim(0, 0.2)
plt.xticks([])
plt.yticks([])

plt.show()
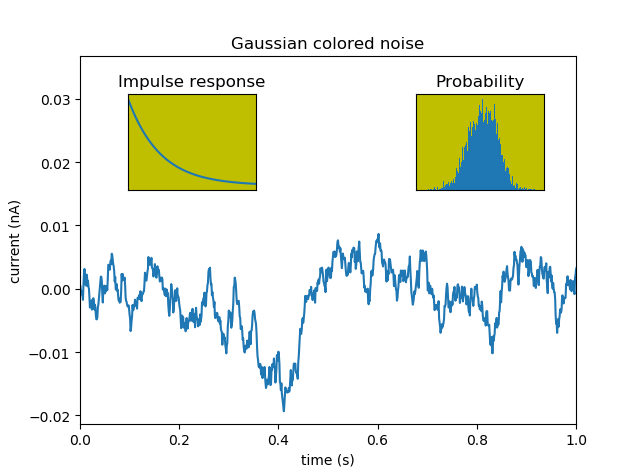
生成的图片如下所示:

- 两个子图
import numpy as np
import matplotlib.pyplot as plt

t = np.linspace(0, 2 * np.pi, 30)
x1 = 6 * (2 * np.cos(t) - np.cos(2 * t))
y1 = 6 * (2 * np.sin(t) - np.sin(2 * t))
x2 = 3 * (2 * np.cos(t) - np.cos(2 * t))
y2 = 3 * (2 * np.sin(t) - np.sin(2 * t))

plt.figure()
# set the size of subplots
left, width = 0.10, 0.77
bottom, height = 0.07, 0.3
bottom_h = bottom + height + 0.04
rect_line1 = [left, bottom, width, height]
rect_line2 = [left, bottom_h, width, 0.5]
axbelow = plt.axes(rect_line1)
# plt.xticks([])   # 隐去坐标
# plt.yticks([])
axupper = plt.axes(rect_line2)
# plt.xticks([])
# plt.yticks([])

plot1=axbelow.plot(y1,x1,'-ob',ms=3)
plot2=axupper.plot(y2,x2,'-og',ms=3)

plt.show()
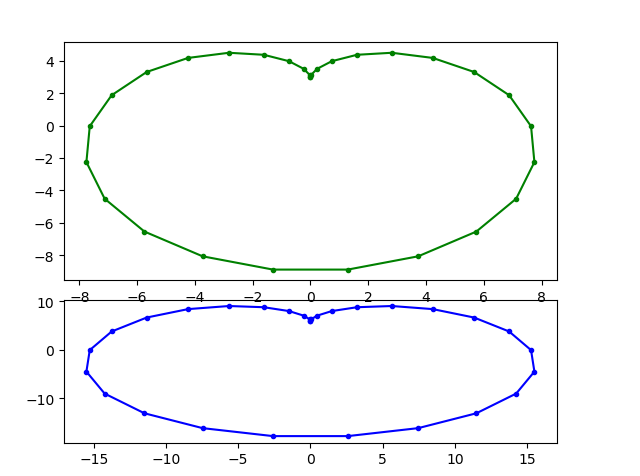
生成的图片是:

参考链接:
[1]: Python–matplotlib绘图可视化知识点整理
[2]: 知乎:python如何调整子图
最后
以上就是饱满彩虹最近收集整理的关于如何在python中灵活地画子图plt.axes:python中灵活地画子图方法的全部内容,更多相关如何在python中灵活地画子图plt内容请搜索靠谱客的其他文章。
本图文内容来源于网友提供,作为学习参考使用,或来自网络收集整理,版权属于原作者所有。


发表评论 取消回复