原文链接: Python mayavi moviepy vispy 将数据动态可视化
上一篇: Python 无监督学习 聚类算法
下一篇: embedding embedding_lookup
参考
http://python.jobbole.com/81185/
安装
使用conda安装
conda install -c conda-forge vtk
conda install -c conda-forge mayavi
conda install -c conda-forge moviepy
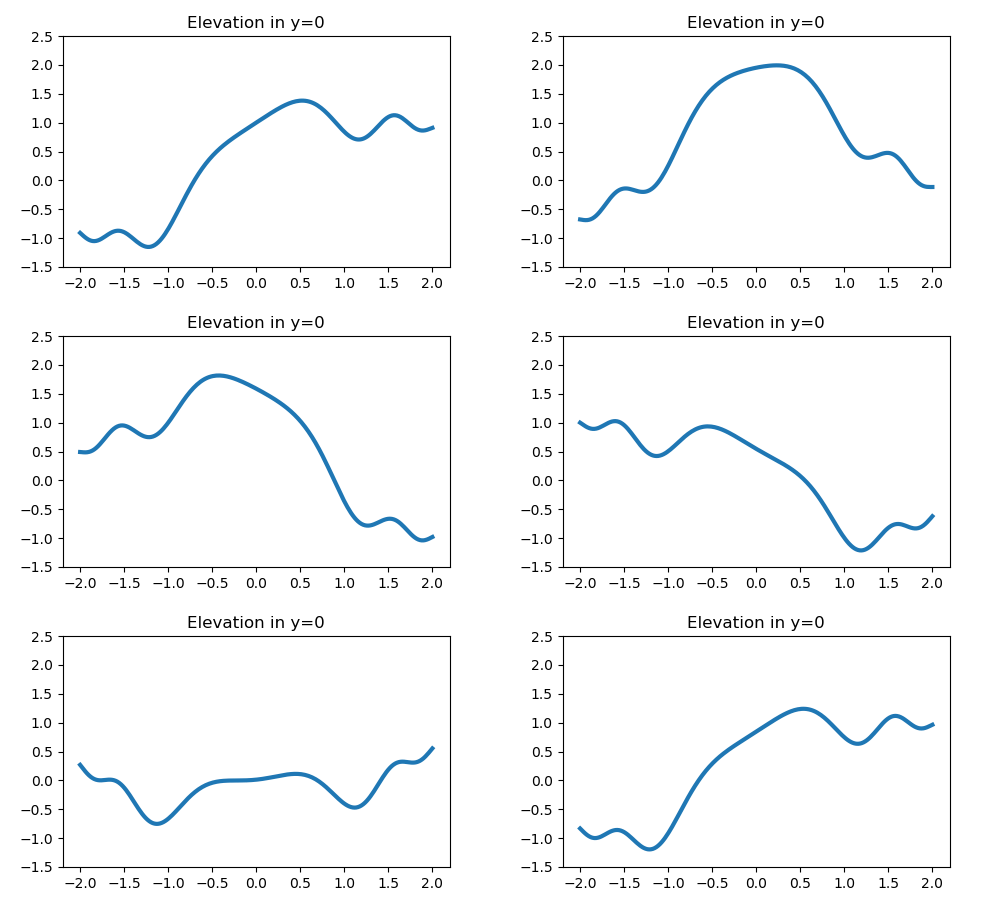
简单例子
import matplotlib.pyplot as plt
import numpy as np
from moviepy.video.io.bindings import mplfig_to_npimage
import moviepy.editor as mpy
# DRAW A FIGURE WITH MATPLOTLIB
duration = 2
fig_mpl, ax = plt.subplots(1,figsize=(5,3), facecolor='white')
xx = np.linspace(-2,2,200) # the x vector
zz = lambda d: np.sinc(xx**2)+np.sin(xx+d) # the (changing) z vector
ax.set_title("Elevation in y=0")
ax.set_ylim(-1.5,2.5)
line, = ax.plot(xx, zz(0), lw=3)
# ANIMATE WITH MOVIEPY (UPDATE THE CURVE FOR EACH t). MAKE A GIF.
def make_frame_mpl(t):
line.set_ydata( zz(2*np.pi*t/duration))
# <= Update the curve
return mplfig_to_npimage(fig_mpl) # RGB image of the figure
animation =mpy.VideoClip(make_frame_mpl, duration=duration)
animation.write_gif("sinc_mpl.gif", fps=20)
会自动下载FFmpeg

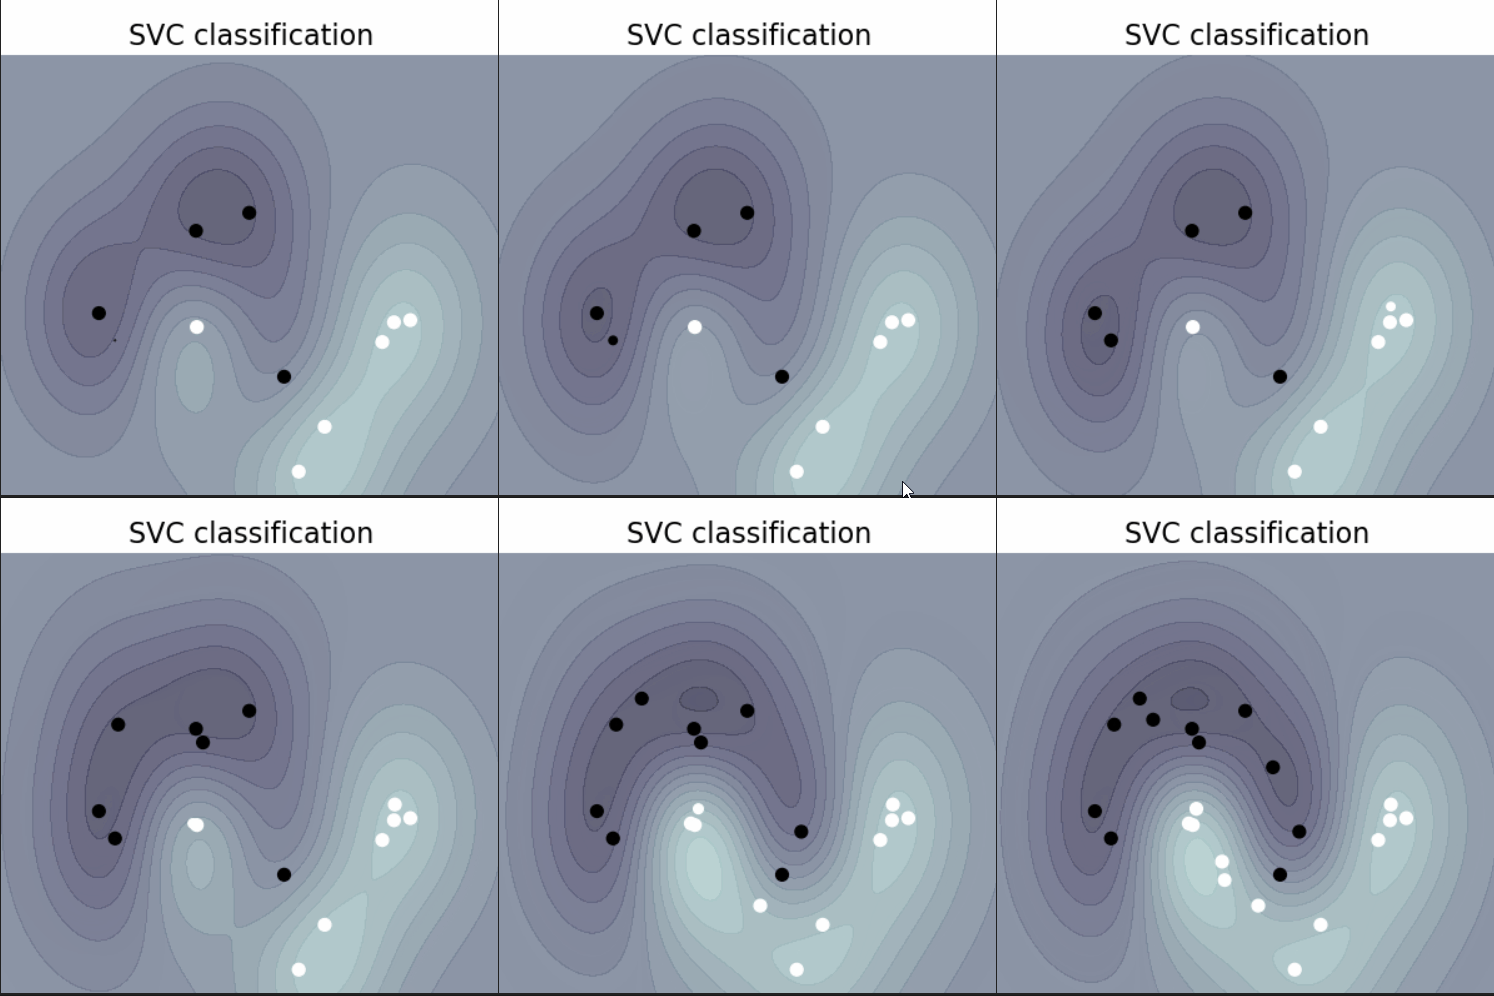
效果

import numpy as np
import matplotlib.pyplot as plt
from sklearn import svm
# sklearn = scikit-learn
from sklearn.datasets import make_moons
from moviepy.editor import VideoClip
from moviepy.video.io.bindings import mplfig_to_npimage
X, Y = make_moons(50, noise=0.1, random_state=2)
# semi-random data
fig, ax = plt.subplots(1, figsize=(4, 4), facecolor=(1, 1, 1))
fig.subplots_adjust(left=0, right=1, bottom=0)
xx, yy = np.meshgrid(np.linspace(-2, 3, 500), np.linspace(-1, 2, 500))
def make_frame(t):
ax.clear()
ax.axis('off')
ax.set_title("SVC classification", fontsize=16)
classifier = svm.SVC(gamma=2, C=1)
# the varying weights make the points appear one after the other
weights = np.minimum(1, np.maximum(0, t ** 2 + 10 - np.arange(50)))
classifier.fit(X, Y, sample_weight=weights)
Z = classifier.decision_function(np.c_[xx.ravel(), yy.ravel()])
Z = Z.reshape(xx.shape)
ax.contourf(xx, yy, Z, cmap=plt.cm.bone, alpha=0.8,
vmin=-2.5, vmax=2.5, levels=np.linspace(-2, 2, 20))
ax.scatter(X[:, 0], X[:, 1], c=Y, s=50 * weights, cmap=plt.cm.bone)
return mplfig_to_npimage(fig)
animation = VideoClip(make_frame, duration=7)
animation.write_gif("svm.gif", fps=15)

最后
以上就是狂野宝马最近收集整理的关于Python mayavi moviepy vispy 将数据动态可视化的全部内容,更多相关Python内容请搜索靠谱客的其他文章。
本图文内容来源于网友提供,作为学习参考使用,或来自网络收集整理,版权属于原作者所有。


发表评论 取消回复