《Python数据可视化编程实战》
绘制并定制化图表
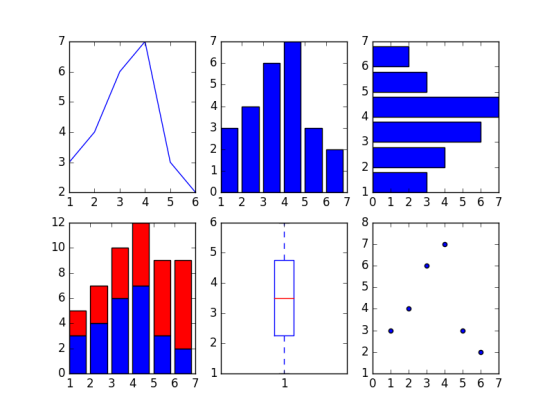
3.1 柱状图、线形图、堆积柱状图
from matplotlib.pyplot import *
x = [1,2,3,4,5,6]
y = [3,4,6,7,3,2]
#create new figure
figure()
#线
subplot(2,3,1)
plot(x,y)
#柱状图
subplot(2,3,2)
bar(x,y)
#水平柱状图
subplot(2,3,3)
barh(x,y)
#叠加柱状图
subplot(2,3,4)
bar(x,y)
y1=[2,3,4,5,6,7]
bar(x,y1,bottom=y,color='r')
#箱线图
subplot(2,3,5)
boxplot(x)
#散点图
subplot(2,3,6)
scatter(x,y)
show()
3.2 箱线图和直方图
from matplotlib.pyplot import *
figure()
dataset = [1,3,5,7,8,3,4,5,6,7,1,2,34,3,4,4,5,6,3,2,2,3,4,5,6,7,4,3]
subplot(1,2,1)
boxplot(dataset, vert=False)
subplot(1,2,2)
#直方图
hist(dataset)
show()

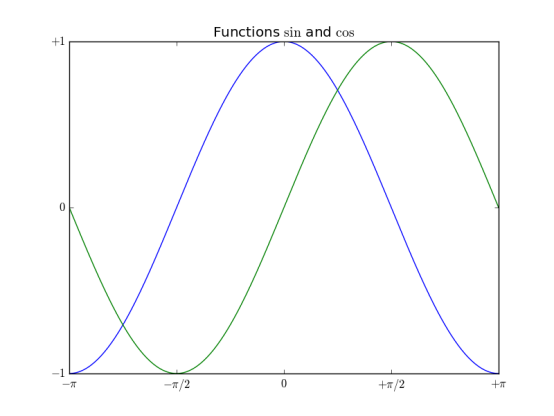
3.3 正弦余弦及图标
from matplotlib.pyplot import *
import numpy as np
x = np.linspace(-np.pi, np.pi, 256, endpoint=True)
y = np.cos(x)
y1= np.sin(x)
plot(x,y)
plot(x,y1)
#图表名称
title("Functions $sin$ and $cos$")
#x,y轴坐标范围
xlim(-3,3)
ylim(-1,1)
#坐标上刻度
xticks([-np.pi, -np.pi/2,0,np.pi/2,np.pi],
[r'$-pi$', r'$-pi/2$', r'$0$', r'$+pi/2$',r'$+pi$'])
yticks([-1, 0, 1],
[r'$-1$',r'$0$',r'$+1$' ])
#网格
grid()
show()
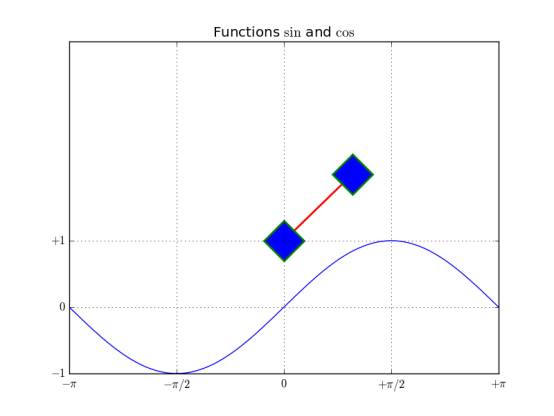
3.4 设置图表的线型、属性和格式化字符串
from matplotlib.pyplot import *
import numpy as np
x = np.linspace(-np.pi, np.pi, 256, endpoint=True)
y = np.cos(x)
y1= np.sin(x)
#线段颜色,线条风格,线条宽度,线条标记,标记的边缘颜色,标记边缘宽度,标记内颜色,标记大小
plot([1,2],c='r',ls='-',lw=2, marker='D', mec='g',mew=2, mfc='b',ms=30)
plot(x,y1)
#图表名称
title("Functions $sin$ and $cos$")
#x,y轴坐标范围
xlim(-3,3)
ylim(-1,4)
#坐标上刻度
xticks([-np.pi, -np.pi/2,0,np.pi/2,np.pi],
[r'$-pi$', r'$-pi/2$', r'$0$', r'$+pi/2$',r'$+pi$'])
yticks([-1, 0, 1],
[r'$-1$',r'$0$',r'$+1$' ])
grid()
show()
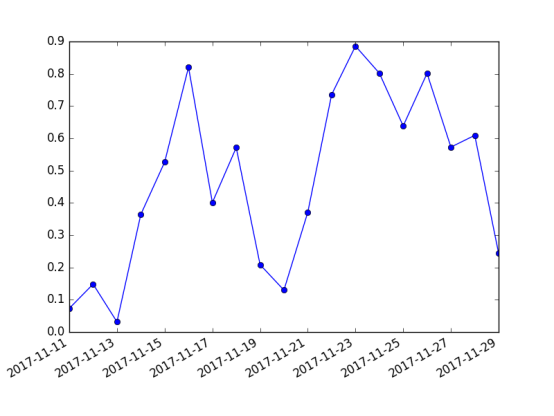
3.5 设置刻度、时间刻度标签、网格
import matplotlib.pyplot as mpl
from pylab import *
import datetime
import numpy as np
fig = figure()
ax = gca()
# 时间区间
start = datetime.datetime(2017,11,11)
stop = datetime.datetime(2017,11,30)
delta = datetime.timedelta(days =1)
dates = mpl.dates.drange(start,stop,delta)
values = np.random.rand(len(dates))
ax.plot_date(dates, values, ls='-')
date_format = mpl.dates.DateFormatter('%Y-%m-%d')
ax.xaxis.set_major_formatter(date_format)
fig.autofmt_xdate()
show()
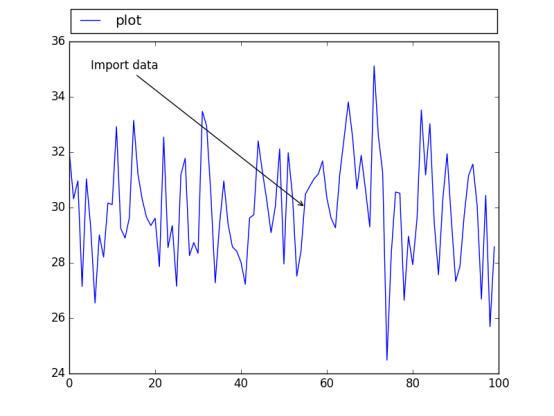
3.6 添加图例和注释
from matplotlib.pyplot import *
import numpy as np
x1 = np.random.normal(30, 2,100)
plot(x1, label='plot')
#图例
#图标的起始位置,宽度,高度 归一化坐标
#loc 可选,为了图标不覆盖图
#ncol 图例个数
#图例平铺
#坐标轴和图例边界之间的间距
legend(bbox_to_anchor=(0., 1.02, 1., .102),loc = 4,
ncol=1, mode="expand",borderaxespad=0.1)
#注解
# Import data 注释
#(55,30) 要关注的点
#xycoords = ‘data’ 注释和数据使用相同坐标系
#xytest 注释的位置
#arrowprops注释用的箭头
annotate("Import data", (55,30), xycoords='data',
xytext=(5,35),
arrowprops=dict(arrowstyle='->'))
show()
3.7 直方图、饼图
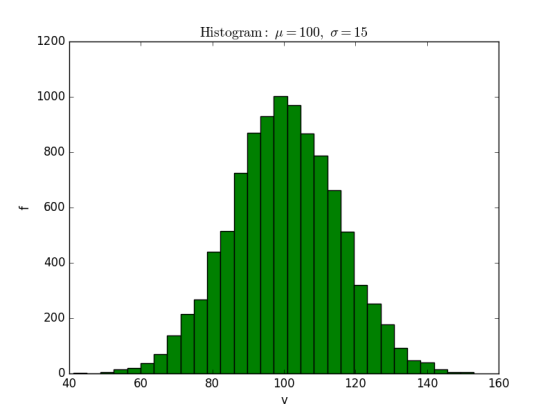
直方图
import matplotlib.pyplot as plt
import numpy as np
mu=100
sigma = 15
x = np.random.normal(mu, sigma, 10000)
ax = plt.gca()
ax.hist(x,bins=30, color='g')
ax.set_xlabel('v')
ax.set_ylabel('f')
ax.set_title(r'$mathrm{Histogram:} mu=%d, sigma=%d$' % (mu,sigma))
plt.show()
饼图
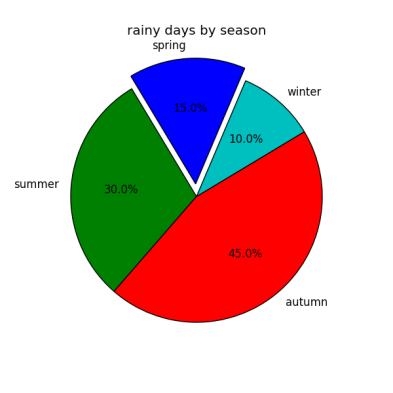
from pylab import *
figure(1, figsize=(6,6))
ax = axes([0.1,0.1,0.8,0.8])
labels ='spring','summer','autumn','winter'
x=[15,30,45,10]
#explode=(0.1,0.2,0.1,0.1)
explode=(0.1,0,0,0)
pie(x, explode=explode, labels=labels, autopct='%1.1f%%', startangle=67)
title('rainy days by season')
show()
3.8 设置坐标轴
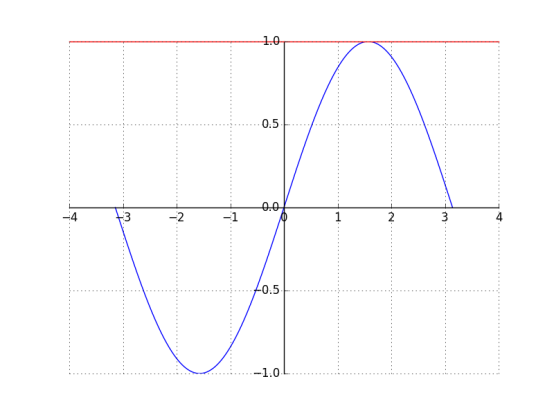
import matplotlib.pyplot as plt
import numpy as np
x = np.linspace(-np.pi, np.pi, 500, endpoint=True)
y = np.sin(x)
plt.plot(x,y)
ax = plt.gca()
#top bottom left right 四条线段框成的
#上下边界颜色
ax.spines['right'].set_color('none')
ax.spines['top'].set_color('r')
#坐标轴位置
ax.spines['bottom'].set_position(('data', 0))
ax.spines['left'].set_position(('data', 0))
#坐标轴上刻度位置
ax.xaxis.set_ticks_position('bottom')
ax.yaxis.set_ticks_position('left')
plt.grid()
plt.show()
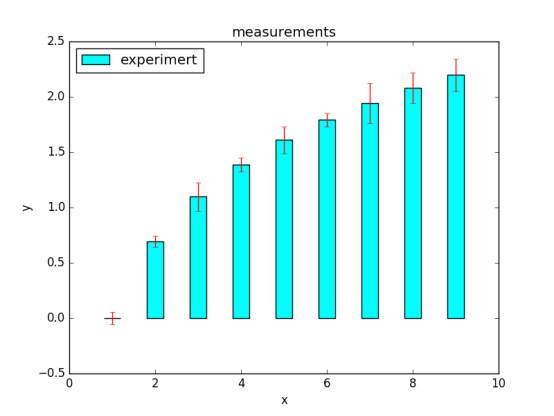
3.9 误差条形图
import matplotlib.pyplot as plt
import numpy as np
x = np.arange(0,10,1)
y = np.log(x)
xe = 0.1 * np.abs(np.random.randn(len(y)))
plt.bar(x,y,yerr=xe,width=0.4,align='center',
ecolor='r',color='cyan',label='experimert')
plt.xlabel('x')
plt.ylabel('y')
plt.title('measurements')
plt.legend(loc='upper left') # 这种图例用法更直接
plt.show()
3.10 带填充区域的图表
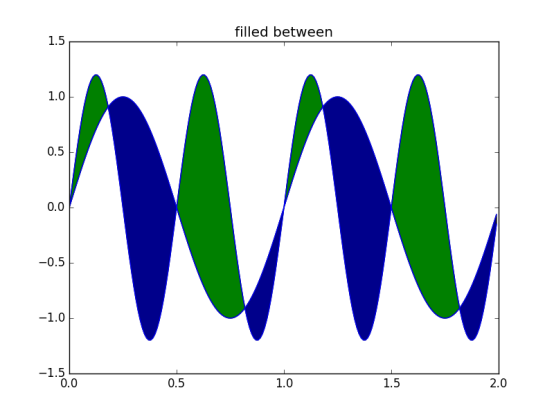
import matplotlib.pyplot as plt
from matplotlib.pyplot import *
import numpy as np
x = np.arange(0,2,0.01)
y1 = np.sin(2*np.pi*x)
y2=1.2*np.sin(4*np.pi*x)
fig = figure()
ax = gca()
ax.plot(x,y1,x,y2,color='b')
ax.fill_between(x,y1,y2,where = y2>y1, facecolor='g',interpolate=True)
ax.fill_between(x,y1,y2,where = y2
ax.set_title('filled between')
show()
3.11散点图
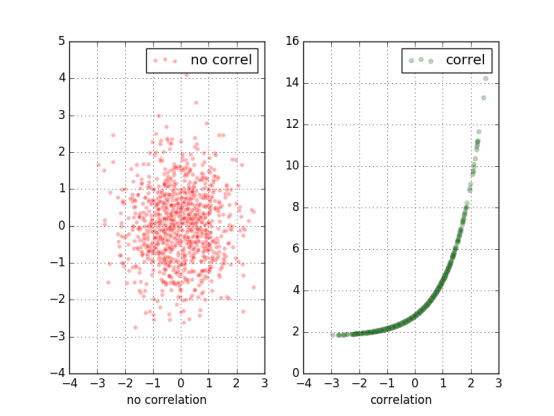
import matplotlib.pyplot as plt
import numpy as np
x = np.random.randn(1000)
y1 = np.random.randn(len(x))
y2 = 1.8 + np.exp(x)
ax1 = plt.subplot(1,2,1)
ax1.scatter(x,y1,color='r',alpha=.3,edgecolors='white',label='no correl')
plt.xlabel('no correlation')
plt.grid(True)
plt.legend()
ax1 = plt.subplot(1,2,2)
#alpha透明度 edgecolors边缘颜色 label图例(结合legend使用)
plt.scatter(x,y2,color='g',alpha=.3,edgecolors='gray',label='correl')
plt.xlabel('correlation')
plt.grid(True)
plt.legend()
plt.show()
第四章 更多图表和定制化
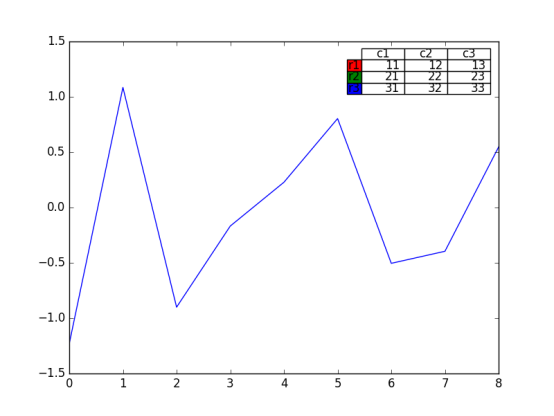
4.4 向图表添加数据表
from matplotlib.pyplot import *
import matplotlib.pyplot as plt
import numpy as np
plt.figure()
ax = plt.gca()
y = np.random.randn(9)
col_labels = ['c1','c2','c3']
row_labels = ['r1','r2','r3']
table_vals = [[11,12,13],[21,22,23],[31,32,33]]
row_colors = ['r','g','b']
my_table = plt.table(cellText=table_vals,
colWidths=[0.1]*3,
rowLabels=row_labels,
colLabels=col_labels,
rowColours=row_colors,
loc='upper right')
plt.plot(y)
plt,show()
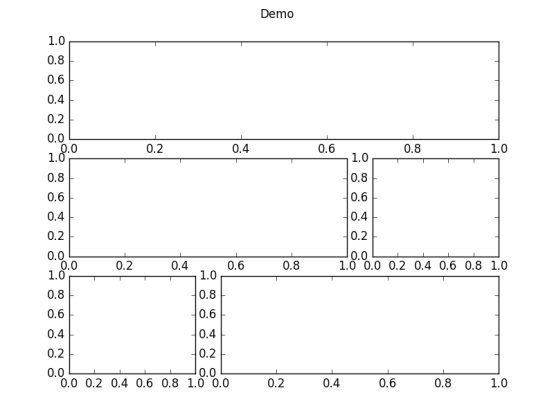
4.5 使用subplots
from matplotlib.pyplot import *
import matplotlib.pyplot as plt
import numpy as np
plt.figure(0)
#子图的分割规划
a1 = plt.subplot2grid((3,3),(0,0),colspan=3)
a2 = plt.subplot2grid((3,3),(1,0),colspan=2)
a3 = plt.subplot2grid((3,3),(1,2),colspan=1)
a4 = plt.subplot2grid((3,3),(2,0),colspan=1)
a5 = plt.subplot2grid((3,3),(2,1),colspan=2)
all_axex = plt.gcf().axes
for ax in all_axex:
for ticklabel in ax.get_xticklabels() + ax.get_yticklabels():
ticklabel.set_fontsize(10)
plt.suptitle("Demo")
plt.show()
4.6 定制化网格
grid();
color、linestyle 、linewidth等参数可设
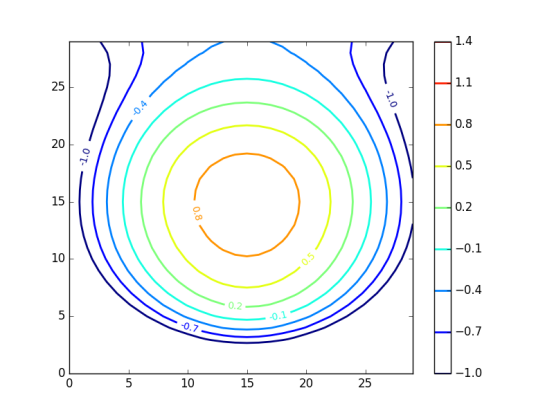
4.7 创建等高线图
基于矩阵
等高线标签
等高线疏密
import matplotlib.pyplot as plt
import numpy as np
import matplotlib as mpl
def process_signals(x,y):
return (1-(x**2 + y**2))*np.exp(-y**3/3)
x = np.arange(-1.5, 1.5, 0.1)
y = np.arange(-1.5,1.5,0.1)
X,Y = np.meshgrid(x,y)
Z = process_signals(X,Y)
N = np.arange(-1, 1.5, 0.3) #作为等值线的间隔
CS = plt.contour(Z, N, linewidths = 2,cmap = mpl.cm.jet)
plt.clabel(CS, inline=True, fmt='%1.1f', fontsize=10) #等值线标签
plt.colorbar(CS)
plt.show()
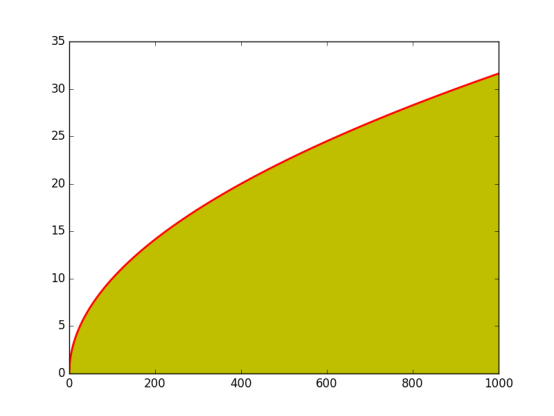
4.8 填充图表底层区域
from matplotlib.pyplot import *
import matplotlib.pyplot as plt
import numpy as np
from math import sqrt
t = range(1000)
y = [sqrt(i) for i in t]
plt.plot(t,y,color='r',lw=2)
plt.fill_between(t,y,color='y')
plt.show()
第五章 3D可视化图表
在选择3D之前最好慎重考虑,因为3D可视化比2D更加让人感到迷惑。
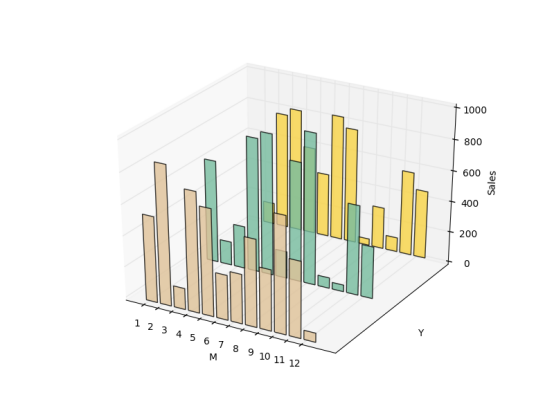
5.2 3D柱状图
import matplotlib.pyplot as plt
import numpy as np
import matplotlib as mpl
import random
import matplotlib.dates as mdates
from mpl_toolkits.mplot3d import Axes3D
mpl.rcParams['font.size'] =10
fig = plt.figure()
ax = fig.add_subplot(111,projection='3d')
for z in [2015,2016,2017]:
xs = range(1,13)
ys = 1000 * np.random.rand(12)
color = plt.cm.Set2(random.choice(range(plt.cm.Set2.N)))
ax.bar(xs,ys,zs=z,zdir='y',color=color,alpha=0.8)
ax.xaxis.set_major_locator(mpl.ticker.FixedLocator(xs))
ax.yaxis.set_major_locator(mpl.ticker.FixedLocator(ys))
ax.set_xlabel('M')
ax.set_ylabel('Y')
ax.set_zlabel('Sales')
plt.show()
5.3 曲面图
import matplotlib.pyplot as plt
import numpy as np
import matplotlib as mpl
import random
from mpl_toolkits.mplot3d import Axes3D
from matplotlib import cm
fig = plt.figure()
ax = fig.add_subplot(111,projection='3d')
n_angles = 36
n_radii = 8
radii = np.linspace(0.125, 1.0, n_radii)
angles = np.linspace(0, 2*np.pi, n_angles, endpoint=False)
angles = np.repeat(angles[..., np.newaxis], n_radii, axis=1)
x = np.append(0, (radii*np.cos(angles)).flatten())
y = np.append(0, (radii*np.sin(angles)).flatten())
z = np.sin(-x*y)
ax.plot_trisurf(x,y,z,cmap=cm.jet, lw=0.2)
plt.show()

5.4 3D直方图
import matplotlib.pyplot as plt
import numpy as np
import matplotlib as mpl
import random
from mpl_toolkits.mplot3d import Axes3D
mpl.rcParams['font.size'] =10
fig = plt.figure()
ax = fig.add_subplot(111,projection='3d')
samples = 25
x = np.random.normal(5,1,samples) #x上正态分布
y = np.random.normal(3, .5, samples) #y上正态分布
#xy平面上,按照10*10的网格划分,落在网格内个数hist,x划分边界、y划分边界
hist, xedges, yedges = np.histogram2d(x,y,bins=10)
elements = (len(xedges)-1)*(len(yedges)-1)
xpos,ypos = np.meshgrid(xedges[:-1]+.25,yedges[:-1]+.25)
xpos = xpos.flatten() #多维数组变为一维数组
ypos = ypos.flatten()
zpos = np.zeros(elements)
dx = .1 * np.ones_like(zpos) #zpos一致的全1数组
dy = dx.copy()
dz = hist.flatten()
#每个立体以(xpos,ypos,zpos)为左下角,以(xpos+dx,ypos+dy,zpos+dz)为右上角
ax.bar3d(xpos,ypos,zpos,dx,dy,dz,color='b',alpha=0.4)
plt.show()

第六章 用图像和地图绘制图表
6.3 绘制带图像的图表
6.4 图像图表显示
第七章 使用正确的图表理解数据
为什么要以这种方式展示数据?
7.2 对数图
import matplotlib.pyplot as plt
import numpy as np
x = np.linspace(1,10)
y = [10**e1 for e1 in x]
z = [2*e2 for e2 in x]
fig = plt.figure(figsize=(10, 8))
ax1 = fig.add_subplot(2,2,1)
ax1.plot(x, y, color='b')
ax1.set_yscale('log')
#两个坐标轴和主次刻度打开网格显示
plt.grid(b=True, which='both', axis='both')
ax2 = fig.add_subplot(2,2,2)
ax2.plot(x,y,color='r')
ax2.set_yscale('linear')
plt.grid(b=True, which='both', axis='both')
ax3 = fig.add_subplot(2,2,3)
ax3.plot(x,z,color='g')
ax3.set_yscale('log')
plt.grid(b=True, which='both', axis='both')
ax4 = fig.add_subplot(2,2,4)
ax4.plot(x,z,color='magenta')
ax4.set_yscale('linear')
plt.grid(b=True, which='both', axis='both')
plt.show()

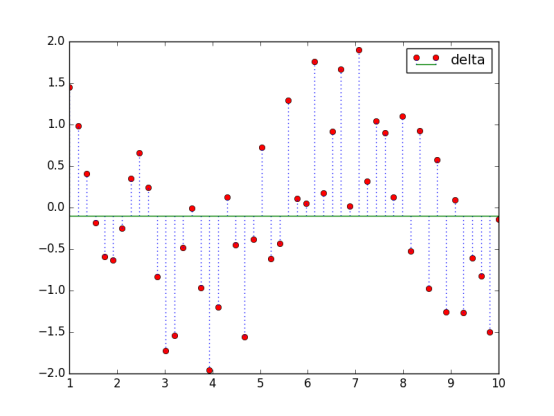
7.3 创建火柴杆图
import matplotlib.pyplot as plt
import numpy as np
x = np.linspace(1,10)
y = np.sin(x+1) + np.cos(x**2)
bottom = -0.1
hold = False
label = "delta"
markerline, stemlines, baseline = plt.stem(x, y, bottom=bottom,label=label, hold=hold)
plt.setp(markerline, color='r', marker= 'o')
plt.setp(stemlines,color='b', linestyle=':')
plt.setp(baseline, color='g',lw=1, linestyle='-')
plt.legend()
plt.show()
7.4 矢量图
7.5 使用颜色表
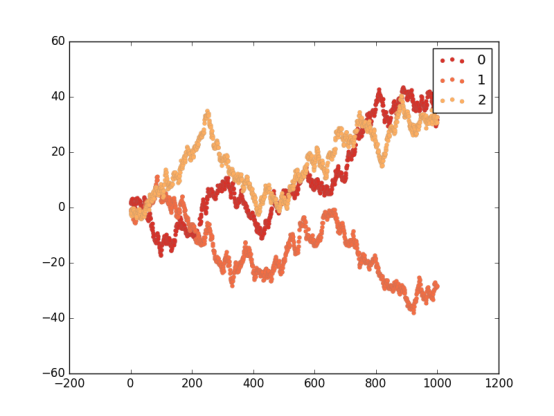
颜色要注意观察者会对颜色和颜色要表达的信息做一定的假设。不要做不相关的颜色映射,比如将财务数据映射到表示温度的颜色上去。
如果数据没有与红绿有强关联时,尽可能不要使用红绿两种颜色。
import matplotlib.pyplot as plt
import numpy as np
import matplotlib as mpl
red_yellow_green = ['#d73027','#f46d43','#fdae61']
sample_size = 1000
fig,ax = plt.subplots(1)
for i in range(3):
y = np.random.normal(size=sample_size).cumsum()
x = np.arange(sample_size)
ax.scatter(x, y, label=str(i), lw=0.1, edgecolors='grey',facecolor=red_yellow_green[i])
plt.legend()
plt.show()
7.7 使用散点图和直方图
7.8 两个变量间的互相关图形
7.9 自相关的重要性
第八章 更多的matplotlib知识
8.6 使用文本和字体属性
函数:
test: 在指定位置添加文本
xlabel:x轴标签
ylabel:y轴标签
title:设置坐标轴的标题
suptitle:为图表添加一个居中的标题
figtest:在图表任意位置添加文本,归一化坐标
属性:
family:字体类型
size/fontsize:字体大小
style/fontstyle:字体风格
variant:字体变体形式
weight/fontweight:粗细
stretch/fontstretch:拉伸
fontproperties:
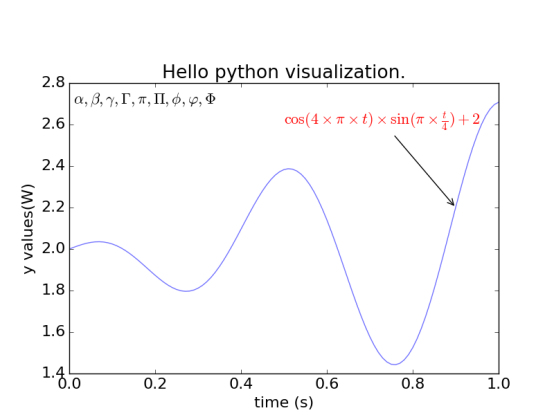
8.7 用LaTeX渲染文本
LaTeX 是一个用于生成科学技术文档的高质量的排版系统,已经是事实上的科学排版或出版物的标准。
import matplotlib.pyplot as plt
import numpy as np
t = np.arange(0.0, 1.0+0.01, 0.01)
s = np.cos(4 * np.pi *t) * np.sin(np.pi*t/4) + 2
#plt.rc('text', usetex=True) #未安装Latex
plt.rc('font', **{'family':'sans-serif','sans-serif':['Helvetica'],'size':16})
plt.plot(t, s, alpha=0.55)
plt.annotate(r'$cos(4 times pi times {t}) times sin(pi times frac{t}{4}) + 2$',xy=(.9, 2.2), xytext=(.5, 2.6),color='r', arrowprops={'arrowstyle':'->'})
plt.text(.01, 2.7, r'$alpha, beta, gamma, Gamma, pi, Pi, phi, varphi, Phi$')
plt.xlabel(r'time (s)')
plt.ylabel(r'y values(W)')
plt.title(r"Hello python visualization.")
plt.subplots_adjust(top=0.8)
plt.show()
结语:本篇文档是基于书籍《Python数据可视化编程实战》学习总结。
最后
以上就是怡然便当最近收集整理的关于python数据可视化编程实战第二版_《Python数据可视化编程实战》的全部内容,更多相关python数据可视化编程实战第二版_《Python数据可视化编程实战》内容请搜索靠谱客的其他文章。


发表评论 取消回复