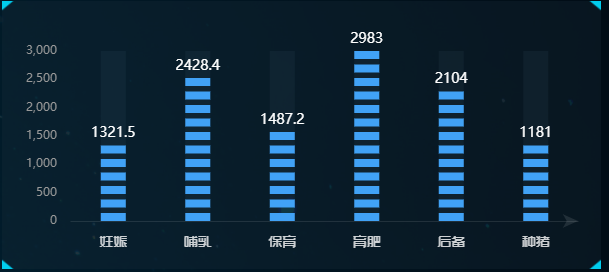
先上效果图:

网上也找了了资源 不过都是横着的 但是我们设计的是竖着的 然后自己看着改了改 实现了该图表
不多说废话 直接上代码
<template>
  <div class="month-material-count">
    <item-title
      :titleText="'今日料量'"
      :moreText="'单位(KG)'"
      :isFuction="false"
      :type="'wael'"
    ></item-title>
    <div class="mmc-chart" ref="chart"></div>
  </div>
</template>

<script lang="ts">
import Vue from 'vue';
import ItemTitle from '@/components/common/ItemTitle.vue';
import * as echarts from 'echarts';

export default Vue.extend({
  name: 'TodayMaterial',

  data() {
    return {
      myChart: null,
      option: {},
    };
  },
  components: {
    ItemTitle,
  },
  mounted() {
    this.getEchartData();
  },

  methods: {
    getEchartData() {
      const { chart }: any = this.$refs;
      if (chart) {
        const myChart = echarts.init(chart);
        const option = {
          tooltip: {
            show: false,
          },
          grid: {
            left: '3%',
            right: '6%',
            bottom: '5%',
            top: '15%',
//图形距离边框的距离,建议百分比,如果数值的话,分辨率改变,图表会变得很丑
            containLabel: true,//grid 区域是否包含坐标轴的刻度标签,默认不包含
          },
          xAxis: {
            boundaryGap: true,
            data: ['妊娠', '哺乳', '保育', '育肥', '后备', '种猪'],
            axisTick: {
              alignWithLabel: true,
              show: false,
            },
            axisLabel: {
              interval: 0,
              margin: 14,
              fontSize: 14,
              fontFamily: 'ShiShangZhongHeiJianTi',
              color: 'rgba(255,255,255,0.8)',
            },
            axisLine: {
              lineStyle: {
                color: 'rgba(255,255,255,0.1)',
              },
              symbol: ['none', 'arrow'], // 坐标直角
            },
          },
          yAxis: [
            {
              type: 'value',
              axisLabel: {
                margin: 14,
                color: '#999999',
              },
              axisLine: {
                lineStyle: {
                  color: '#FFFFFF',
                  width: 1,
                },
              },
              splitLine: {
                show: false,
              },
              splitArea: {
                interval: 10,
              },
            },
          ],
          series: [
            {
              name: '',
              type: 'pictorialBar', // 设置类型为象形柱状图
              symbol: 'Rect', // 图形类型矩形
              barWidth: '11%', // 柱图宽度
              barMaxWidth: '20%', // 最大宽度
              symbolMargin: '3', // 图形垂直间隔
              slient: true,
              itemStyle: {
                normal: {},
              },
              color: '#41A2F6',
              z: 1,
              symbolRepeat: true, // 图形是否重复
              symbolSize: [25, 8], // 图形元素的尺寸
              label: {
                normal: {
                  show: true,
                  position: 'top',
                  formatter: '{c}',
                  textStyle: {
                    color: '#fff',
                    fontSize: 14,
                  },
                },
              },
              // data: ["132.5", "428.4", "487.2", "2983", "104", "81"], // Y轴数据
              data: ['1321.5', '2428.4', '1487.2', '2983', '2104', '1181'], // Y轴数据
              animationEasing: 'elasticOut', // 动画效果
            },
            {
              name: '外框',
              type: 'bar',
              barGap: '-120%', // 设置外框粗细
              slient: true,
              data: ['3000', '3000', '3000', '3000', '3000', '3000'],
              barWidth: 25,
              color: 'red',
              itemStyle: {
                normal: {
                  // color: 'transparent', // 填充色
                  color: 'rgba(76,105,125,0.1)', // 填充色
                  barBorderWidth: 1, // 边框宽度
                  label: {
                    // 标签显示位置
                    show: false,
                    position: 'top', // insideTop 或者横向的 insideLeft
                  },
                },
              },
              z: 0,
            },
          ],
        };
        myChart.setOption(option, true);
      }
    },
  },
});
</script>
<style scoped>
.month-material-count {
  position: relative;
  box-sizing: border-box;
  display: flex;
  width: 32.5%;
  flex-direction: column;
}

.mmc-chart {
  display: flex;
  width: 100%;
  height: 16.75rem;
  margin-top: 1.125rem;
  background-image: url("../../assets/imgs/Home/nav-bg.png");
  background-size: 100% 100%;
}
</style>
最后
以上就是包容鸡翅最近收集整理的关于vue项目用eachars实现电池图的全部内容,更多相关vue项目用eachars实现电池图内容请搜索靠谱客的其他文章。
本图文内容来源于网友提供,作为学习参考使用,或来自网络收集整理,版权属于原作者所有。


发表评论 取消回复