简介
Hystrix-dashboard是一款针对Hystrix进行实时监控的工具,通过Hystrix Dashboard我们可以在直观地看到各Hystrix Command的请求响应时间, 请求成功率等数据。但是只使用Hystrix Dashboard的话, 你只能看到单个应用内的服务信息, 这明显不够. 我们需要一个工具能让我们汇总系统内多个服务的数据并显示到Hystrix Dashboard上, 这个工具就是Turbine.
所以本文我将从两个地方讲,一个是Hystrix Dashboard监控单体应用,另一则是整合Turbine对集群进行监控
背景
上一节我虽然搭建了有关Hystrix的项目,但是我并没有讲解关于Hystrix监控方面的例子,主要因为Hystrix监控与这一章相关联,方便更好的理解。
首先,我们先了解一下Hystrix监控是什么?
Hystrix除实现容错外,Hystrix还提供了近乎实时的监控。 HystrixCommand在执行时,会生成执行结果和运行指标,比如每秒执行的请求数、成功数等等(更多指标请点击进入),这些监控数据对分析应用系统的状态很有用。
接下来我搭建一下环境来演示一下,帮助我们更好的理解。首先,我们在上一节项目基础上,修改如下
1.新增依赖包引入,目的是获得Hystrix的监控信息
<!--自省和监控的集成功能-->
        <dependency>
            <groupId>org.springframework.boot</groupId>
            <artifactId>spring-boot-starter-actuator</artifactId>
        </dependency>
2.注入ServletRegistrationBean,注入原因点击进入
package net.riking.springcloud.consumer;

import com.netflix.hystrix.contrib.metrics.eventstream.HystrixMetricsStreamServlet;
import org.springframework.boot.SpringApplication;
import org.springframework.boot.autoconfigure.SpringBootApplication;
import org.springframework.boot.web.servlet.ServletRegistrationBean;
import org.springframework.cloud.client.circuitbreaker.EnableCircuitBreaker;
import org.springframework.cloud.client.discovery.EnableDiscoveryClient;
import org.springframework.cloud.client.loadbalancer.LoadBalanced;
import org.springframework.context.annotation.Bean;
import org.springframework.web.client.RestTemplate;
@SpringBootApplication
@EnableDiscoveryClient
@EnableCircuitBreaker //开启服务保护机制
public class AppConsumer {
    public static void main(String[] args) {
        SpringApplication.run(AppConsumer.class, args);
    }

    @Bean
    @LoadBalanced   //如果提供者服务为集群,当在请求时,拥有客户端负载均衡的能力
    RestTemplate restTemplate() {
        return new RestTemplate();
    }

     //注入ServletRegistrationBean
    @Bean
    public ServletRegistrationBean getServlet() {
        HystrixMetricsStreamServlet streamServlet = new HystrixMetricsStreamServlet();
        ServletRegistrationBean registrationBean = new ServletRegistrationBean(streamServlet);
        registrationBean.setLoadOnStartup(1);
        registrationBean.addUrlMappings("/hystrix.stream");
        registrationBean.setName("HystrixMetricsStreamServlet");
        return registrationBean;
    }
}
3.访问http://localhost:9001/hystrix.stream,信息如下:


data: {"type":"HystrixCommand","name":"consumer","group":"UserService","currentTime":1566373943815,"isCircuitBreakerOpen":false,"errorPercentage":0,"errorCount":0,"requestCount":0,"rollingCountBadRequests":0,"rollingCountCollapsedRequests":0,"rollingCountEmit":0,"rollingCountExceptionsThrown":0,"rollingCountFailure":0,"rollingCountFallbackEmit":0,"rollingCountFallbackFailure":0,"rollingCountFallbackMissing":0,"rollingCountFallbackRejection":0,"rollingCountFallbackSuccess":0,"rollingCountResponsesFromCache":0,"rollingCountSemaphoreRejected":0,"rollingCountShortCircuited":0,"rollingCountSuccess":0,"rollingCountThreadPoolRejected":0,"rollingCountTimeout":0,"currentConcurrentExecutionCount":0,"rollingMaxConcurrentExecutionCount":0,"latencyExecute_mean":0,"latencyExecute":{"0":0,"25":0,"50":0,"75":0,"90":0,"95":0,"99":0,"99.5":0,"100":0},"latencyTotal_mean":0,"latencyTotal":{"0":0,"25":0,"50":0,"75":0,"90":0,"95":0,"99":0,"99.5":0,"100":0},"propertyValue_circuitBreakerRequestVolumeThreshold":20,"propertyValue_circuitBreakerSleepWindowInMilliseconds":5000,"propertyValue_circuitBreakerErrorThresholdPercentage":50,"propertyValue_circuitBreakerForceOpen":false,"propertyValue_circuitBreakerForceClosed":false,"propertyValue_circuitBreakerEnabled":true,"propertyValue_executionIsolationStrategy":"THREAD","propertyValue_executionIsolationThreadTimeoutInMilliseconds":1000,"propertyValue_executionTimeoutInMilliseconds":1000,"propertyValue_executionIsolationThreadInterruptOnTimeout":true,"propertyValue_executionIsolationThreadPoolKeyOverride":null,"propertyValue_executionIsolationSemaphoreMaxConcurrentRequests":10,"propertyValue_fallbackIsolationSemaphoreMaxConcurrentRequests":10,"propertyValue_metricsRollingStatisticalWindowInMilliseconds":10000,"propertyValue_requestCacheEnabled":true,"propertyValue_requestLogEnabled":true,"reportingHosts":1,"threadPool":"UserService"}

data: {"type":"HystrixThreadPool","name":"UserService","currentTime":1566373943815,"currentActiveCount":0,"currentCompletedTaskCount":38,"currentCorePoolSize":10,"currentLargestPoolSize":10,"currentMaximumPoolSize":10,"currentPoolSize":10,"currentQueueSize":0,"currentTaskCount":38,"rollingCountThreadsExecuted":0,"rollingMaxActiveThreads":0,"rollingCountCommandRejections":0,"propertyValue_queueSizeRejectionThreshold":5,"propertyValue_metricsRollingStatisticalWindowInMilliseconds":10000,"reportingHosts":1}

ping:

data: {"type":"HystrixCommand","name":"consumer","group":"UserService","currentTime":1566373944289,"isCircuitBreakerOpen":false,"errorPercentage":0,"errorCount":0,"requestCount":0,"rollingCountBadRequests":0,"rollingCountCollapsedRequests":0,"rollingCountEmit":0,"rollingCountExceptionsThrown":0,"rollingCountFailure":0,"rollingCountFallbackEmit":0,"rollingCountFallbackFailure":0,"rollingCountFallbackMissing":0,"rollingCountFallbackRejection":0,"rollingCountFallbackSuccess":0,"rollingCountResponsesFromCache":0,"rollingCountSemaphoreRejected":0,"rollingCountShortCircuited":0,"rollingCountSuccess":0,"rollingCountThreadPoolRejected":0,"rollingCountTimeout":0,"currentConcurrentExecutionCount":0,"rollingMaxConcurrentExecutionCount":0,"latencyExecute_mean":0,"latencyExecute":{"0":0,"25":0,"50":0,"75":0,"90":0,"95":0,"99":0,"99.5":0,"100":0},"latencyTotal_mean":0,"latencyTotal":{"0":0,"25":0,"50":0,"75":0,"90":0,"95":0,"99":0,"99.5":0,"100":0},"propertyValue_circuitBreakerRequestVolumeThreshold":20,"propertyValue_circuitBreakerSleepWindowInMilliseconds":5000,"propertyValue_circuitBreakerErrorThresholdPercentage":50,"propertyValue_circuitBreakerForceOpen":false,"propertyValue_circuitBreakerForceClosed":false,"propertyValue_circuitBreakerEnabled":true,"propertyValue_executionIsolationStrategy":"THREAD","propertyValue_executionIsolationThreadTimeoutInMilliseconds":1000,"propertyValue_executionTimeoutInMilliseconds":1000,"propertyValue_executionIsolationThreadInterruptOnTimeout":true,"propertyValue_executionIsolationThreadPoolKeyOverride":null,"propertyValue_executionIsolationSemaphoreMaxConcurrentRequests":10,"propertyValue_fallbackIsolationSemaphoreMaxConcurrentRequests":10,"propertyValue_metricsRollingStatisticalWindowInMilliseconds":10000,"propertyValue_requestCacheEnabled":true,"propertyValue_requestLogEnabled":true,"reportingHosts":1,"threadPool":"UserService"}

data: {"type":"HystrixThreadPool","name":"UserService","currentTime":1566373944289,"currentActiveCount":0,"currentCompletedTaskCount":38,"currentCorePoolSize":10,"currentLargestPoolSize":10,"currentMaximumPoolSize":10,"currentPoolSize":10,"currentQueueSize":0,"currentTaskCount":38,"rollingCountThreadsExecuted":0,"rollingMaxActiveThreads":0,"rollingCountCommandRejections":0,"propertyValue_queueSizeRejectionThreshold":5,"propertyValue_metricsRollingStatisticalWindowInMilliseconds":10000,"reportingHosts":1}

ping:

data: {"type":"HystrixCommand","name":"consumer","group":"UserService","currentTime":1566373944788,"isCircuitBreakerOpen":false,"errorPercentage":0,"errorCount":0,"requestCount":0,"rollingCountBadRequests":0,"rollingCountCollapsedRequests":0,"rollingCountEmit":0,"rollingCountExceptionsThrown":0,"rollingCountFailure":0,"rollingCountFallbackEmit":0,"rollingCountFallbackFailure":0,"rollingCountFallbackMissing":0,"rollingCountFallbackRejection":0,"rollingCountFallbackSuccess":0,"rollingCountResponsesFromCache":0,"rollingCountSemaphoreRejected":0,"rollingCountShortCircuited":0,"rollingCountSuccess":0,"rollingCountThreadPoolRejected":0,"rollingCountTimeout":0,"currentConcurrentExecutionCount":0,"rollingMaxConcurrentExecutionCount":0,"latencyExecute_mean":0,"latencyExecute":{"0":0,"25":0,"50":0,"75":0,"90":0,"95":0,"99":0,"99.5":0,"100":0},"latencyTotal_mean":0,"latencyTotal":{"0":0,"25":0,"50":0,"75":0,"90":0,"95":0,"99":0,"99.5":0,"100":0},"propertyValue_circuitBreakerRequestVolumeThreshold":20,"propertyValue_circuitBreakerSleepWindowInMilliseconds":5000,"propertyValue_circuitBreakerErrorThresholdPercentage":50,"propertyValue_circuitBreakerForceOpen":false,"propertyValue_circuitBreakerForceClosed":false,"propertyValue_circuitBreakerEnabled":true,"propertyValue_executionIsolationStrategy":"THREAD","propertyValue_executionIsolationThreadTimeoutInMilliseconds":1000,"propertyValue_executionTimeoutInMilliseconds":1000,"propertyValue_executionIsolationThreadInterruptOnTimeout":true,"propertyValue_executionIsolationThreadPoolKeyOverride":null,"propertyValue_executionIsolationSemaphoreMaxConcurrentRequests":10,"propertyValue_fallbackIsolationSemaphoreMaxConcurrentRequests":10,"propertyValue_metricsRollingStatisticalWindowInMilliseconds":10000,"propertyValue_requestCacheEnabled":true,"propertyValue_requestLogEnabled":true,"reportingHosts":1,"threadPool":"UserService"}

data: {"type":"HystrixThreadPool","name":"UserService","currentTime":1566373944788,"currentActiveCount":0,"currentCompletedTaskCount":38,"currentCorePoolSize":10,"currentLargestPoolSize":10,"currentMaximumPoolSize":10,"currentPoolSize":10,"currentQueueSize":0,"currentTaskCount":38,"rollingCountThreadsExecuted":0,"rollingMaxActiveThreads":0,"rollingCountCommandRejections":0,"propertyValue_queueSizeRejectionThreshold":5,"propertyValue_metricsRollingStatisticalWindowInMilliseconds":10000,"reportingHosts":1}

ping:

data: {"type":"HystrixCommand","name":"consumer","group":"UserService","currentTime":1566373945292,"isCircuitBreakerOpen":false,"errorPercentage":0,"errorCount":0,"requestCount":0,"rollingCountBadRequests":0,"rollingCountCollapsedRequests":0,"rollingCountEmit":0,"rollingCountExceptionsThrown":0,"rollingCountFailure":0,"rollingCountFallbackEmit":0,"rollingCountFallbackFailure":0,"rollingCountFallbackMissing":0,"rollingCountFallbackRejection":0,"rollingCountFallbackSuccess":0,"rollingCountResponsesFromCache":0,"rollingCountSemaphoreRejected":0,"rollingCountShortCircuited":0,"rollingCountSuccess":0,"rollingCountThreadPoolRejected":0,"rollingCountTimeout":0,"currentConcurrentExecutionCount":0,"rollingMaxConcurrentExecutionCount":0,"latencyExecute_mean":0,"latencyExecute":{"0":0,"25":0,"50":0,"75":0,"90":0,"95":0,"99":0,"99.5":0,"100":0},"latencyTotal_mean":0,"latencyTotal":{"0":0,"25":0,"50":0,"75":0,"90":0,"95":0,"99":0,"99.5":0,"100":0},"propertyValue_circuitBreakerRequestVolumeThreshold":20,"propertyValue_circuitBreakerSleepWindowInMilliseconds":5000,"propertyValue_circuitBreakerErrorThresholdPercentage":50,"propertyValue_circuitBreakerForceOpen":false,"propertyValue_circuitBreakerForceClosed":false,"propertyValue_circuitBreakerEnabled":true,"propertyValue_executionIsolationStrategy":"THREAD","propertyValue_executionIsolationThreadTimeoutInMilliseconds":1000,"propertyValue_executionTimeoutInMilliseconds":1000,"propertyValue_executionIsolationThreadInterruptOnTimeout":true,"propertyValue_executionIsolationThreadPoolKeyOverride":null,"propertyValue_executionIsolationSemaphoreMaxConcurrentRequests":10,"propertyValue_fallbackIsolationSemaphoreMaxConcurrentRequests":10,"propertyValue_metricsRollingStatisticalWindowInMilliseconds":10000,"propertyValue_requestCacheEnabled":true,"propertyValue_requestLogEnabled":true,"reportingHosts":1,"threadPool":"UserService"}

data: {"type":"HystrixThreadPool","name":"UserService","currentTime":1566373945292,"currentActiveCount":0,"currentCompletedTaskCount":38,"currentCorePoolSize":10,"currentLargestPoolSize":10,"currentMaximumPoolSize":10,"currentPoolSize":10,"currentQueueSize":0,"currentTaskCount":38,"rollingCountThreadsExecuted":0,"rollingMaxActiveThreads":0,"rollingCountCommandRejections":0,"propertyValue_queueSizeRejectionThreshold":5,"propertyValue_metricsRollingStatisticalWindowInMilliseconds":10000,"reportingHosts":1}

ping:
从上面的输出可以看到,这样的纯字符输出可读性实在太差,这还只是我稍微截取了一点,不然的话直接占满屏幕。于是Netflix又开发了一个开源项目(Dashboard)来可视化这些数据,帮助运维人员更直观的了解系统的当前状态。
案例搭建
示例代码
启动注册中Eureka,hystrix-consumer消费方,hystrix-provider提供方
Hystrix Dashboard( 断路器仪表盘)
1.添加依赖
 <!--自省和监控的集成功能-->
        <dependency>
            <groupId>org.springframework.boot</groupId>
            <artifactId>spring-boot-starter-actuator</artifactId>
        </dependency>

<!--断路器仪表盘-->
        <dependency>
            <groupId>org.springframework.cloud</groupId>
            <artifactId>spring-cloud-starter-netflix-hystrix-dashboard</artifactId>
        </dependency>
        <!--断路器-->
        <dependency>
            <groupId>org.springframework.cloud</groupId>
            <artifactId>spring-cloud-starter-netflix-hystrix</artifactId>
        </dependency>
2.application.yml 配置文件
server:
  port: 6001

eureka:
  client:
    service-url:
      defaultZone: http://eureka7001:7001/eureka
spring:
  application:
    name: hystrix-dashboard
3、启动HystrixDashboardApplication服务
package net.riking.springcloud.hystrixdashboard;

import org.springframework.boot.SpringApplication;
import org.springframework.boot.autoconfigure.SpringBootApplication;
import org.springframework.cloud.client.discovery.EnableDiscoveryClient;
import org.springframework.cloud.netflix.hystrix.dashboard.EnableHystrixDashboard;

@SpringBootApplication
@EnableDiscoveryClient
@EnableHystrixDashboard  //开启Hystrix仪表盘
public class HystrixDashboardApplication {

    public static void main(String[] args) {
        SpringApplication.run(HystrixDashboardApplication.class, args);
    }
}
启动工程后,访问:http://localhost:6001/hystrix,可以看到下面的页面
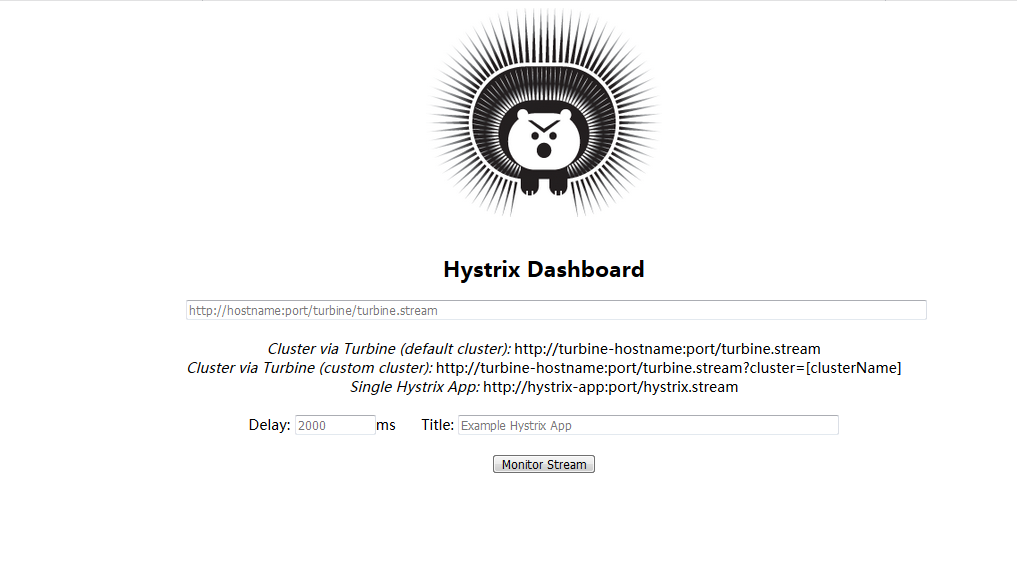
图中会有一些提示:
Cluster via Turbine (default cluster): http://turbine-hostname:port/turbine.stream    ----查看默认集群地址示例
Cluster via Turbine (custom cluster): http://turbine-hostname:port/turbine.stream?cluster=[clusterName]   ----查看指定集群地址示例
Single Hystrix App: http://hystrix-app:port/hystrix.stream   ---查看单个应用的监控地址示例
4.验证
我们暂时只演示单个应用,将hystrix-consumer消费方项目的查看监控数据地址输入(http://localhost:9001/hystrix.stream),在title里任意输入一个监控名称test,点击Monitor Stream按钮,效果如下图(须先运行至少一次消费方服务接口才能显示数据,否则无监控数据)
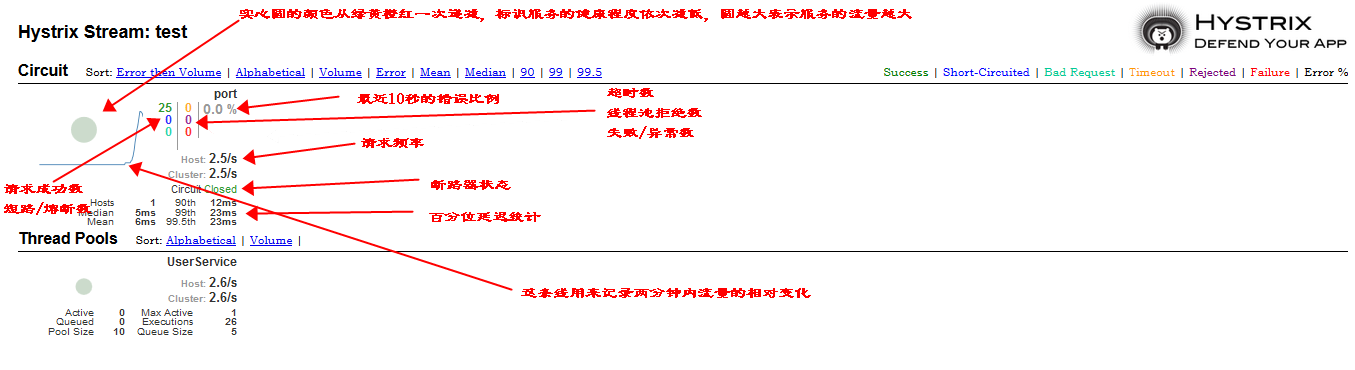
上图其实就是http://localhost:6001/hystrix.stream返回结果图形化显示,想更深的了解图上每个指标的含义请点击进入
Turbine(聚合监控)
由于集群方式,所以我们在hystrix-consumer消费方代码上修改端口号为9002后再次启动(启动方式参考:点击进入)
1.添加依赖
    <!--自省和监控的集成功能-->
     <dependency>
         <groupId>org.springframework.boot</groupId>
         <artifactId>spring-boot-starter-actuator</artifactId>
     </dependency>

     <!--集群监控-->
    <dependency>
        <groupId>org.springframework.cloud</groupId>
        <artifactId>spring-cloud-starter-netflix-turbine</artifactId>
    </dependency>
    </dependency>
    <!--断路器-->
    <dependency>
        <groupId>org.springframework.cloud</groupId>
        <artifactId>spring-cloud-starter-netflix-hystrix</artifactId>
    </dependency>
2.application.yml 配置文件
server:
  port: 6002

eureka:
  client:
    service-url:
      defaultZone: http://eureka7001:7001/eureka
spring:
  application:
    name: turbine

turbine:
  # 监控的应用名称,多个以逗号隔开
  app-config: consumer
  aggregator:
    # 指定聚合哪些集群,默认为 default
    clusterConfig: default
  # 指定集群名称为 default
  clusterNameExpression: new String("default")
3、启动TurbineApplication服务
package net.riking.springcloud.turbine;

import org.springframework.boot.SpringApplication;
import org.springframework.boot.autoconfigure.SpringBootApplication;
import org.springframework.cloud.client.discovery.EnableDiscoveryClient;
import org.springframework.cloud.netflix.turbine.stream.EnableTurbineStream;

@SpringBootApplication
@EnableDiscoveryClient
@EnableTurbine    //开启Turbine支持,用来进行集群监控
public class TurbineApplication {
    public static void main(String[] args) {
        SpringApplication.run(TurbineApplication.class, args);
    }
}
4.验证
启动工程后,访问:http://localhost:6001/hystrix 并且输入监控数据地址(http://localhost:6002/turbine.stream),可以看到下面的页面
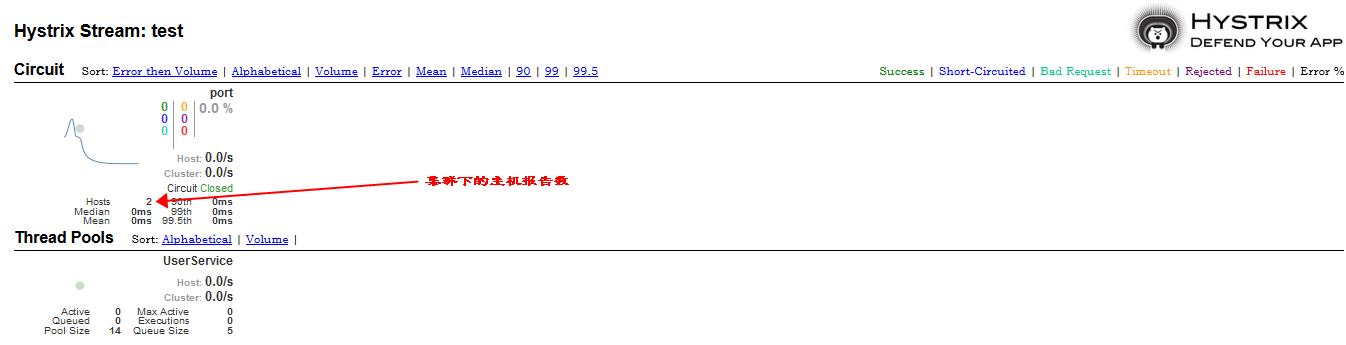
不同服务下的集群监控,在我会放在下章。
转载于:https://www.cnblogs.com/kongliuyi/p/11389499.html
最后
以上就是自由金毛最近收集整理的关于服务监控(Hystrix Dashboard、Turbine)八:环境搭建背景案例搭建的全部内容,更多相关服务监控(Hystrix内容请搜索靠谱客的其他文章。


发表评论 取消回复