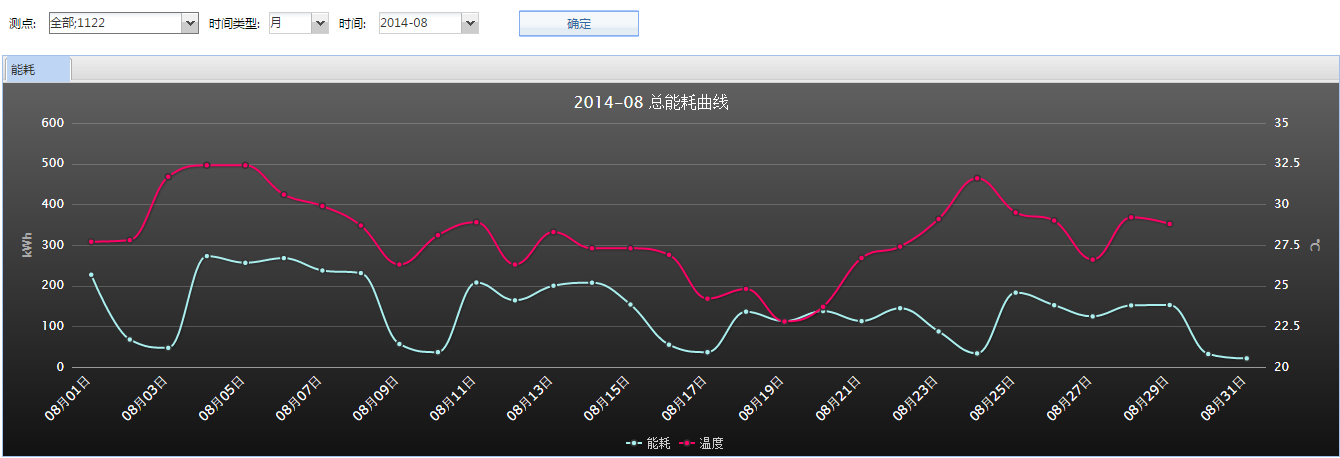
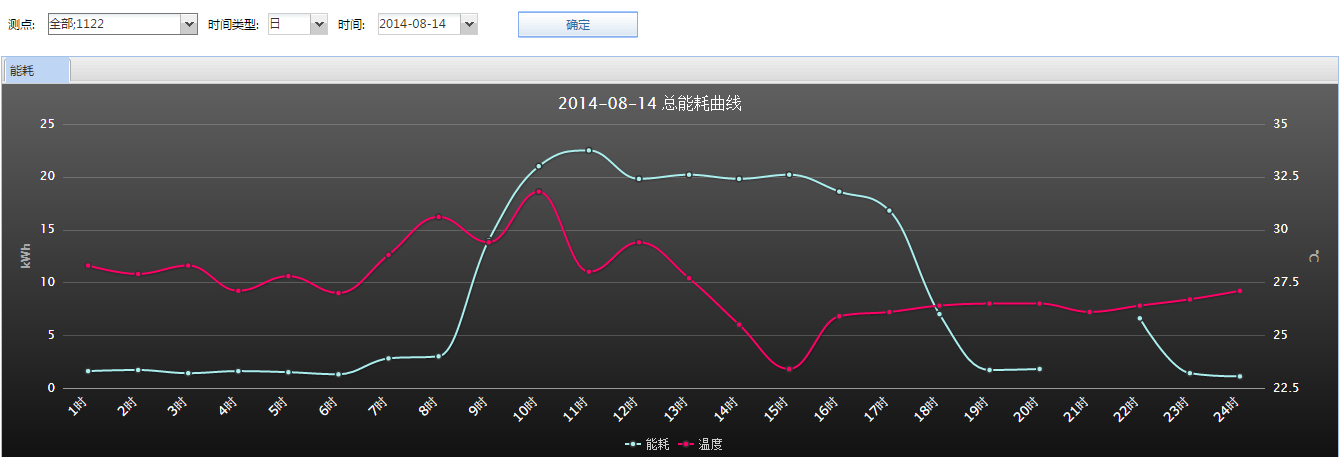
Highcharts是一款纯javascript编写的图表库,能够很简单便捷地在Web网站或Web应用中添加交互性的图表,Highcharts目前支持直线图、曲线图、面积图、柱状图、饼图、散点图等多达18种不同类型的图表,功能强大、简单易用,并且开源免费。笔者曾经在多个能耗管理系统中使用到了它,为了满足各种图表显示要求,也算是历经磨难。
有关于基础的使用方法和完整的API请查看Highcharts中文网,本系列着重讲解用到过的一些略微复杂的场景。开场先上简单的,第一篇将讲显示多条曲线。
呈现的效果如下:
先上JS代码
<script type="text/javascript">
function chartsCommon(renderTo, chartType) {
return {
chart: {
zoomType: 'x',
resetZoomButton: {
theme: {
fill: 'white',
stroke: 'silver',
r: 0,
states: {
hover: {
fill: '#000',
style: {
color: 'white'
}
}
}
}
},
renderTo: renderTo,
plotBackgroundColor: null,
plotBorderWidth: null,
height: 382,
plotShadow: false,
type: chartType == false ? 'spline' : chartType
},
title: {
text: '',
x: -20
},
subtitle: {
text: '',
x: -20
},
xAxis: {
categories: [],
tickLength: 0, //主刻度的长度
tickWidth: 0, // 主刻度的宽度
startOnTick:true,
labels: {
step: 1, //步长,可以跳格
rotation: -45,
align: 'right',
style: {
fontSize: '13px',
fontFamily: 'Verdana, sans-serif'
}
}
},
yAxis: [{ // Primary yAxis
title: {
text: 'kWh'
},
labels: {
format: '{value} kWh'
}//,
//min: 0 // 如果y不可能出现负数,则以0为最小值
}, { // Secondary yAixs
title: {
text: '°C'
},
labels: {
format: '{value} °C'
},
opposite: true // Y轴分立两侧
}],
plotOptions: {
//曲线图
spline: {
marker: {
radius: 3,
//fillColor: '#FFFFFF',
//lineColor: '#666666',
lineWidth: 1.5,
symbol: 'circle'
}
//enableMouseTracking: false
}
},
tooltip: {
crosshairs: true,
shared: true
},
legend: {
borderWidth: 0
},
exporting: {
enabled: false
},
series: []
};
}- zoomType: ‘x’ 表示支持x轴放大缩小
- resetZoomButton 表示显示恢复原图的按钮
- 设置2根Y轴,并分立左右就是如下代码:
yAxis: [{ // Primary yAxis
title: {
text: 'kWh'
},
labels: {
format: '{value} kWh'
}//,
//min: 0 // 如果y不可能出现负数,则以0为最小值
}, { // Secondary yAixs
title: {
text: '°C'
},
labels: {
format: '{value} °C'
},
opposite: true // Y轴分立两侧
}]
后台当然就要获取到两条曲线的数据
Highcharts highcharts = new Highcharts();
XAxis XAxis = new XAxis() { };
List<Series> listSeries = new List<Series>();
List<string> Categories = new List<string>();
List<object> values = new List<object>();
List<object> ValuesTemp = new List<object>(); // 温度
List<DbParam> HashKey = new List<DbParam>();
List<DbParam> HashKeyTemp = new List<DbParam>(); // 温度
// 能耗数据
string sSQL = @"exec getConsumptionChartData beginTime, endTime, type, back";
DbParam[] parms = new DbParam[] {
new DbParam("beginTime",time),
new DbParam("endTime",timeEnd),
new DbParam("type",timeType) ,
new DbParam("back",backid)
};
DataTable ds = DB.ExecuteDataTable(sSQL, parms);
CategoriesValueSet(ref HashKey, 0, time, timeEnd, timeTypeID, hourFrom, hourEnd);
if (ds != null && ds.Rows.Count > 0)
{
object value;
for (int i = 0; i < ds.Rows.Count; i++)
{
value = string.Empty;
// 能耗值
if (!Convert.IsDBNull(ds.Rows[i]["ep"]))
value = Convert.ToDecimal(ds.Rows[i]["ep"]).ToString("f2");
CategoriesValueSetSingleData(ref HashKey, value, ds.Rows[i]["gettime"].ToStr(), timeTypeID);
}
}
foreach (var item in HashKey)
{
Categories.Add(item.Name);
values.Add(item.Value);
}
listSeries.Add(new Series()
{
Name = "能耗",
Data = new HighchartsModel.Helpers.Data(values.ToArray())
});
// 温度数据
int outdoorSensorID = 2063;
sSQL = @"exec getTemperatureChartData beginTime, endTime, type, back";
parms = new DbParam[] {
new DbParam("beginTime",time),
new DbParam("endTime",timeEnd),
new DbParam("type",timeType) ,
new DbParam("back",outdoorSensorID)
};
ds = DB.ExecuteDataTable(sSQL, parms);
CategoriesValueSet(ref HashKeyTemp, 0, time, timeEnd, timeTypeID, hourFrom, hourEnd);
if (ds != null && ds.Rows.Count > 0)
{
object value;
for (int i = 0; i < ds.Rows.Count; i++)
{
value = string.Empty;
if (!Convert.IsDBNull(ds.Rows[i]["temp"]))
value = Convert.ToDecimal(ds.Rows[i]["temp"]).ToString("f1");
CategoriesValueSetSingleData(ref HashKeyTemp, value, ds.Rows[i]["gettime"].ToStr(), timeTypeID);
}
}
foreach (var item in HashKeyTemp)
{
Categories.Add(item.Name);
ValuesTemp.Add(item.Value);
}
listSeries.Add(new Series()
{
Name = "温度",
YAxis = 1,
Data = new HighchartsModel.Helpers.Data(ValuesTemp.ToArray())
});
XAxis.Categories = Categories.ToArray();
highcharts.SetXAxis(XAxis);
highcharts.SetSeries(listSeries.ToArray());
string highchartsJson = highcharts.GetOptionsJSON();
return @"{ ""Highcharts"":" + highchartsJson + "}";
持续更新中。。。
玩转Highcharts图表库系列(一) 显示多条曲线
玩转Highcharts图表库系列(二) 沿X轴设置不同的背景色分辨带
玩转Highcharts图表库系列(三) 给曲线加上点击事件
玩转Highcharts图表库系列(四) 散点图和曲线图的混合显示
最后
以上就是阔达树叶最近收集整理的关于玩转Highcharts图表库系列(一) 显示多条曲线的全部内容,更多相关玩转Highcharts图表库系列(一)内容请搜索靠谱客的其他文章。
本图文内容来源于网友提供,作为学习参考使用,或来自网络收集整理,版权属于原作者所有。


发表评论 取消回复