直接看源码代码:
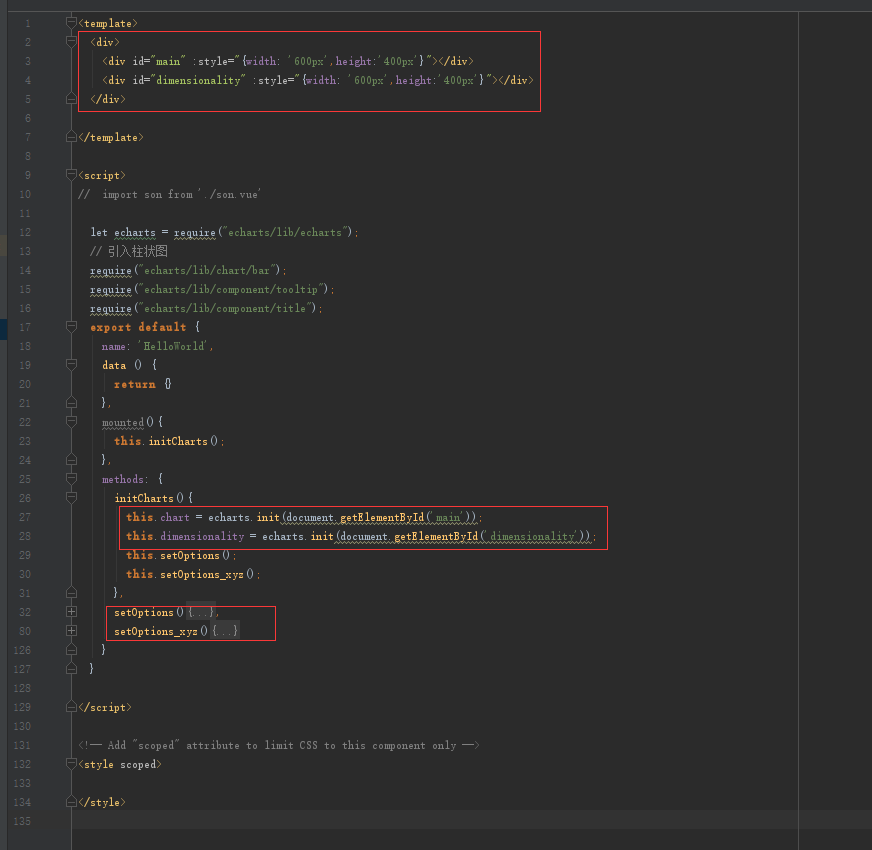
<template>
  <div>
    <div id="main" :style="{width: '600px',height:'400px'}"></div>
    <div id="dimensionality" :style="{width: '600px',height:'400px'}"></div>
  </div>

</template>

<script>
  let echarts = require("echarts/lib/echarts");
  // 引入柱状图
  require("echarts/lib/chart/bar");
  require("echarts/lib/component/tooltip");
  require("echarts/lib/component/title");
  export default {
    name: 'HelloWorld',
    data () {
      return {}
    },
    mounted(){
      this.initCharts();
    },
    methods: {
      initCharts(){
        this.chart = echarts.init(document.getElementById('main'));
        this.dimensionality = echarts.init(document.getElementById('dimensionality'));
        this.setOptions();
        this.setOptions_xyz();
      },
      setOptions(){
        this.chart.setOption({
          title: {
            text: '折线图堆叠'
          },
          tooltip: {
            trigger: 'axis'
          },
          grid: {
            left: '3%',
            right: '4%',
            bottom: '3%',
            containLabel: true
          },
          toolbox: {
            feature: {
              saveAsImage: {}
            }
          },
          xAxis: {
            type: 'category',
            boundaryGap: false,
            data: ['4-5', '4-6', '4-7', '4-8', '4-9']
          },
          yAxis: {
            type: 'value',
            min:60,
            max:180
          },
          series: [
            {
              name: '学',
              type: 'line',
              data: [160, 132, 101, 120, 140]
            },
            {
              name: '习',
              type: 'line',
              data: [100, 102, 141, 154, 100]
            },
            {
              name: '能',
              type: 'line',
              data: [150, 122, 101, 134, 90]
            }
          ]
        })
      },
      setOptions_xyz(){
        this.dimensionality.setOption({
          title: {
            text: '基础雷达图'
          },
          tooltip: {},
          legend: {
            data: ['预算分配(Allocated Budget)', '实际开销(Actual Spending)']
          },
          radar: {
            // shape: 'circle',
            name: {
              textStyle: {
                color: '#fff',
                backgroundColor: '#999',
                borderRadius: 3,
                padding: [3, 5]
              }
            },
            indicator: [
              { name: '销售(sales)', max: 6500},
              { name: '管理(Administration)', max: 16000},
              { name: '信息技术(Information Techology)', max: 30000},
              { name: '客服(Customer Support)', max: 38000},
              { name: '研发(Development)', max: 52000},
              { name: '市场(Marketing)', max: 25000}
            ]
          },
          series: [{
            name: '预算 vs 开销(Budget vs spending)',
            type: 'radar',
            // areaStyle: {normal: {}},
            data : [
              {
                value : [4300, 10000, 28000, 35000, 50000, 19000],
                name : '预算分配(Allocated Budget)'
              },
              {
                value : [5000, 14000, 28000, 31000, 42000, 21000],
                name : '实际开销(Actual Spending)'
              }
            ]
          }]

        })
      }
    }
  }

</script>

<!-- Add "scoped" attribute to limit CSS to this component only -->
<style scoped>

</style>
最后
以上就是漂亮金毛最近收集整理的关于在vue-lic里面显示多个Echarts图表的全部内容,更多相关在vue-lic里面显示多个Echarts图表内容请搜索靠谱客的其他文章。
本图文内容来源于网友提供,作为学习参考使用,或来自网络收集整理,版权属于原作者所有。


发表评论 取消回复