工程数据分析实验1
用Matlab进行数据分析, 绘图
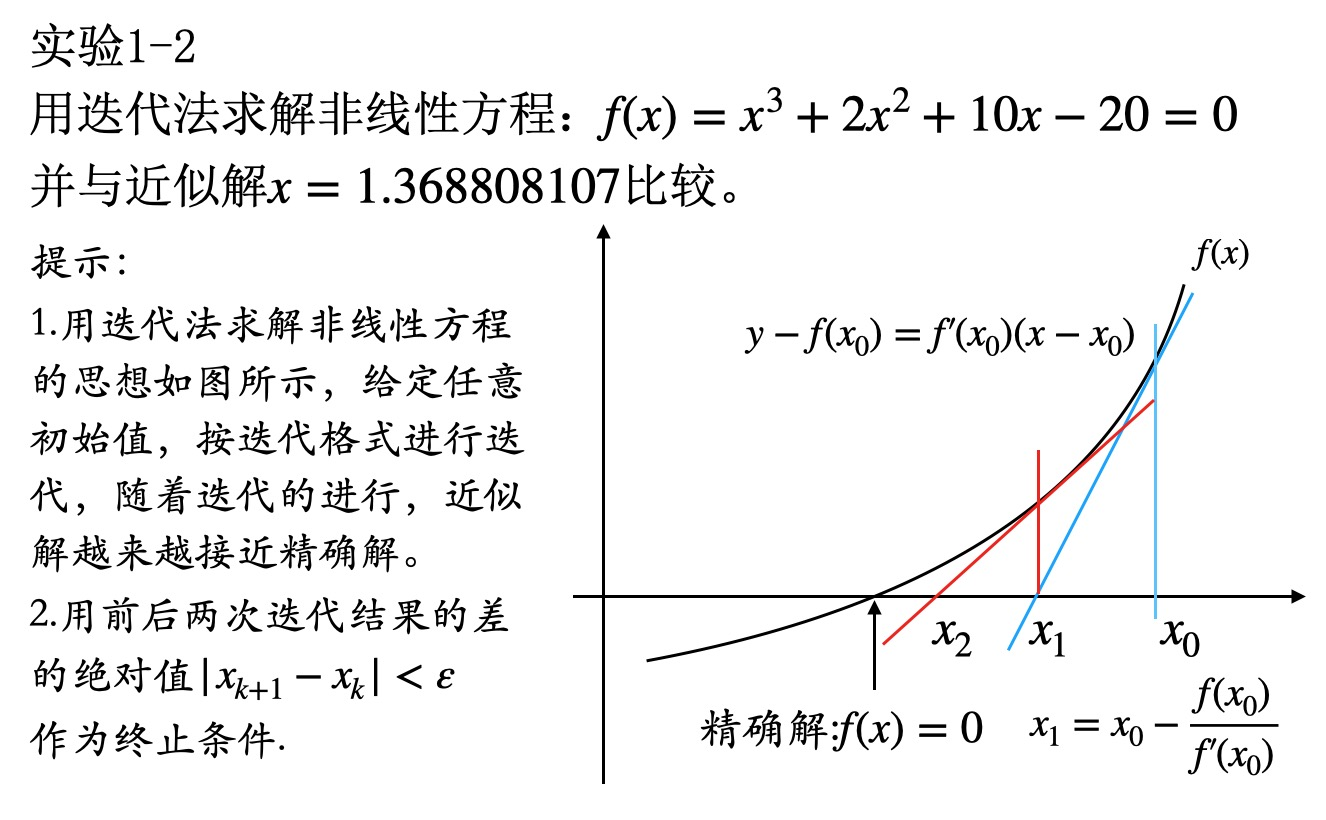
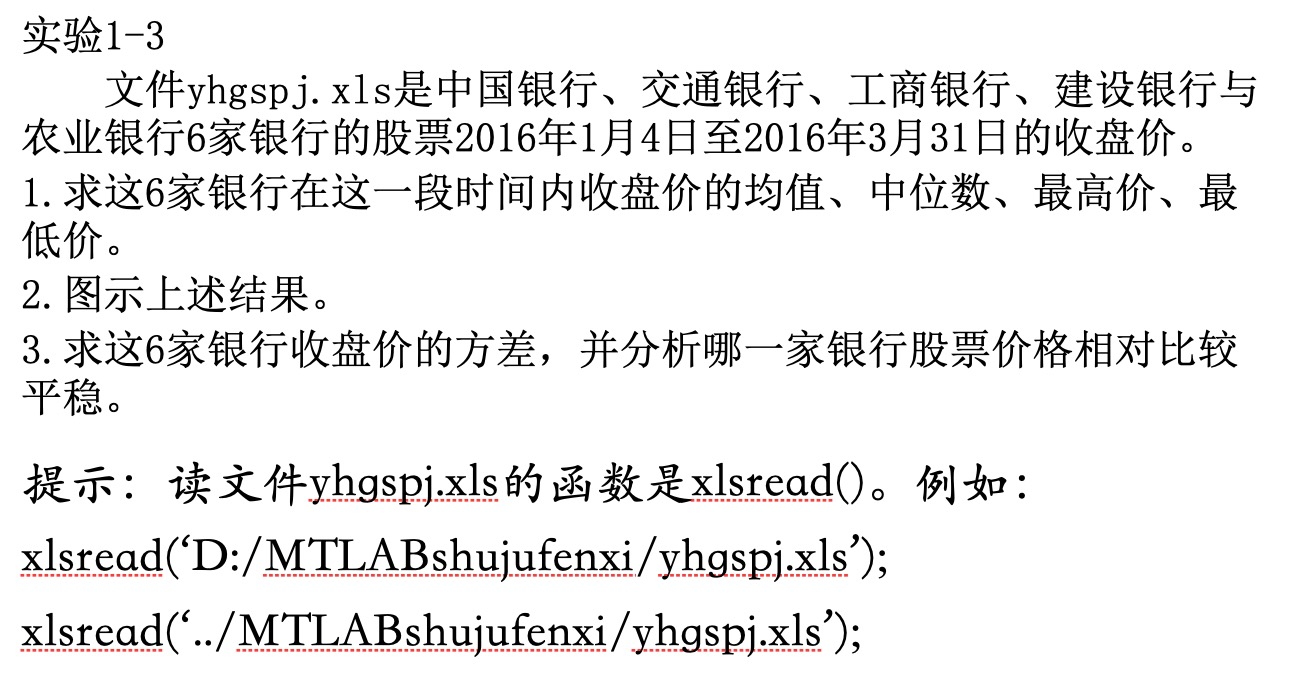
实验内容
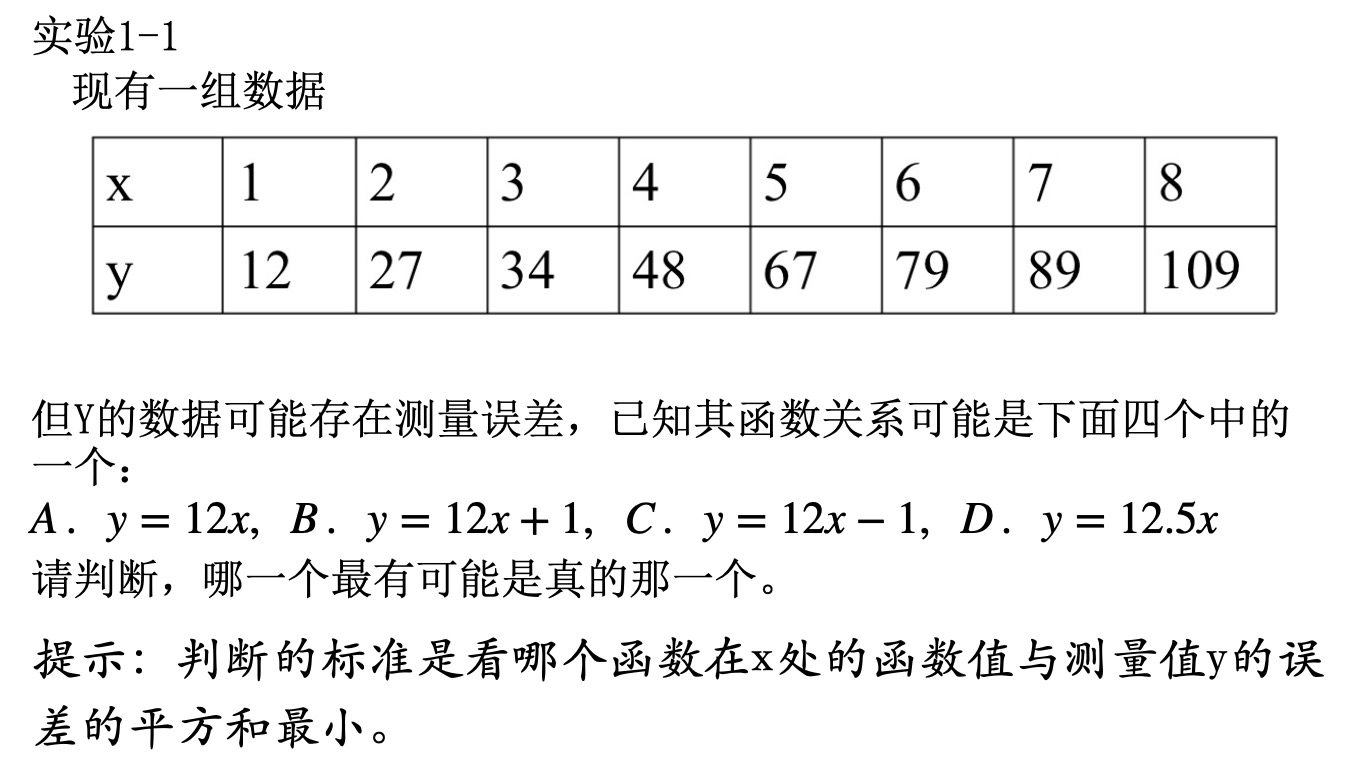
x = 1:8;
y = [12 27 34 48 67 79 89 109];

y1 = 12.*x;
y2 = 12.*x+1;
y3 = 12.*x-1;
y4 = 12.5.*x;

m1 = sum((y1-y).^2);
m2 = sum((y2-y).^2);
m3 = sum((y3-y).^2);
m4 = sum((y4-y).^2);

m = [m1,m2,m3,m4]
n = min(m);
for i = 1:4
    if m(i) == n
       fprintf("误差的平方和最小的为第%d个函数关系n",i);
    end
end
x = newton(1.500, 0.000000001, 1000000);
fprintf('近似解为x=%0.10fn',x);
fprintf("n");

% 牛顿迭代函数(用于求非线性方程的近似解)
function x=newton(x,c,N)
    for i=1:N
        f = x.^3 + 2.*x.^2+10.*x-20;
        df = 3.*x.^2+4.*x+10;
        x1 = x-f./df;
        if abs(x1-x)<c
            break;
        end
        x=x1;
    end
end
xls1 = xlsread('yhgspj.xls');

% 均值
fprintf('求各列均值n');
M = mean(xls1,1)

% 中位数
fprintf('求各列中位数n');
m = median(xls1,1)

% 最高价
fprintf('求各列最高价n');
max1 = max(xls1)

% 最低价
fprintf('求各列最低价n');
min1 = min(xls1)

% 用条形图绘制
d = [M;m;max1;min1];
% a = ['均值';'中位数';'最大值';'最小值'];
% b = bar(d);
createp(d);


% 求方差
fprintf('求各列方差n');
V = var(xls1)
% S = std(xls1)

bank = ['中国银行','交通银行','工商银行','建设银行','农业银行'];
minbank = min(V);
n = length(V);
for i=1:n
    if V(i) == minbank
        switch(i)
            case 1
                ss = bank(1:4);
                break;
            case 2
                ss = bank(5:8);
                break;
            case 3
                ss = bank(9:12);
                break;
            case 4
                ss = bank(13:16);
                break;
            otherwise
                ss = bank(17:end);
        end
        fprintf('从6家银行收盘价的方差来看, %s的股票价格相对平稳, 其方差最小: %0.4f',ss, minbank);
    end
end


% 绘画出6家银行的条形图函数
function createp(ymatrix1)
    %  YMATRIX1:  bar 矩阵数据
    % 创建 figure
    figure1 = figure;
    % 创建 axes
    axes1 = axes('Parent',figure1,...
        'Position',[0.0742857142857143 0.0571428571428572 0.868571428571428 0.878095238095239]);
    hold(axes1,'on');

    % 使用 bar 的矩阵输入创建多行
    bar1 = bar(ymatrix1,'Parent',axes1);
    set(bar1(5),'DisplayName','农业银行');
    set(bar1(4),'DisplayName','建设银行');
    set(bar1(3),'DisplayName','工商银行');
    set(bar1(2),'DisplayName','交通银行');
    set(bar1(1),'DisplayName','中国银行');

    % 创建 ylabel
    ylabel({'价格单位: 元'});

    % 创建 title
    title({'6家银行的收盘价'});

    box(axes1,'on');
    % 设置其余坐标区属性
    set(axes1,'XTick',[1 2 3 4],'XTickLabel',{'均值','中位数','最大值','最小值'});
    % 创建 legend
    legend1 = legend(axes1,'show');
    set(legend1,...
        'Position',[0.755595230339078 0.716507931966636 0.176785716329302 0.204761909303211]);
end
总代码
% 实验一
fprintf("实验一:n");
x = 1:8;
y = [12 27 34 48 67 79 89 109];

y1 = 12.*x;
y2 = 12.*x+1;
y3 = 12.*x-1;
y4 = 12.5.*x;

m1 = sum((y1-y).^2);
m2 = sum((y2-y).^2);
m3 = sum((y3-y).^2);
m4 = sum((y4-y).^2);

m = [m1,m2,m3,m4]
n = min(m);
for i = 1:4
    if m(i) == n
       fprintf("误差的平方和最小的为第%d个函数关系n",i);
    end
end
fprintf("n");

% 实验二
fprintf("实验二:n");
x = newton(1.500, 0.000000001, 1000000);
fprintf('近似解为x=%0.10fn',x);
fprintf("n");


% 实验三
fprintf("实验三:n");
xls1 = xlsread('yhgspj.xls');

% 均值
fprintf('求各列均值n');
M = mean(xls1,1)

% 中位数
fprintf('求各列中位数n');
m = median(xls1,1)

% 最高价
fprintf('求各列最高价n');
max1 = max(xls1)

% 最低价
fprintf('求各列最低价n');
min1 = min(xls1)

% 用条形图绘制
d = [M;m;max1;min1];
% a = ['均值';'中位数';'最大值';'最小值'];
% b = bar(d);
createp(d);


% 求方差
fprintf('求各列方差n');
V = var(xls1)
% S = std(xls1)

bank = ['中国银行','交通银行','工商银行','建设银行','农业银行'];
minbank = min(V);
n = length(V);
for i=1:n
    if V(i) == minbank
        switch(i)
            case 1
                ss = bank(1:4);
                break;
            case 2
                ss = bank(5:8);
                break;
            case 3
                ss = bank(9:12);
                break;
            case 4
                ss = bank(13:16);
                break;
            otherwise
                ss = bank(17:end);
        end
        fprintf('从6家银行收盘价的方差来看, %s的股票价格相对平稳, 其方差最小: %0.4f',ss, minbank);
    end
end


% 牛顿迭代函数(用于求非线性方程的近似解)
function x=newton(x,c,N)
    for i=1:N
        f = x.^3 + 2.*x.^2+10.*x-20;
        df = 3.*x.^2+4.*x+10;
        x1 = x-f./df;
        if abs(x1-x)<c
            break;
        end
        x=x1;
    end
end

% 绘画出6家银行的条形图函数
function createp(ymatrix1)
    %  YMATRIX1:  bar 矩阵数据
    % 创建 figure
    figure1 = figure;
    % 创建 axes
    axes1 = axes('Parent',figure1,...
        'Position',[0.0742857142857143 0.0571428571428572 0.868571428571428 0.878095238095239]);
    hold(axes1,'on');

    % 使用 bar 的矩阵输入创建多行
    bar1 = bar(ymatrix1,'Parent',axes1);
    set(bar1(5),'DisplayName','农业银行');
    set(bar1(4),'DisplayName','建设银行');
    set(bar1(3),'DisplayName','工商银行');
    set(bar1(2),'DisplayName','交通银行');
    set(bar1(1),'DisplayName','中国银行');

    % 创建 ylabel
    ylabel({'价格单位: 元'});

    % 创建 title
    title({'6家银行的收盘价'});

    box(axes1,'on');
    % 设置其余坐标区属性
    set(axes1,'XTick',[1 2 3 4],'XTickLabel',{'均值','中位数','最大值','最小值'});
    % 创建 legend
    legend1 = legend(axes1,'show');
    set(legend1,...
        'Position',[0.755595230339078 0.716507931966636 0.176785716329302 0.204761909303211]);
end
输出结果 :
>> s1
实验一:
m =
305 247 379 140
误差的平方和最小的为第4个函数关系
实验二:
近似解为x=1.3688081078
实验三:
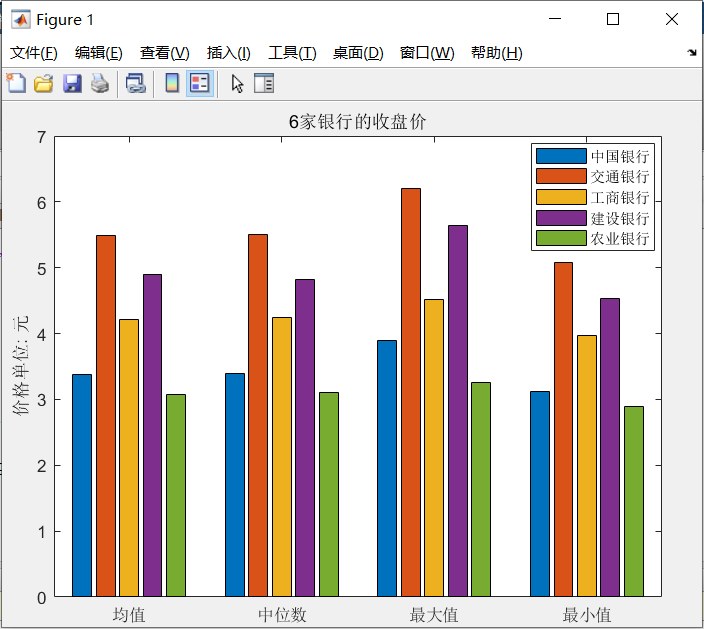
求各列均值
M =
3.3820 5.4937 4.2080 4.9017 3.0805
求各列中位数
m =
3.3900 5.5000 4.2500 4.8200 3.1100
求各列最高价
max1 =
3.8900 6.2100 4.5100 5.6400 3.2500
求各列最低价
min1 =
3.1200 5.0800 3.9700 4.5300 2.8900
求各列方差
V =
0.0364 0.0681 0.0208 0.0710 0.0110
从6家银行收盘价的方差来看, 农业银行的股票价格相对平稳, 其方差最小: 0.0110>>
条形图 :
附加数据表格
表格数据(Excel) : yhgspj.xls
| 日期 | 中国银行(601988) | 交通银行(601328) | 工商银行(601398) | 建设银行(601939) | 农业银行(601288) |
|---|---|---|---|---|---|
| 2016/3/31 | 3.4 | 5.57 | 4.29 | 4.85 | 3.2 |
| 2016/3/30 | 3.4 | 5.58 | 4.32 | 4.9 | 3.2 |
| 2016/3/29 | 3.34 | 5.46 | 4.25 | 4.81 | 3.15 |
| 2016/3/28 | 3.35 | 5.5 | 4.3 | 4.82 | 3.15 |
| 2016/3/25 | 3.36 | 5.51 | 4.28 | 4.84 | 3.16 |
| 2016/3/24 | 3.35 | 5.51 | 4.26 | 4.83 | 3.16 |
| 2016/3/23 | 3.39 | 5.59 | 4.3 | 4.88 | 3.18 |
| 2016/3/22 | 3.4 | 5.61 | 4.29 | 4.89 | 3.18 |
| 2016/3/21 | 3.43 | 5.65 | 4.31 | 4.9 | 3.21 |
| 2016/3/18 | 3.43 | 5.66 | 4.3 | 4.86 | 3.22 |
| 2016/3/17 | 3.43 | 5.72 | 4.29 | 4.87 | 3.21 |
| 2016/3/16 | 3.44 | 5.77 | 4.32 | 4.86 | 3.25 |
| 2016/3/15 | 3.38 | 5.63 | 4.26 | 4.81 | 3.19 |
| 2016/3/14 | 3.4 | 5.49 | 4.3 | 4.8 | 3.19 |
| 2016/3/11 | 3.4 | 5.49 | 4.34 | 4.76 | 3.19 |
| 2016/3/10 | 3.35 | 5.4 | 4.32 | 4.76 | 3.15 |
| 2016/3/9 | 3.43 | 5.53 | 4.41 | 4.77 | 3.21 |
| 2016/3/8 | 3.4 | 5.52 | 4.33 | 4.79 | 3.18 |
| 2016/3/7 | 3.39 | 5.5 | 4.29 | 4.81 | 3.18 |
| 2016/3/4 | 3.4 | 5.53 | 4.31 | 4.84 | 3.2 |
| 2016/3/3 | 3.28 | 5.33 | 4.13 | 4.71 | 3.08 |
| 2016/3/2 | 3.26 | 5.31 | 4.11 | 4.7 | 3.05 |
| 2016/3/1 | 3.2 | 5.18 | 4.03 | 4.57 | 2.99 |
| 2016/2/29 | 3.17 | 5.17 | 4.03 | 4.53 | 2.99 |
| 2016/2/26 | 3.15 | 5.16 | 4.02 | 4.62 | 2.96 |
| 2016/2/25 | 3.12 | 5.08 | 4.01 | 4.57 | 2.92 |
| 2016/2/24 | 3.24 | 5.32 | 4.05 | 4.73 | 2.98 |
| 2016/2/23 | 3.24 | 5.32 | 4.05 | 4.73 | 2.98 |
| 2016/2/22 | 3.29 | 5.39 | 4.08 | 4.78 | 3 |
| 2016/2/19 | 3.22 | 5.28 | 4.02 | 4.69 | 2.95 |
| 2016/2/18 | 3.23 | 5.27 | 4.06 | 4.72 | 2.97 |
| 2016/2/17 | 3.24 | 5.28 | 4.04 | 4.73 | 2.97 |
| 2016/2/16 | 3.23 | 5.28 | 4.05 | 4.73 | 2.94 |
| 2016/2/15 | 3.13 | 5.15 | 3.97 | 4.62 | 2.89 |
| 2016/2/5 | 3.18 | 5.2 | 4.01 | 4.69 | 2.92 |
| 2016/2/4 | 3.19 | 5.21 | 4.02 | 4.71 | 2.93 |
| 2016/2/3 | 3.17 | 5.17 | 4.01 | 4.68 | 2.92 |
| 2016/2/2 | 3.2 | 5.25 | 4.05 | 4.73 | 2.96 |
| 2016/2/1 | 3.17 | 5.2 | 4.03 | 4.7 | 2.94 |
| 2016/1/29 | 3.22 | 5.35 | 4.1 | 4.81 | 2.99 |
| 2016/1/28 | 3.16 | 5.22 | 4.05 | 4.75 | 2.91 |
| 2016/1/27 | 3.22 | 5.25 | 4.11 | 4.83 | 2.95 |
| 2016/1/26 | 3.24 | 5.23 | 4.08 | 4.87 | 2.95 |
| 2016/1/25 | 3.44 | 5.52 | 4.23 | 5.07 | 3.1 |
| 2016/1/22 | 3.45 | 5.52 | 4.22 | 5.05 | 3.11 |
| 2016/1/21 | 3.43 | 5.48 | 4.18 | 5.03 | 3.09 |
| 2016/1/20 | 3.47 | 5.55 | 4.22 | 5.09 | 3.11 |
| 2016/1/19 | 3.53 | 5.63 | 4.25 | 5.15 | 3.11 |
| 2016/1/18 | 3.46 | 5.52 | 4.19 | 5.04 | 3.07 |
| 2016/1/15 | 3.48 | 5.56 | 4.23 | 5.09 | 3.07 |
| 2016/1/14 | 3.59 | 5.76 | 4.31 | 5.21 | 3.12 |
| 2016/1/13 | 3.58 | 5.75 | 4.3 | 5.2 | 3.12 |
| 2016/1/12 | 3.63 | 5.81 | 4.32 | 5.27 | 3.13 |
| 2016/1/11 | 3.65 | 5.8 | 4.32 | 5.3 | 3.09 |
| 2016/1/8 | 3.8 | 6.03 | 4.46 | 5.54 | 3.16 |
| 2016/1/7 | 3.79 | 5.94 | 4.43 | 5.49 | 3.11 |
| 2016/1/6 | 3.89 | 6.21 | 4.51 | 5.64 | 3.18 |
| 2016/1/5 | 3.86 | 6.16 | 4.47 | 5.58 | 3.16 |
| 2016/1/4 | 3.87 | 6.07 | 4.45 | 5.6 | 3.12 |
以上是学习过程中的实验内容, 仅供学习参考, 可能有错误之处.
最后
以上就是大方香菇最近收集整理的关于【工程数据分析】实验一工程数据分析实验1的全部内容,更多相关【工程数据分析】实验一工程数据分析实验1内容请搜索靠谱客的其他文章。
本图文内容来源于网友提供,作为学习参考使用,或来自网络收集整理,版权属于原作者所有。


发表评论 取消回复