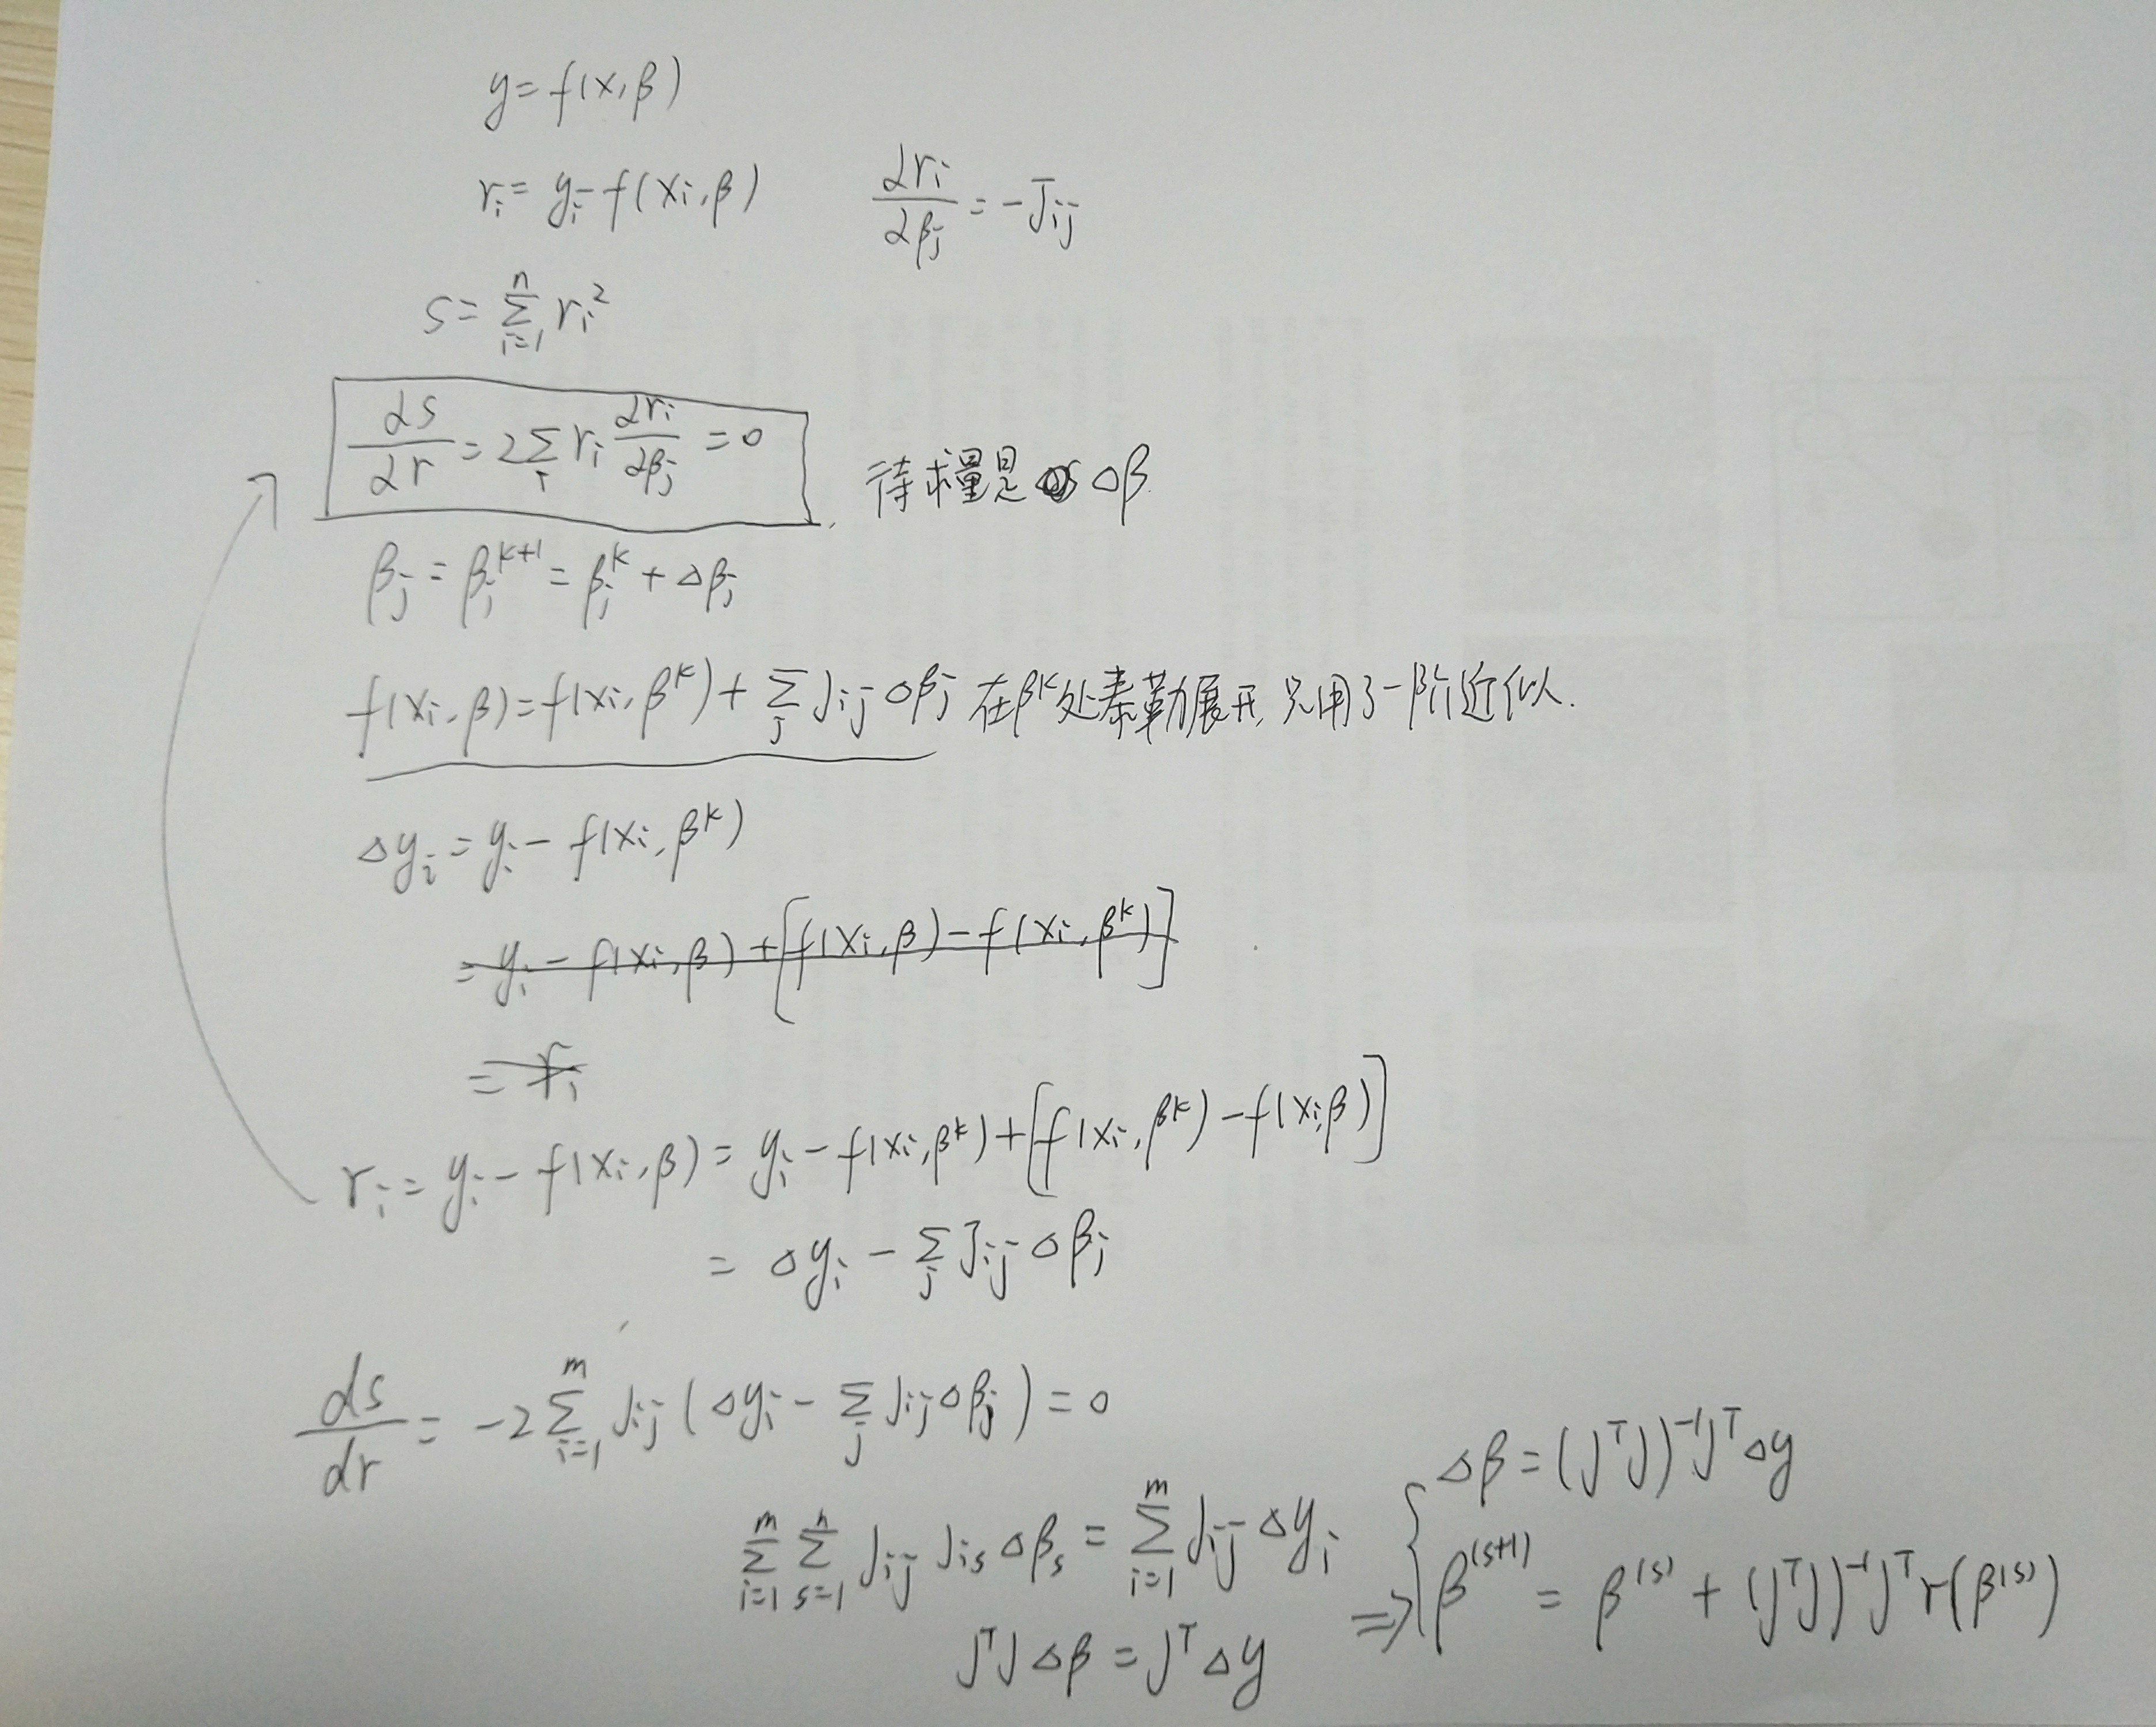
#include <iostream>
#include <fstream>

#include <opencv2/core/core.hpp>
#include <opencv2/highgui/highgui.hpp>
#include <Eigen/Core>
#include <Eigen/Dense>

using namespace std;


vector<int> getRandomSample(int n, int num)
{
    vector<int> sample;
    vector<int> total_set;
    for(int i = 0; i < n; ++i)
        total_set.push_back(i);
    for(int i = 0; i < num; ++i)
    {
        int j = rand()%total_set.size();
        sample.push_back( total_set[j] );
        total_set.erase( total_set.begin()+j );
    }
    return sample;
}

//k次函数
double funcX(double* a, double x, int k)
{
    double xx = 1.0;
    double y = 0;
    for(int i = 0; i < k; i++)
    {
        y = y + a[i]*xx;
        xx *= x;
    }
    return y;
}

vector<int> get_inliners(vector<cv::Point2d>& points, double* a, int k)
{
    double inlier_threshold = 5;
    vector<int> inliers;

    for(int i = 0; i < points.size(); i++)
    {
        cv::Point2d p = points[i];
        double y_predict = funcX(a, p.x, k);
        if( fabs(p.y - y_predict) < inlier_threshold)
            inliers.push_back( i );
    }
    cout << "inliers:" << inliers.size() << "n";
    return inliers;
}

bool estimateLine(vector<cv::Point2d>& points, vector<int>&active, double* a, int k)
{
    const double learning_rate = 0.1;
    const int N = active.size();
    double J[k*N] = {0};
    double residual[N] = {0};

    static double rr_last = 0;
    static int iter = 0;
    double rr = 0;

    for (size_t i = 0; i < N; i++)
    {
        cv::Point2d p = points[ active[i] ];
        double hx = funcX(a, p.x, k);
        double xx = 1;
        for(int j = 0; j < k; ++j)
        {
            J[k*i+j] = xx;
            xx *= p.x;
        }
        residual[i] = (p.y - hx);
        rr += residual[i]*residual[i];
    }

    rr /= N;
    //cout << " r = " << rr << "  ";
    if(fabs(rr-rr_last) < 1e-4 || iter > 50)
    {
        cout << " r = " << rr << "  ";
        return true;
    }
    rr_last = rr;

    //J^TJ * deltaA = J^T*r
    //H*deltaA = g*r

//    Eigen::Matrix2d H;
//    Eigen::Vector2d G;
//    Eigen::Vector2d deltaA;

    Eigen::Matrix3d H;
    Eigen::Vector3d G;
    Eigen::Vector3d deltaA;

    for(int j = 0; j < k; ++j)
    {
        for (int m = 0; m < k; ++m)
        {
            double h = 0;
            for (size_t i = 0; i < N; i++)
                h += J[k*i+m]*J[k*i+j];
            H(m,j) = h;
        }
        double g = 0;
        for (size_t i = 0; i < N; i++)
            g += J[k*i+j]*residual[i];
        G(j) = g;
    }

    deltaA = H.inverse() * G;

    for (int m = 0; m < k; ++m)
        a[m] += deltaA(m) * learning_rate;
    return false;
}


int main(int argc, char** argv)
{
    const int K = 3;

    srand((unsigned int)time(0));

    ofstream out;
    out.open("/home/ha/ws_ipython/my_ransac_line.txt");

    double a[K];
    cout << "a = ";
    for(int i = 0; i < K; i++)
    {
        a[i] = rand()%100/5.0 + 3;
        cout << a[i] << " ";
    }
    cout << "truen";

    vector<cv::Point2d> points;
    for(size_t i = 0; i < 20; ++i)
    {
        cv::Point2d p;
        p.x = i+rand()%10;
        p.y = funcX(a, p.x, K) + rand()%100/15.0 - rand()%100/15.0;
        points.push_back( p );
        out << "point1,"<<p.x<<","<<p.y<<endl;

        if( i%4 == 0)
        {
            p.x = i + 3 + rand()%20;
            p.y += rand()%100;
            points.push_back( p );
            out << "point1,"<<p.x<<","<<p.y<<endl;

            p.x = i - 3 + rand()%20;
            p.y += rand()%100;
            points.push_back( p );
            out << "point1,"<<p.x<<","<<p.y<<endl;
        }
    }

    vector<int> inliers;
    double best_a[K];
    for(int j = 0; j < 10; j++)
    {
        double a_result[K] = {1};
        for (int i = 0; i < K; ++i)
            a_result[i] = a[i] - 1.0;
        vector<int> samples = getRandomSample(points.size(), 5);

        while(true)
        {
            if(estimateLine(points, samples, a_result, K) )
                break;
        }
        vector<int> inliers_curr = get_inliners(points, a_result, K);
        if(inliers.size() < inliers_curr.size())
        {
            inliers = inliers_curr;
            for(int i = 0; i < K; i++)
                best_a[i] = a_result[i];
        }
    }

    for(vector<int>::iterator iter = inliers.begin(); iter != inliers.end(); ++iter)
        out << "point2,"<<points[*iter].x<<","<<points[*iter].y<<endl;
    //最后再来一次估计
    if(inliers.size() > 10)
    {
        vector<int> samples = getRandomSample(inliers.size(), 6);
        for(int i = 0; i < samples.size(); i++)
            samples[i] = inliers[i];
        while(true)
        {
            if(estimateLine(points, samples, best_a, K) )
                break;
        }
    }

    cout << " best a: ";
    for(int i = 0; i < K; i++)
        cout << best_a[i] << ",";
    cout <<endl;

    cout << "true ";
    for(int i = 0; i < K; i++)
        cout << a[i] << ",";
    cout <<endl;
    cout << "line ransac finished..n";
    return 1;
}
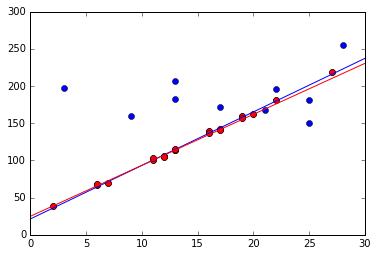
一次函数
import numpy as np
import matplotlib.pyplot as plt

file = open("my_ransac_line.txt");

datas1 = []
datas2 = []
while( True ):
    line = file.readline();
    if not line:
        break;
    if line.find("point") != -1:
        in_str = line[0:-1].split(",") #[0:-1]是为了去掉字符串后面的换行符号
        in_data = [float(i) for i in in_str[1::]]#去除第一个
        if line.find("point1") != -1:
            datas1.append(in_data)
        if line.find("point2") != -1:
            datas2.append(in_data)


for pos in datas1:
    plt.plot(pos[0], pos[1], c='b',marker="o")
for pos in datas2:
    plt.plot(pos[0], pos[1], c='r',marker="o")

trueA = [21.2, 7.2]
bestA = [24.7817,6.85777]
x = np.linspace(0,30,100)
y = trueA[1]*x + trueA[0]
plt.plot(x,y,'b') #真实曲线

y2 = bestA[1]*x + bestA[0]
plt.plot(x,y2,'r') #拟合出来的曲线

plt.show()
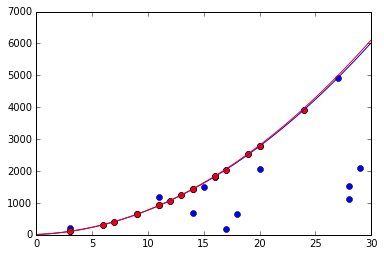
二次函数
import numpy as np
import matplotlib.pyplot as plt

file = open("my_ransac_line.txt");

datas1 = []
datas2 = []
while( True ):
    line = file.readline();
    if not line:
        break;
    if line.find("point") != -1:
        in_str = line[0:-1].split(",") #[0:-1]是为了去掉字符串后面的换行符号
        in_data = [float(i) for i in in_str[1::]]#去除第一个
        if line.find("point1") != -1:
            datas1.append(in_data)
        if line.find("point2") != -1:
            datas2.append(in_data)


for pos in datas1:
    plt.plot(pos[0], pos[1], c='b',marker="o")
for pos in datas2:
    plt.plot(pos[0], pos[1], c='r',marker="o")

trueA = [10,14.4,6.2]
bestA = [9.41402,13.1826,6.33986]
x = np.linspace(0,30,100)

y = trueA[2]*x*x + trueA[1]*x + trueA[0]
plt.plot(x,y,'b') #真实曲线

y2 = bestA[2]*x*x + bestA[1]*x + bestA[0]
plt.plot(x,y2,'r') #拟合出来的曲线

plt.show()
参考
// http://blog.csdn.net/haoliliang88/article/details/52932397
// https://en.wikipedia.org/wiki/Gauss%E2%80%93Newton_algorithm
最后
以上就是俭朴月亮最近收集整理的关于RANSAC 加Guass-newton拟合曲线的全部内容,更多相关RANSAC内容请搜索靠谱客的其他文章。
本图文内容来源于网友提供,作为学习参考使用,或来自网络收集整理,版权属于原作者所有。


发表评论 取消回复