函数Bar()–用于绘制柱状图
使用bar绘制柱状图的过程中涉及到中文字体的显示问题
使用动态参数配置方法,指定了中文黑体
import matplotlib as mpl
mpl.rcParams['font.sans-serif'] = ['SimHei']
换成中文字体之后又会遇到负号无法正常显示的情况,因此增加了第二行配置
mpl.rcParams['axes.unicode_minus'] = False
先来看下如果没有上面两行参数的情况
可以看到中文无法正常显示:
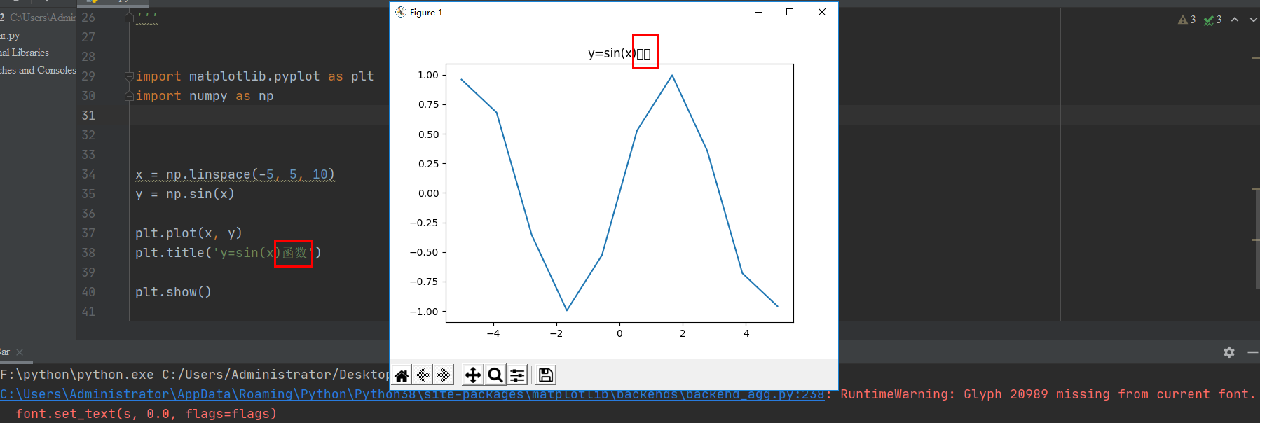
增加
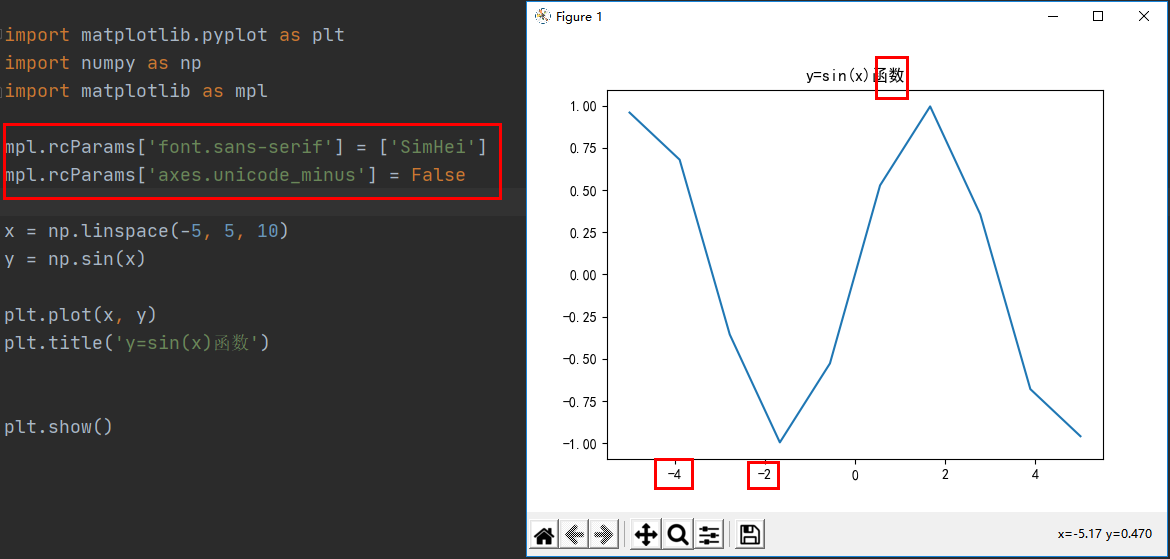
mpl.rcParams['font.sans-serif'] = ['SimHei']
之后,看到负号无法正常显示

于是增加了第二行代码
mpl.rcParams['axes.unicode_minus'] = False
然后中文与负号可以正常输出:
Bar函数功能: Make a bar plot
绘制柱形图
The bars are positioned at x with the given alignment. Their dimensions are given by height and width. The vertical baseline is bottom (default 0)。Many parameters can take either a single value applying to all bars or a sequence of values, one for each bar.
这些柱Bar以给定的对齐方式放在x处,柱的大小通过高度和宽度指定,垂直基线在底部(默认0的位置)。许多参数可以采用两种方式赋值:一是对所有柱形赋予同一个值;二是传入一系列值,每个柱子一个单独的值。
函数语法:
bar(x, height, width=0.8, bottom=None, *, align=‘center’, data=None, **kwargs)
函数参数:
x: float or array-like。The x coordinates of the bars. See also align for the alignment of the bars to the coordinates.
浮点型或类数组对象;柱形的的x轴坐标。另请参见‘align’参数了解柱与坐标的对齐方式
height: float or array-like. The height(s) of the bars.
浮点型或类数组对象;柱形的高度
width: float or array-like, default: 0.8The width(s) of the bars.
浮点型或类数组对象;柱形的宽度,默认值为0.8
bottom: float or array-like, default: 0。The y coordinate(s) of the bars bases.
浮点型或类数组对象; 柱形基座的y坐标,默认0.
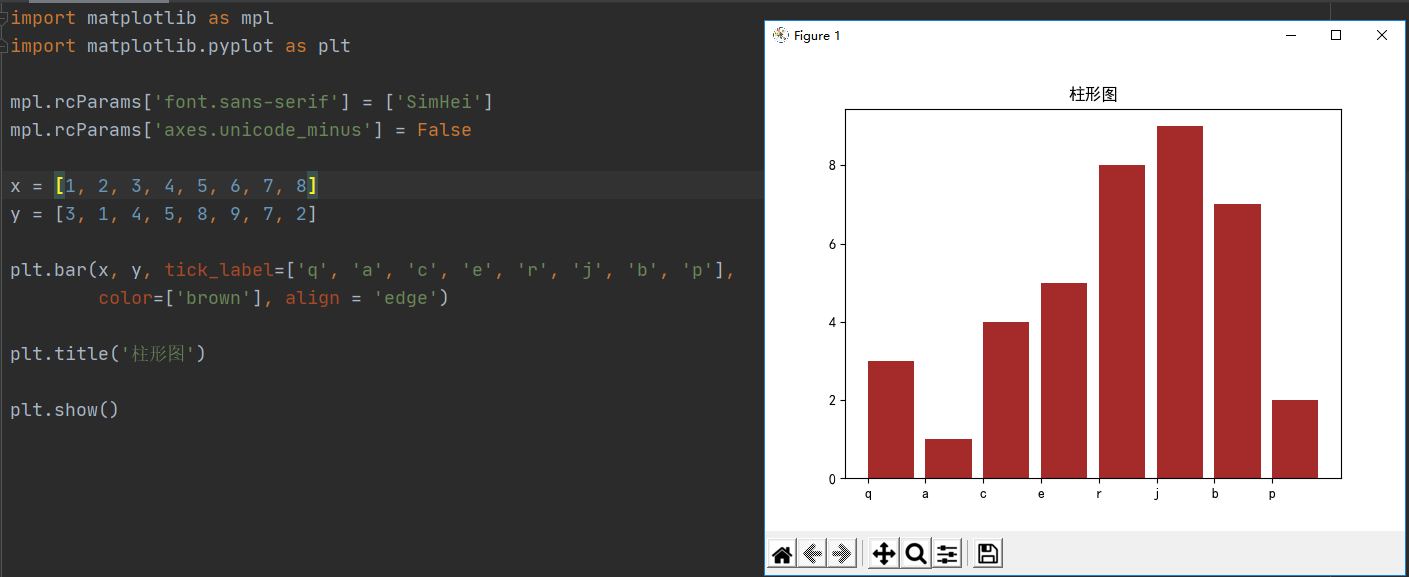
align: {‘center’, ‘edge’}, default: ‘center’。Alignment of the bars to the x coordinates:
‘center’: Center the base on the x positions.
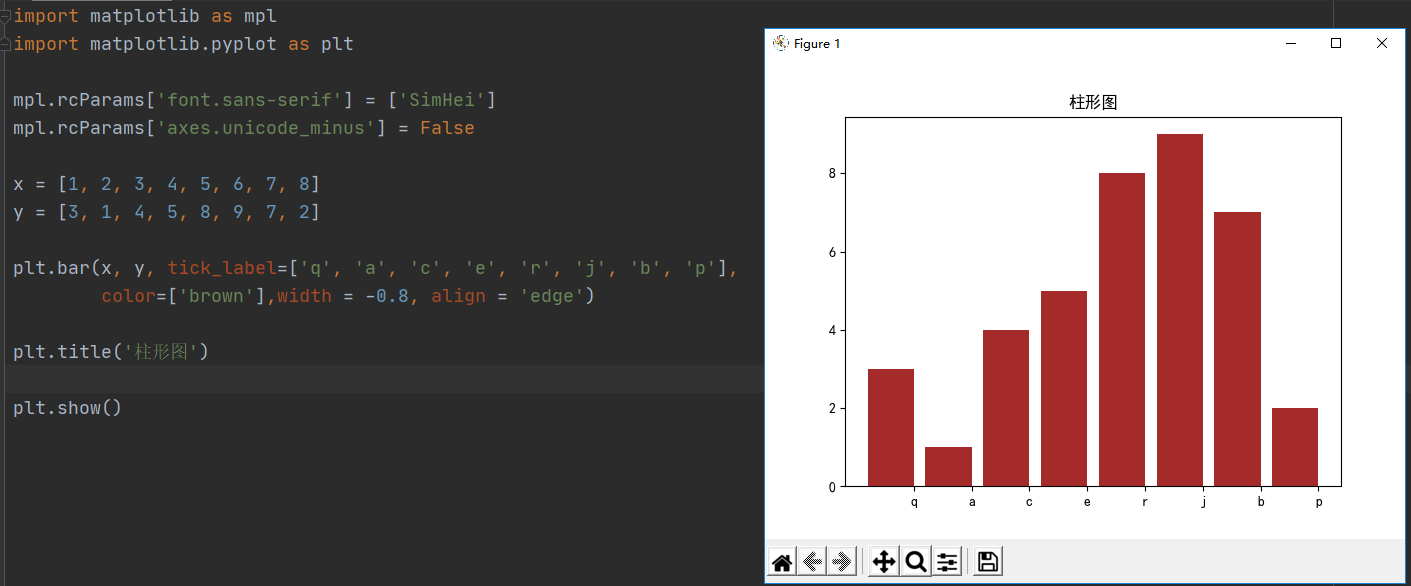
‘edge’: Align the left edges of the bars with the x positions.
To align the bars on the right edge pass a negative width and align=‘edge’.
对齐方式: 中间,边缘 ,默认为中间。柱与x轴坐标的对其方式
中间:x轴坐标在中间位置
边缘:x轴坐标在左边
设置x轴坐标在右边需要传入宽度为负值同时对其方式为边缘
Other Parameters:
color: color or list of color, optional。The colors of the bar faces.
可选参数,颜色或颜色列表 。柱形颜色
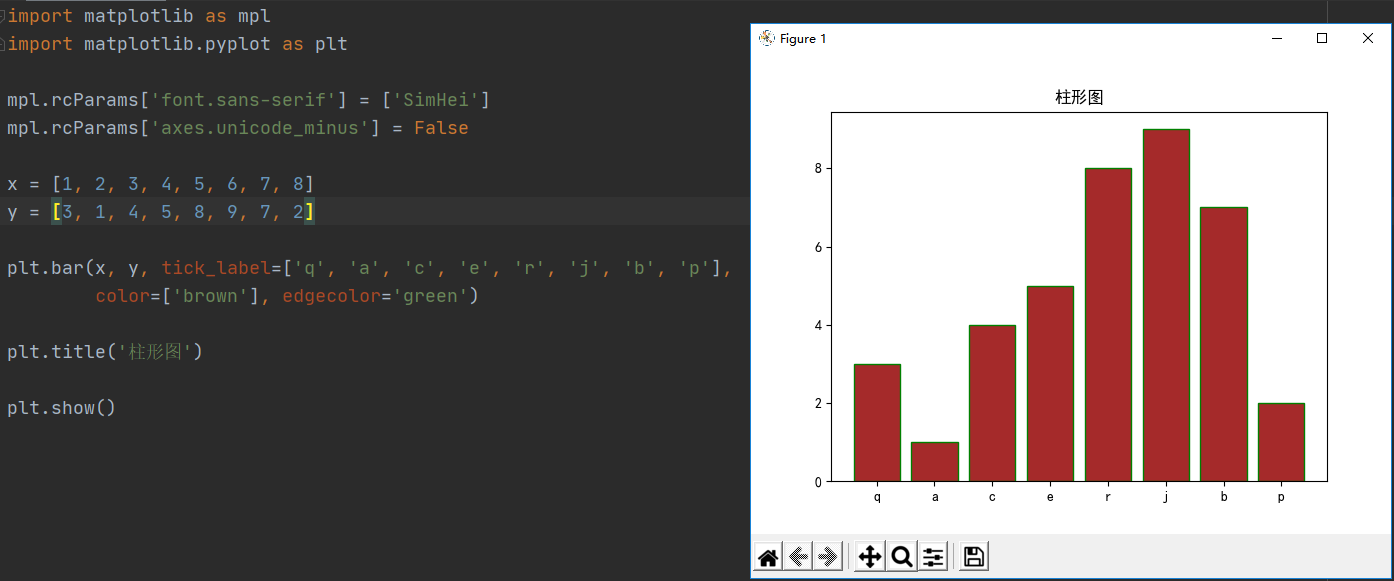
edgecolor: color or list of color, optional。The colors of the bar edges.
可选参数:颜色或颜色列表 。柱形边缘的颜色
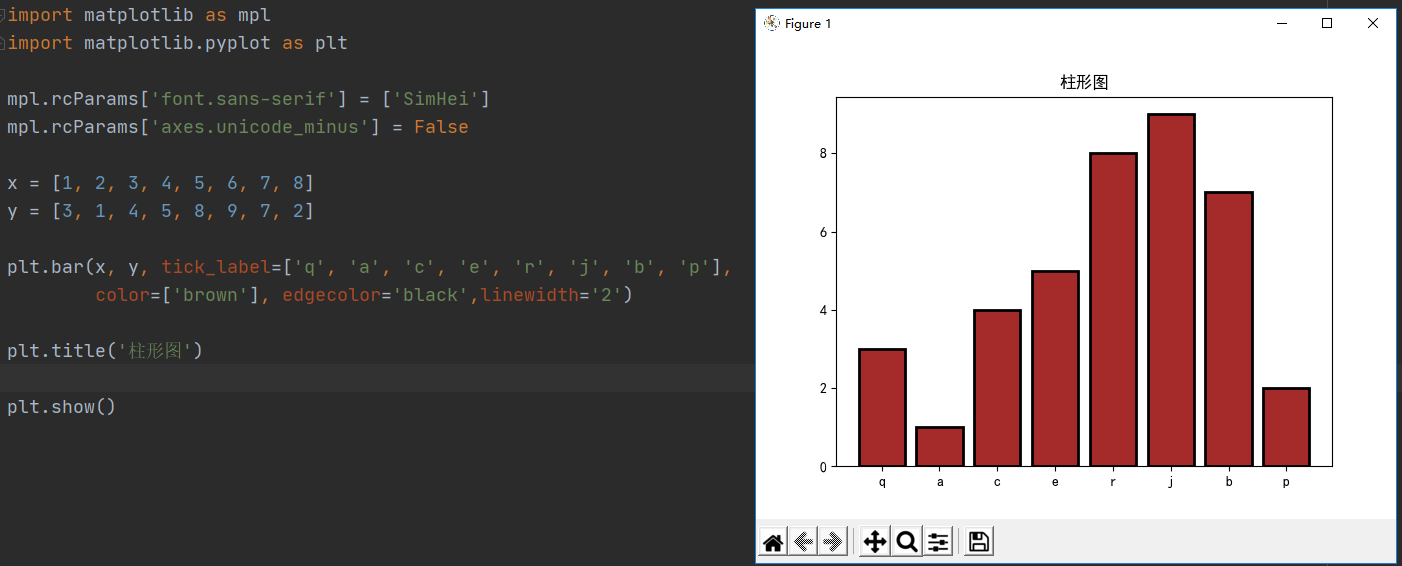
linewidth: float or array-like, optional。Width of the bar edge(s). If 0, don’t draw edges.
线条宽度:可选参数,浮点型或类数组 。柱形线的宽度,若值为0,则不绘制边线
tick_label: str or list of str, optional 。The tick labels of the bars. Default: None (Use default numeric labels.)
可选参数,字符串或字符串列表,柱形的刻度线标签,默认:使用数字标签
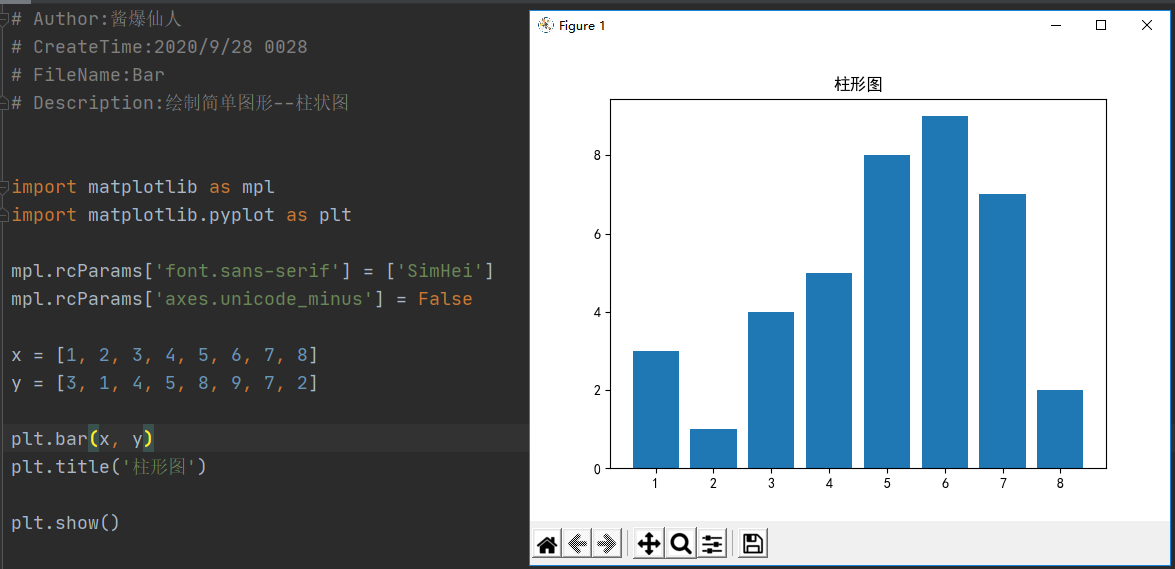
这里的参数x是横轴坐标,默认使用数字标签,柱形的高度由参数height控制,也就是代码中的y值
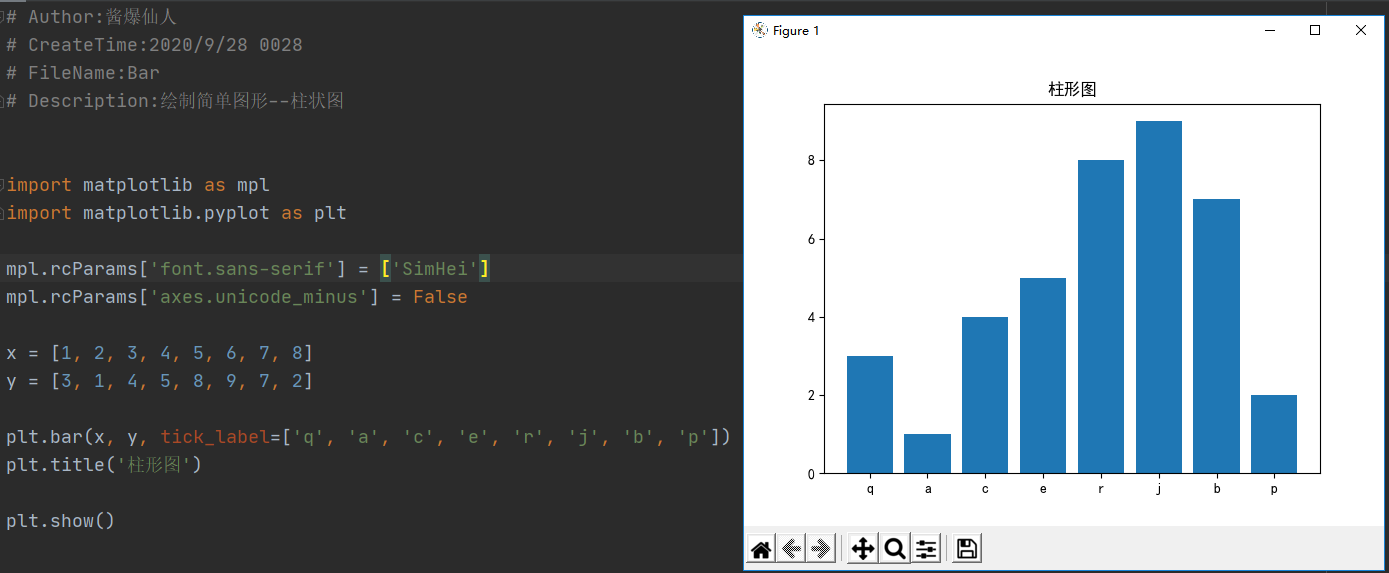
接下来使用tick_label参数对横坐标重新命名:命名为 [‘q’, ‘a’, ‘c’, ‘e’, ‘r’, ‘j’, ‘b’, ‘p’],使用tick_label参数
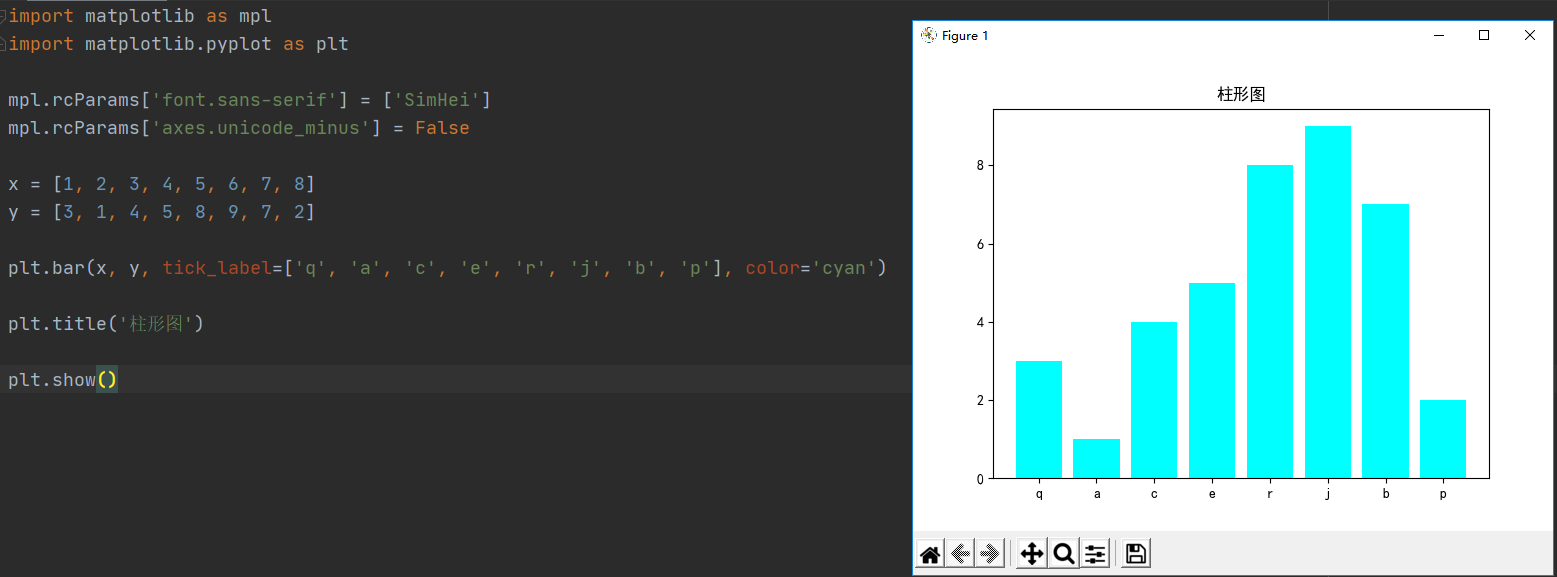
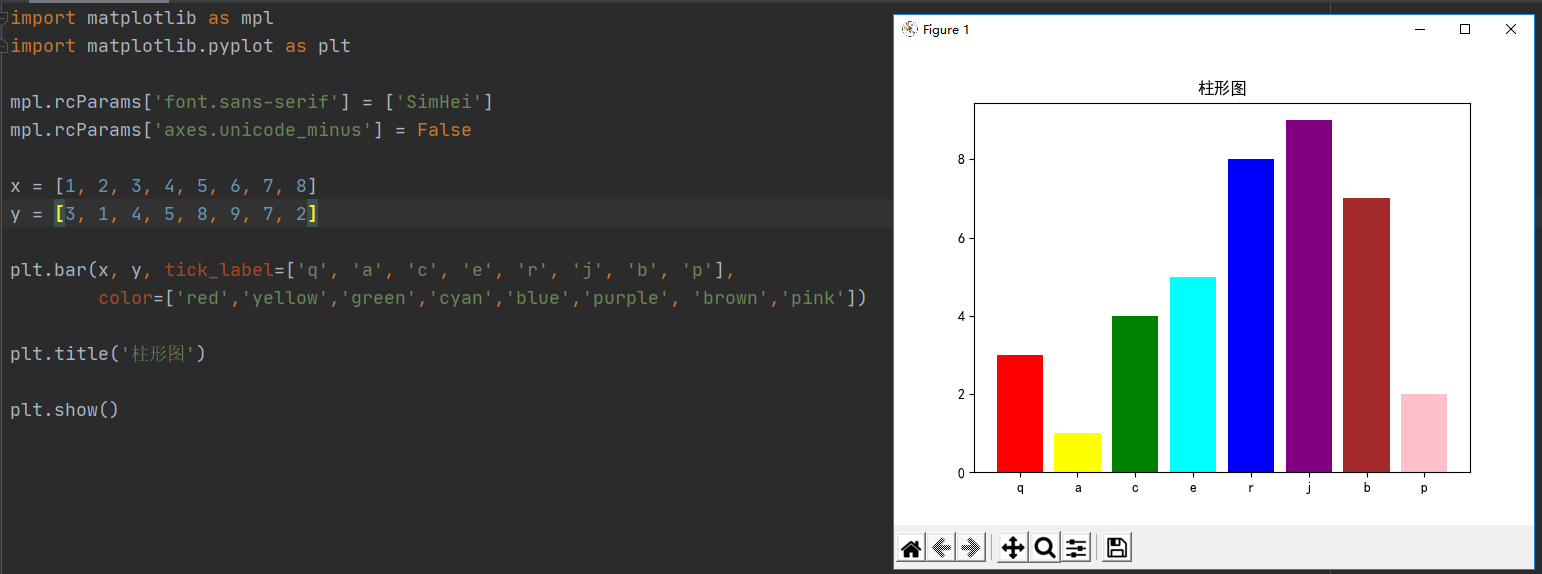
使用color参数修改柱形图填充颜色
使用同一种颜色填充各个柱子
使用不同颜色填充各个柱子
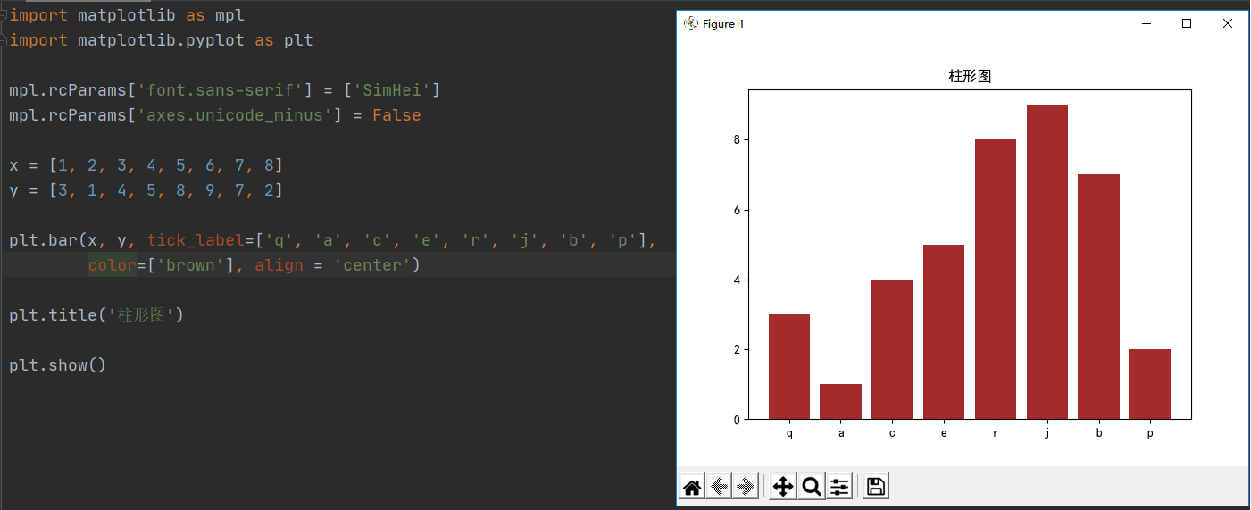
使用align参数 设置横坐标的位置,默认中间
align = ‘edge’展示在左边缘
设置align在右边缘,需要同时设置width参数为负值且align为edge
使用edgecolor设置柱子的边缘线颜色
使用linewidth参数设置边缘线的宽度
**kwargs: Rectangle properties
其他关键参数: 定义矩形柱子的属性
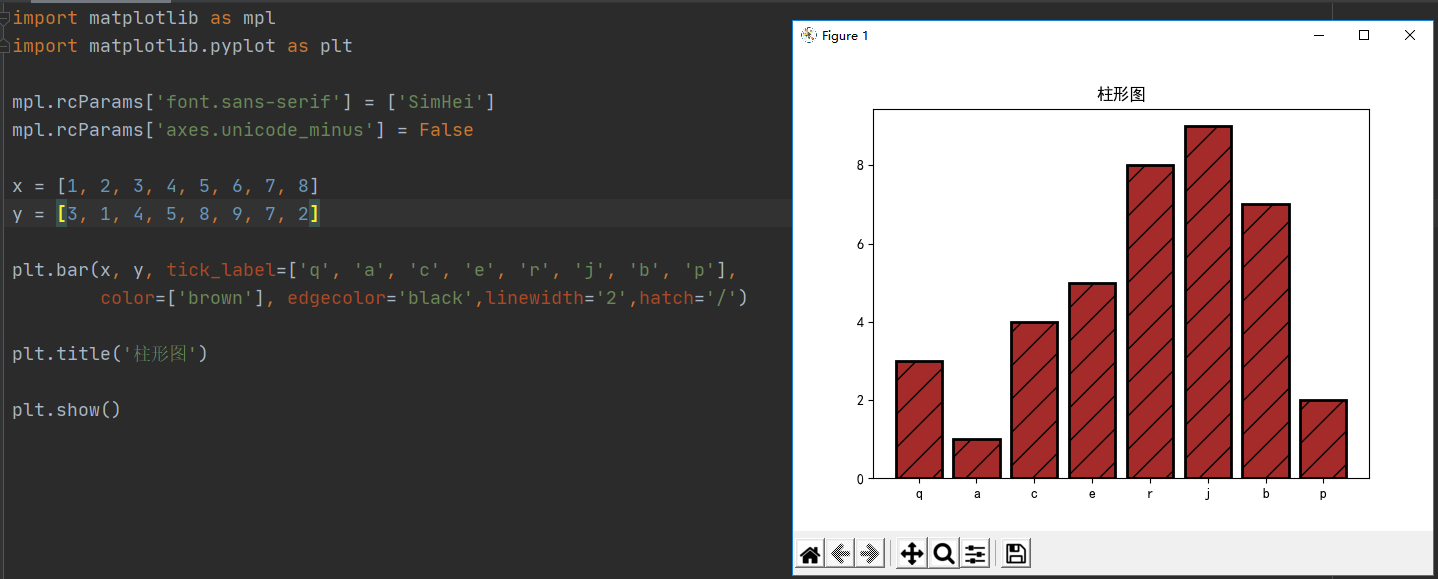
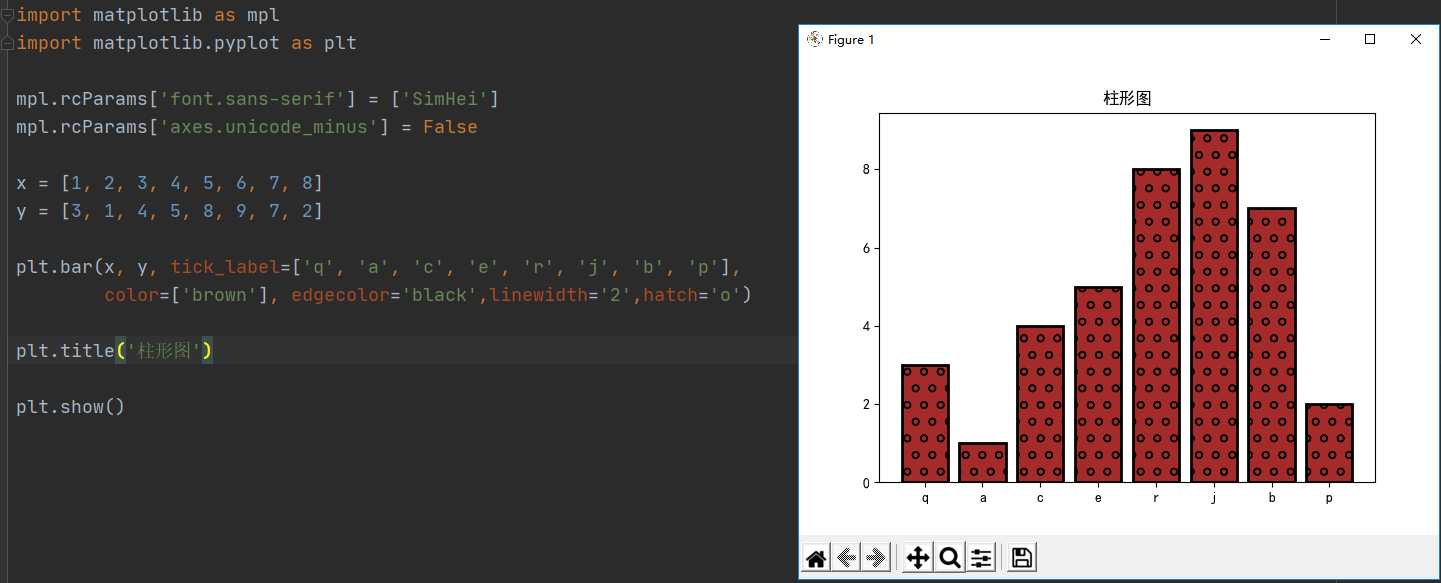
其中的color,edgecolor,linewidth上面已经列举过,接下来关注hatch参数
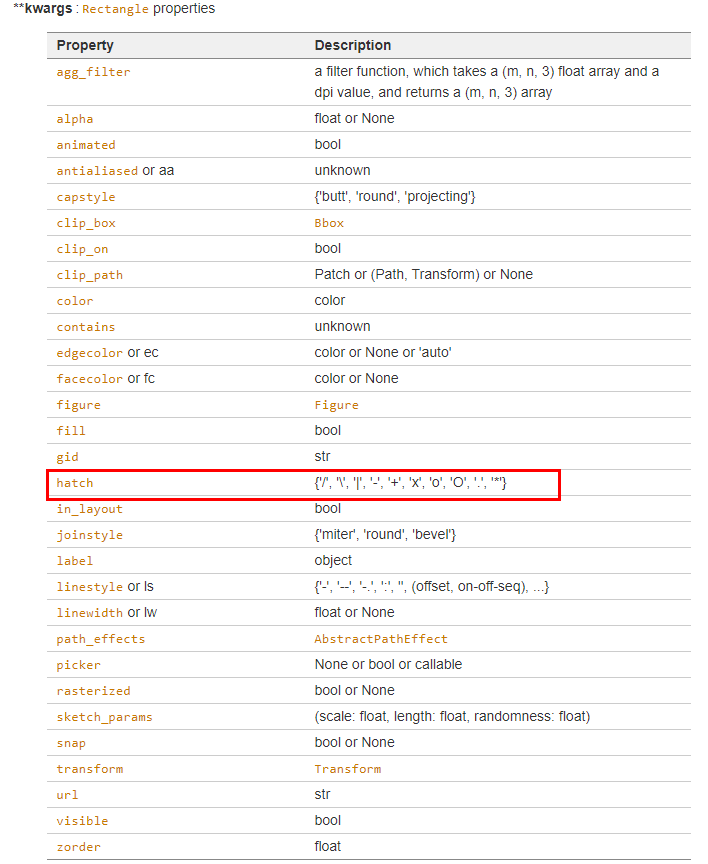
使用hatch参数在柱子矩形内部填充镶嵌。
hatch = ‘/’
hatch =‘o’
完整代码附下:
# 绘制柱形图

# 导入第三方数据库
import matplotlib as mpl
import matplotlib.pyplot as plt

# 修改字体以显示中文并解决负号不能正常显示问题
mpl.rcParams['font.sans-serif'] = ['SimHei']
mpl.rcParams['axes.unicode_minus'] = False

# 产生数据
x = [1, 2, 3, 4, 5, 6, 7, 8]
y = [3, 1, 4, 5, 8, 9, 7, 2]

# 1. 绘制柱形图
plt.bar(x, y)

#  2. 使用 tick_label 参数对横坐标重新命名
plt.bar(x, y, tick_label=['q', 'a', 'c', 'e', 'r', 'j', 'b', 'p'])

# 3. 修改柱形图填充颜色
# 3.1 使用同一种颜色填充各个柱子
plt.bar(x, y, tick_label=['q', 'a', 'c', 'e', 'r', 'j', 'b', 'p'], color='cyan')
# 3.2 使用不同颜色填充各个柱子
plt.bar(x, y, tick_label=['q', 'a', 'c', 'e', 'r', 'j', 'b', 'p'],
        color=['red','yellow','green','cyan','blue','purple', 'brown','pink'])


# 4. 使用align参数 设置横坐标的位置,默认中间
# 4.1 设置横坐标在中间
# 参数align = 'center'
plt.bar(x, y, tick_label=['q', 'a', 'c', 'e', 'r', 'j', 'b', 'p'],
        color=['brown'], align='edge')
# 4.2 设置横坐标在左边缘
# 参数align = 'edge'
plt.bar(x, y, tick_label=['q', 'a', 'c', 'e', 'r', 'j', 'b', 'p'],
        color=['brown'], align='edge')
# 4.3 设置横坐标在右边缘
# 参数align = 'edge' 且 width为负值
plt.bar(x, y, tick_label=['q', 'a', 'c', 'e', 'r', 'j', 'b', 'p'],
        color=['brown'], width=-0.8, align='edge')

# 5. 设置柱子边缘线颜色
plt.bar(x, y, tick_label=['q', 'a', 'c', 'e', 'r', 'j', 'b', 'p'],
        color=['brown'], edgecolor='green')

# 6. 使用linewidth参数设置柱子边宽度
plt.bar(x, y, tick_label=['q', 'a', 'c', 'e', 'r', 'j', 'b', 'p'],
        color=['brown'], edgecolor='green', linewidth=2)

# 7. 使用hatch参数设置柱子内部填充镶嵌
plt.bar(x, y, tick_label=['q', 'a', 'c', 'e', 'r', 'j', 'b', 'p'],
        color=['brown'], edgecolor='green', linewidth=2, hatch='/')

plt.title('柱形图')

plt.show()
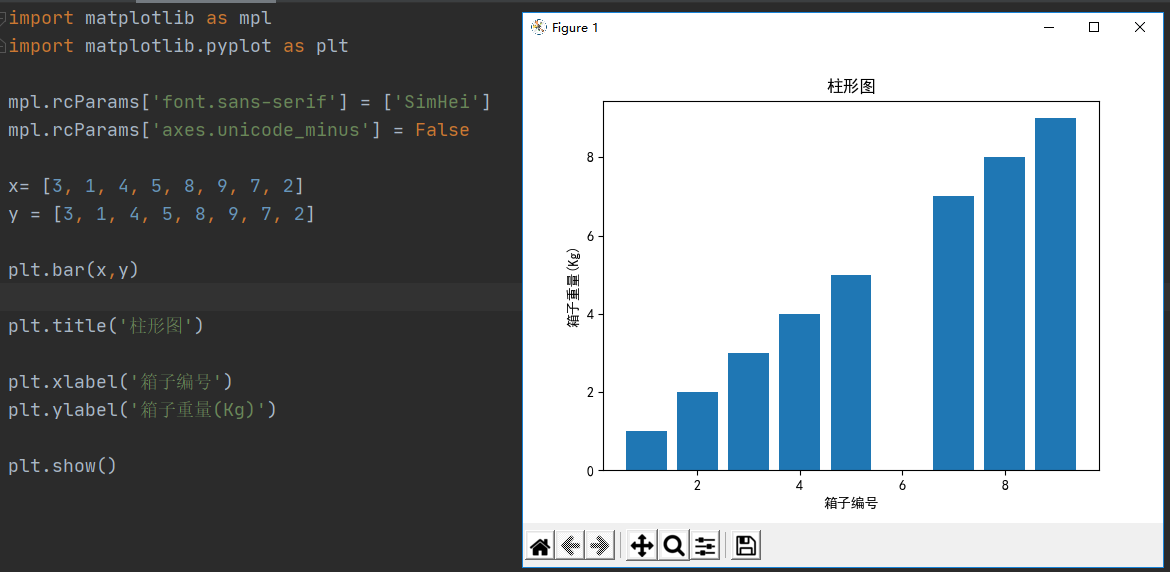
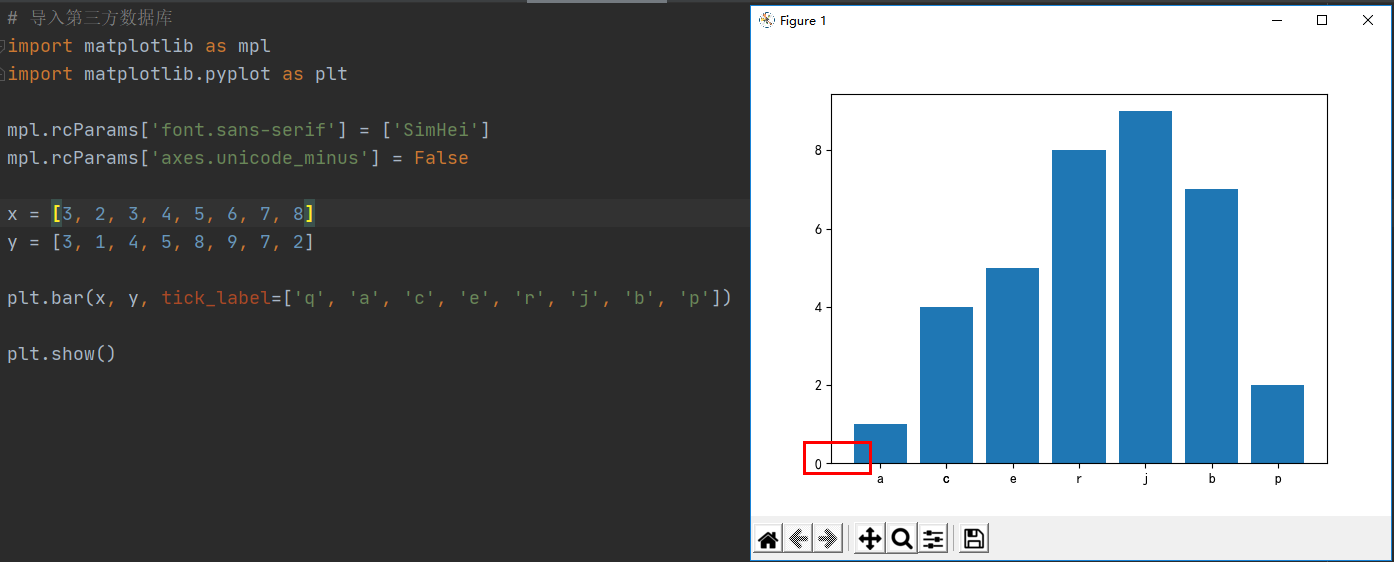
另:x为柱形的x轴坐标,因此,如果x的浮点数没有按照顺序来排列,则出来的结果也不会按照x列表的顺序展示,而是会对应到相应的坐标位置。图中柱形图并没有按照x的列表顺序 [3, 1, 4, 5, 8, 9, 7, 2]来从左向右依次展示,而是按照x坐标先后的顺序进行,没有x=6的值,则相应位置显示空白。
参数
b
o
t
t
o
m
bottom
bottom默认设置
底部:设置各箱的底部从哪个值开始,默认从0开始
参数
b
o
t
t
o
m
=
3
bottom=3
bottom=3,图形底部从3开始
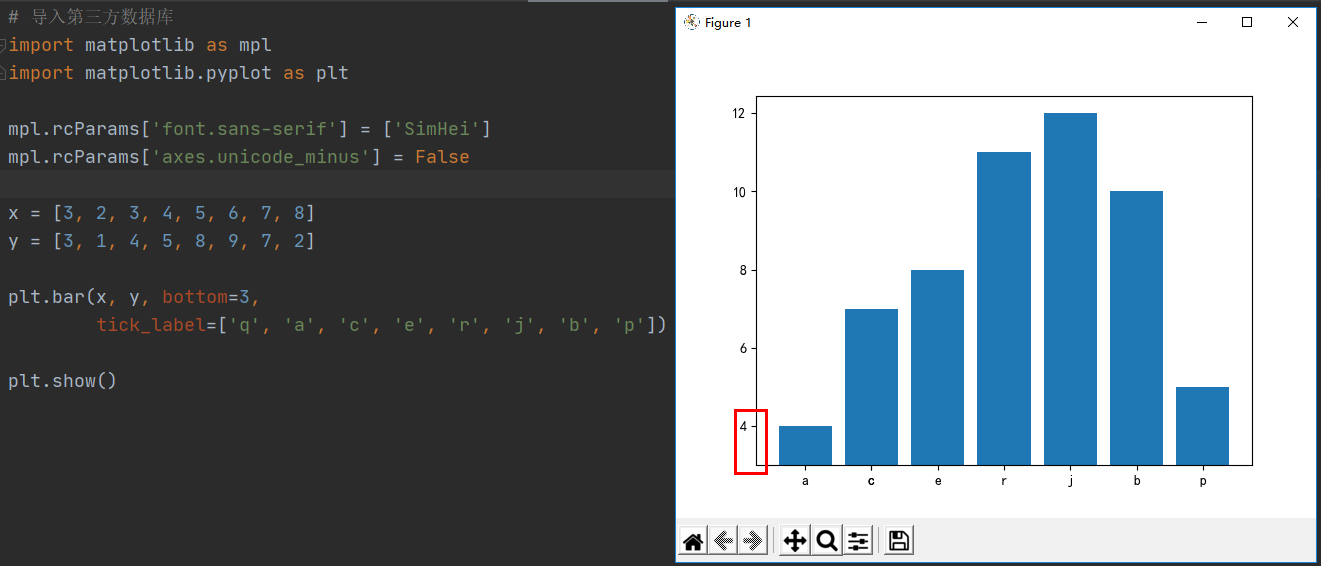
参数
b
o
t
t
o
m
bottom
bottom为与柱子相同数量的数组,柱子向上移动想用的高度
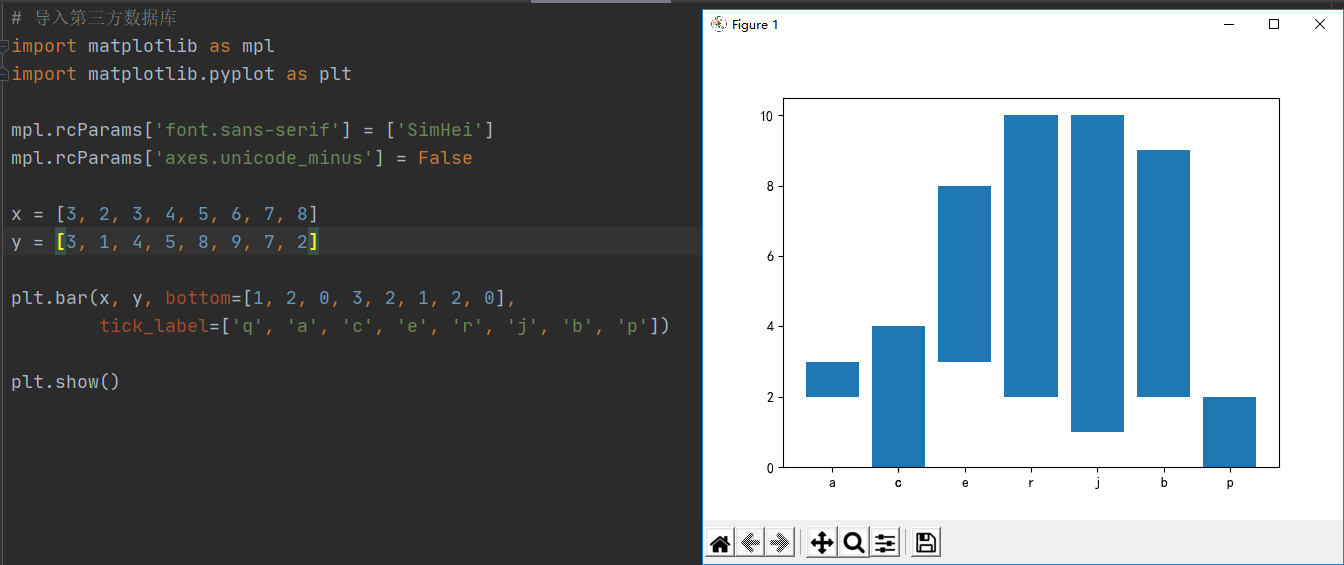
参考文献:
[1] https://matplotlib.org/api/_as_gen/matplotlib.pyplot.bar.html
最后
以上就是知性导师最近收集整理的关于Bar函数--Matplotlib函数Bar()–用于绘制柱状图的全部内容,更多相关Bar函数--Matplotlib函数Bar()–用于绘制柱状图内容请搜索靠谱客的其他文章。


发表评论 取消回复