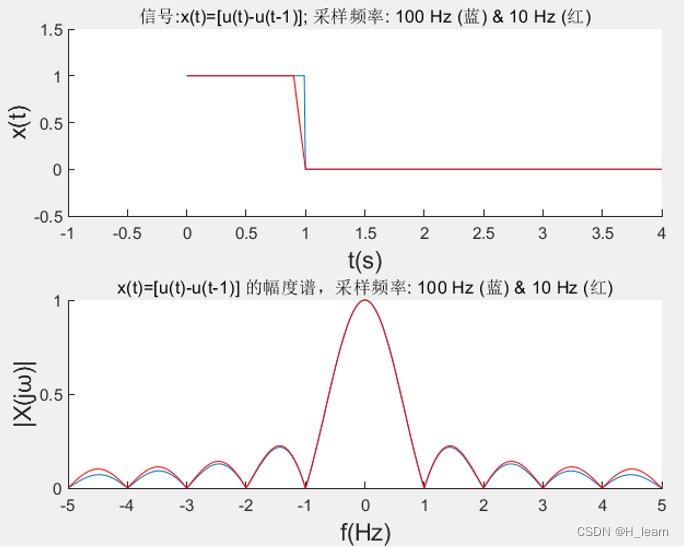
具体内容:利用FFT,分析连续非周期信号 (e^−t)*u(t), [u(t) − u(t − 1)] 的频谱:通过改变采样率,观察频谱混叠现象,并与该信号的理论频谱对比。
原信号:单边e指数衰减信号
采样频率:100
时间长度:100
%ce衰减指数100
clc;
clear;
close all;
fs=100; %采样频率
ts=1/fs; %采样间隔
TT=100;
t1 =0:ts:TT-ts; % 时间序列
y1 =exp(-t1).*(t1>=0);
N=length(t1);
if mod(N,2)==0
f=(-N/2:N/2-1)*fs/N;
else
f=(-(N-1)/2:(N-1)/2)*fs/N;
end
y2=fft(y1)/fs;
Z1=abs(y2);%幅度谱
Z2=angle(y2);% 相位谱
figure(1)
subplot(3,1,1 ),plot(t1 ,y1);
title(sprintf('信号:x(t)=exp(-t)u(t);采样频率:%0.0f Hz ',fs));
xlabel('t(s)','FontSize',13);
ylabel('x(t)','FontSize',13);
subplot(3,1,2),plot(f,fftshift(Z1));
xlabel('f(HZ)','FontSize',13);
ylabel('|X(jw)|','FontSize',13);
ylim([0 1.2]);
subplot(3,1,3),plot(f,fftshift(Z2));
xlabel('t(s)','FontSize',13);
ylabel('jiaoX(jw)','FontSize',13);
ylim([-2 2]);
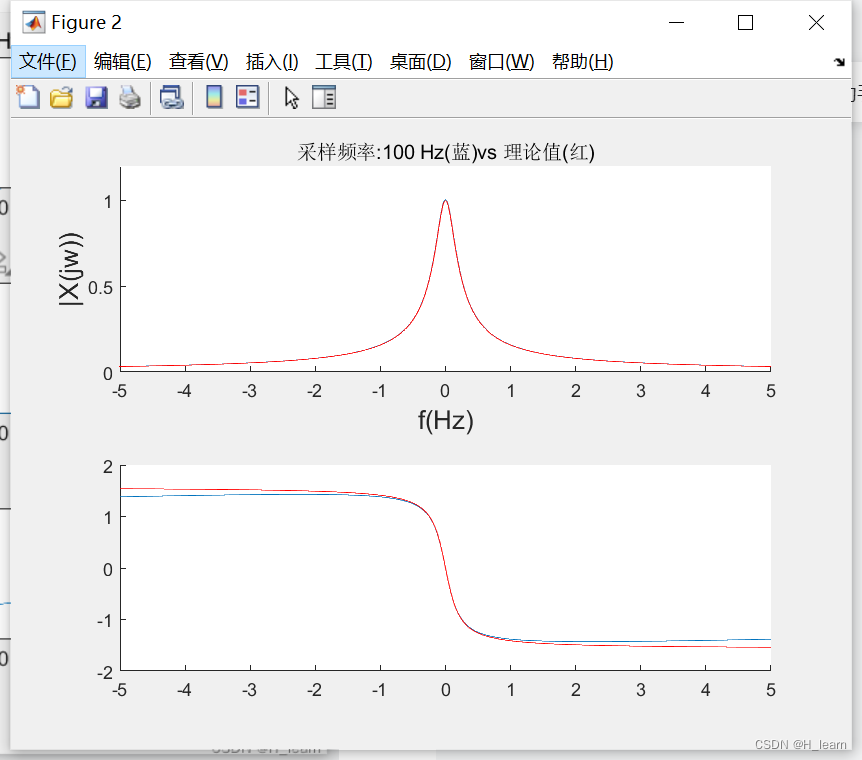
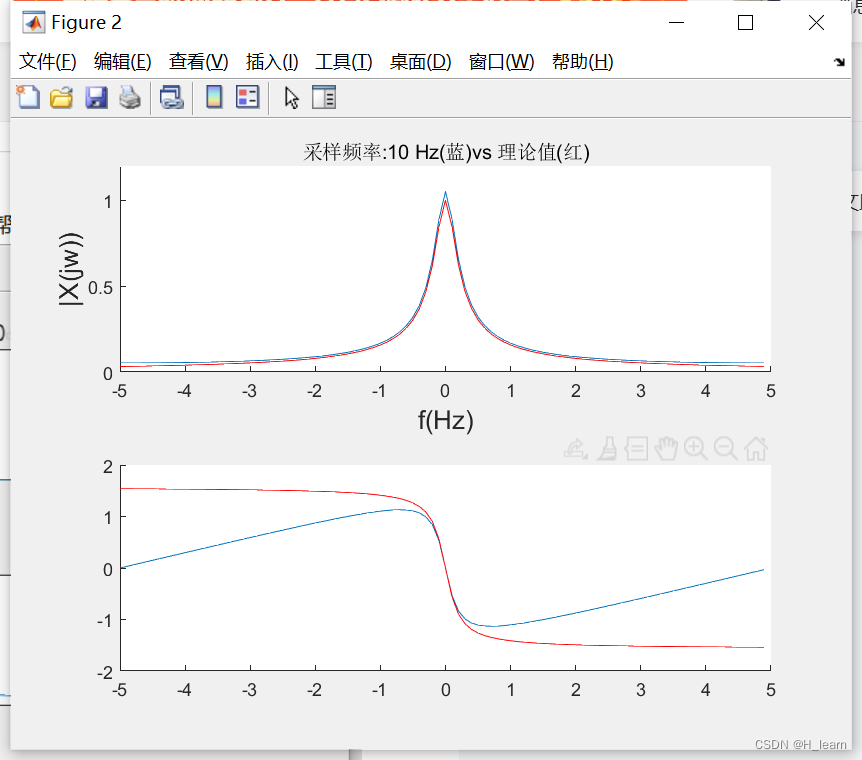
%理论值与实际值绘制
figure(2)
Z7=abs(1./(1+2*pi*1i*f));
Z8=angle(1./(1+2*pi*1i*f));
subplot(2,1,1 );
hold on;
plot(f,fftshift(Z1)), plot(f,Z7,'r');
title(sprintf('采样频率:%0.0f Hz(蓝)vs 理论值(红)',fs));
xlabel('f(Hz)','FontSize',13);
ylabel('|X(jw))','FontSize',13);
axis([-5,5,0,1.2]);
subplot(2,1,2);hold on;
plot(f,fftshift(Z2)),plot(f,Z8,'r');
ylim([-2 2]);
xlim([-5 5]); 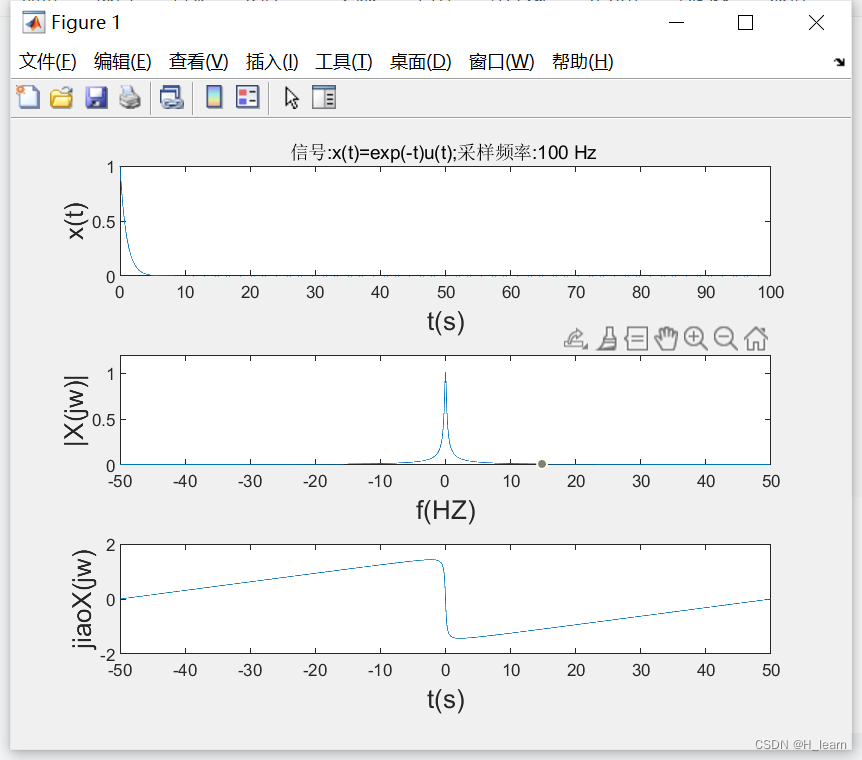
原信号:单边e指数衰减信号
采样频率:10
时间长度:100
%e衰减指数10
clc;
clear;
close all;
fs=10; %采样频率
ts=1/fs; %采样间隔
TT=100;
t1 =0:ts:TT-ts; % 时间序列
y1 =exp(-t1).*(t1>=0);
N=length(t1);
if mod(N,2)==0
f=(-N/2:N/2-1)*fs/N;
else
f=(-(N-1)/2:(N-1)/2)*fs/N;
end
y2=fft(y1)/fs;
Z1=abs(y2);%幅度谱
Z2=angle(y2);% 相位谱
figure(1)
subplot(3,1,1 ),plot(t1 ,y1);
title(sprintf('信号:x(t)=exp(-t)u(t);采样频率:%0.0f Hz ',fs));
xlabel('t(s)','FontSize',13);
ylabel('x(t)','FontSize',13);
subplot(3,1,2),plot(f,fftshift(Z1));
xlabel('f(HZ)','FontSize',13);
ylabel('|X(jw)|','FontSize',13);
ylim([0 1.2]);
subplot(3,1,3),plot(f,fftshift(Z2));
xlabel('t(s)','FontSize',13);
ylabel('jiaoX(jw)','FontSize',13);
ylim([-2 2]);
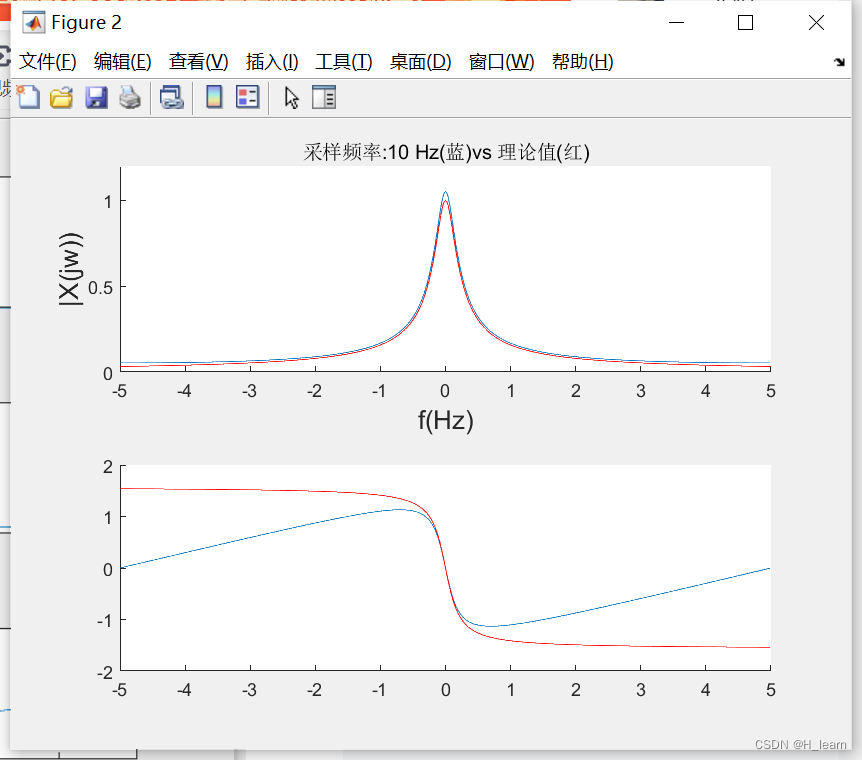
%理论值与实际值绘制
figure(2)
Z7=abs(1./(1+2*pi*1i*f));
Z8=angle(1./(1+2*pi*1i*f));
subplot(2,1,1 );
hold on;
plot(f,fftshift(Z1)), plot(f,Z7,'r');
title(sprintf('采样频率:%0.0f Hz(蓝)vs 理论值(红)',fs));
xlabel('f(Hz)','FontSize',13);
ylabel('|X(jw))','FontSize',13);
axis([-5,5,0,1.2]);
subplot(2,1,2);hold on;
plot(f,fftshift(Z2)),plot(f,Z8,'r');
ylim([-2 2]);
xlim([-5 5]);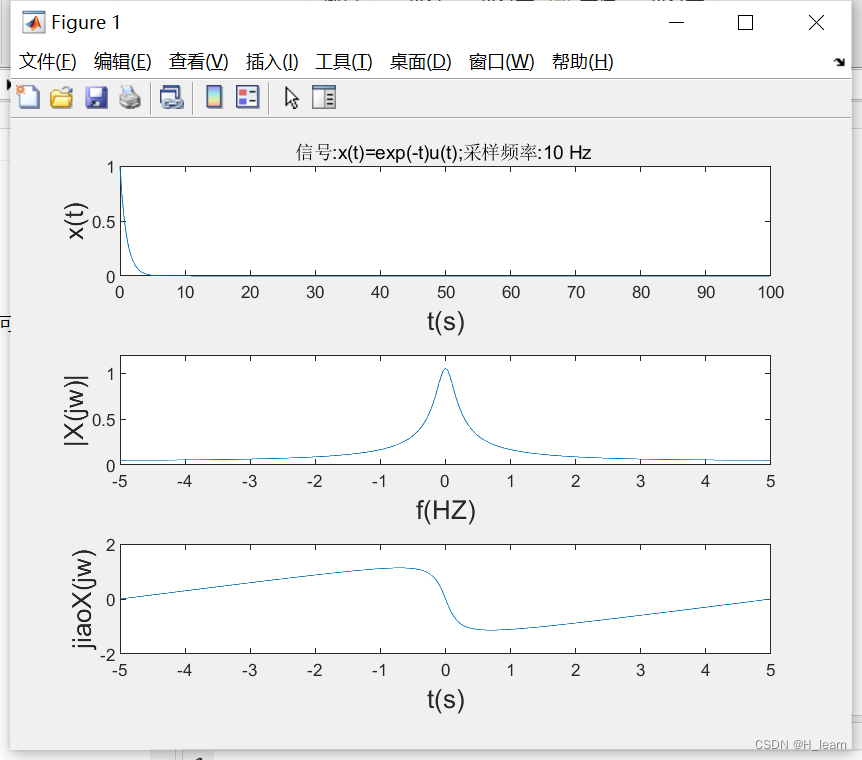
原信号:单边e指数衰减信号
采样频率:10
时间长度:10
%e衰减指数10
clc;
clear;
close all;
fs=10; %采样频率
ts=1/fs; %采样间隔
TT=10;
t1 =0:ts:TT-ts; % 时间序列
y1 =exp(-t1).*(t1>=0);
N=length(t1);
if mod(N,2)==0
f=(-N/2:N/2-1)*fs/N;
else
f=(-(N-1)/2:(N-1)/2)*fs/N;
end
y2=fft(y1)/fs;
Z1=abs(y2);%幅度谱
Z2=angle(y2);% 相位谱
figure(1)
subplot(3,1,1 ),plot(t1 ,y1);
title(sprintf('信号:x(t)=exp(-t)u(t);采样频率:%0.0f Hz ',fs));
xlabel('t(s)','FontSize',13);
ylabel('x(t)','FontSize',13);
subplot(3,1,2),plot(f,fftshift(Z1));
xlabel('f(HZ)','FontSize',13);
ylabel('|X(jw)|','FontSize',13);
ylim([0 1.2]);
subplot(3,1,3),plot(f,fftshift(Z2));
xlabel('t(s)','FontSize',13);
ylabel('jiaoX(jw)','FontSize',13);
ylim([-2 2]);

%理论值与实际值绘制
figure(2)
Z7=abs(1./(1+2*pi*1i*f));
Z8=angle(1./(1+2*pi*1i*f));
subplot(2,1,1 );
hold on;
plot(f,fftshift(Z1)), plot(f,Z7,'r');
title(sprintf('采样频率:%0.0f Hz(蓝)vs 理论值(红)',fs));
xlabel('f(Hz)','FontSize',13);
ylabel('|X(jw))','FontSize',13);
axis([-5,5,0,1.2]);
subplot(2,1,2);hold on;
plot(f,fftshift(Z2)),plot(f,Z8,'r');
ylim([-2 2]);
xlim([-5 5]);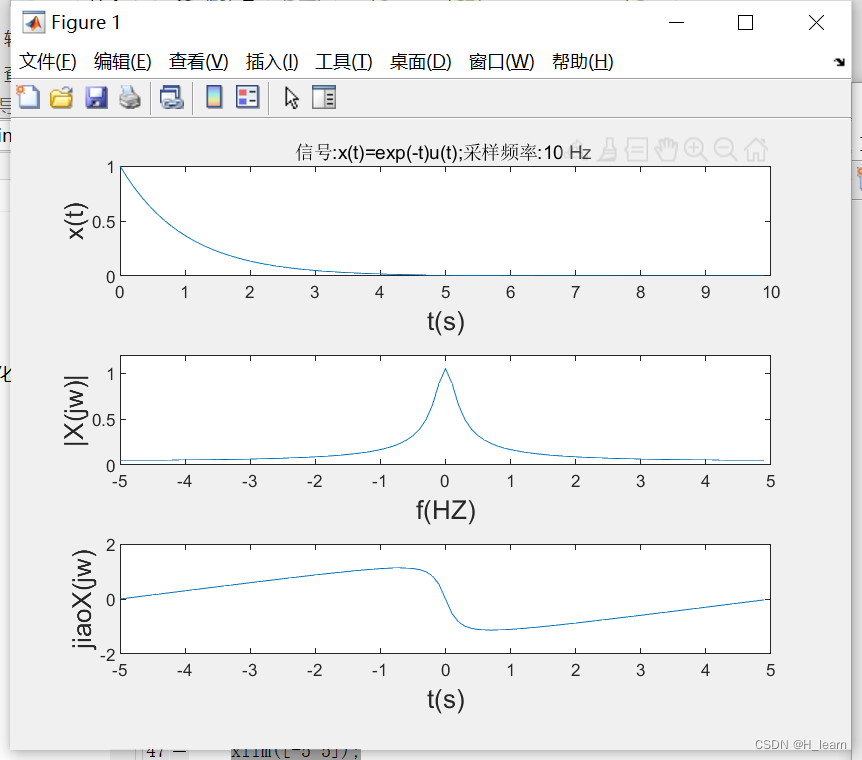
原信号:方波
%c方波
clc;
clear;
close all;
TZ=100;
fs1=100;
fs2=10;
c=0.5;
w=1;
Ts1=1/fs1;
Ts2=1/fs2;
t1=0:Ts1:TZ;
t2=0:Ts2:TZ;
x1=rectpuls(t1-c,w);
x2=rectpuls(t2-c,w);
y1=fft(x1)*Ts1;
y2=fft(x2)*Ts2;
N1=length(t1);
N2=length(t2);
Z1=abs(y1);
Z2=abs(y2);
k=angle(y2);
if mod(N1,2)==0
f1=(-N1/2:N1/2-1)*fs1/N1;
else
f1=(-(N1-1)/2:(N1-1)/2)*fs1/N1;
end
if mod(N2,2)==0
f2=(-N2/2:N2/2-1)*fs2/N2;
else
f2=(-(N2-1)/2:(N2-1)/2)*fs2/N2;
end
t11=c-w/2;
t22=t11+w-Ts2;
t0=(t11+t22)/2;
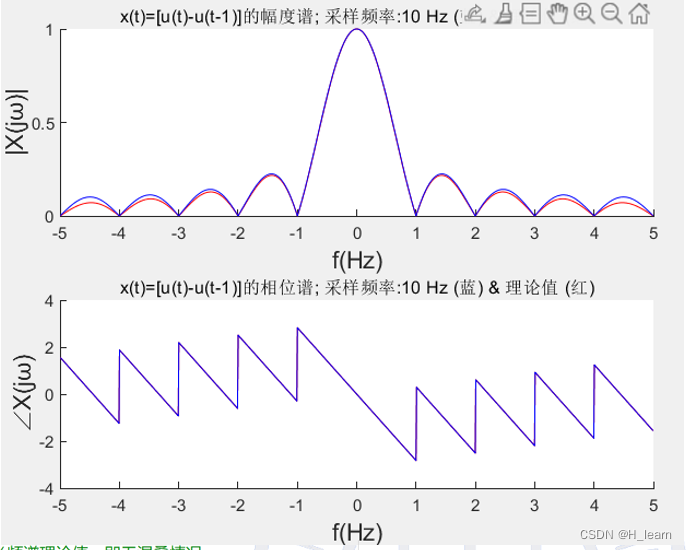
Z3=w*sinc(w*f2).*exp(-2*pi*1i*f2*t0);
Z3A=abs(Z3);
Z3B=angle(Z3);
figure(1);
subplot(2,1,1);
plot(t1,x1);
axis([-1,4,-0.5,1.5]);
hold on;
plot(t2,x2);
subplot(2,1,2);
plot(f1,fftshift(Z1));
axis([-5,5,0,1]);
hold on;
plot(f2,fftshift(Z2));
axis([-5,5,0,1]);
figure(2);
subplot(2,1,1);
plot(f2,fftshift(Z2));
hold on;
plot(f2,Z3A);
subplot(2,1,2);
plot(f2,fftshift(k));
hold on;
plot(f2,Z3B);
最后
以上就是紧张红牛最近收集整理的关于【matlab】信号频谱分析之研究连续非周期信号的混叠现象的全部内容,更多相关【matlab】信号频谱分析之研究连续非周期信号内容请搜索靠谱客的其他文章。
本图文内容来源于网友提供,作为学习参考使用,或来自网络收集整理,版权属于原作者所有。


发表评论 取消回复