import matplotlib.pyplot as plt


labels = 'A', 'B', 'C', 'D'
fracs = [35, 20, 45, 10]

plt.pie(x=fracs, labels=labels)
plt.show()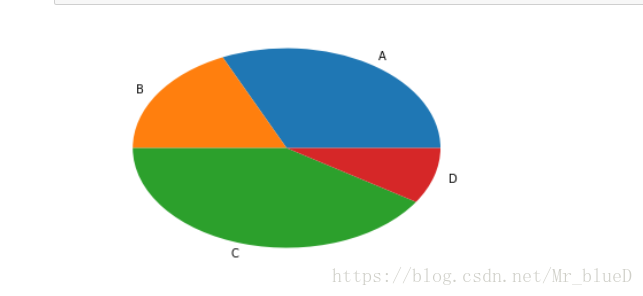
圆形饼图
import matplotlib.pyplot as plt


labels = 'A', 'B', 'C', 'D'
fracs = [35, 20, 45, 10]

plt.axes(aspect=1)
plt.pie(x=fracs, labels=labels)
plt.show()
比例显示
import matplotlib.pyplot as plt


labels = 'A', 'B', 'C', 'D'
fracs = [35, 20, 45, 10]

plt.axes(aspect=1)
plt.pie(x=fracs, labels=labels, autopct='%.0f%%')
plt.show()
突出显示
import matplotlib.pyplot as plt


labels = 'A', 'B', 'C', 'D'
fracs = [35, 20, 45, 10]
explode = [0, 0.05, 0.08, 0]

plt.axes(aspect=1)
plt.pie(x=fracs, labels=labels, autopct='%.0f%%', explode=explode)
plt.show()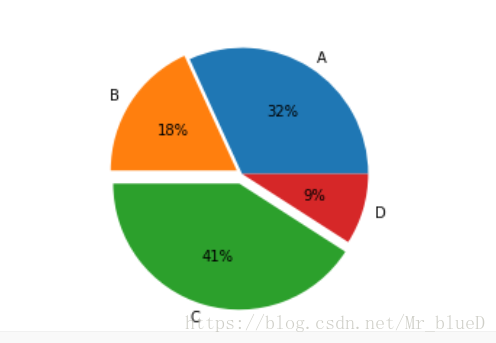
添加阴影
import matplotlib.pyplot as plt


labels = 'A', 'B', 'C', 'D'
fracs = [35, 20, 45, 10]
explode = [0, 0.05, 0.08, 0]

plt.axes(aspect=1)
plt.pie(x=fracs, labels=labels, autopct='%.0f%%', explode=explode, shadow=True)
plt.show()
最后
以上就是饱满豌豆最近收集整理的关于matplotlib之饼状图的全部内容,更多相关matplotlib之饼状图内容请搜索靠谱客的其他文章。
本图文内容来源于网友提供,作为学习参考使用,或来自网络收集整理,版权属于原作者所有。


发表评论 取消回复