动态信号的周期性检测
信号周期性检测的应用条件首先是被检测信号自身具有周期性,而信号的周期表现为按照一定时间间隔重复出现。本文将探讨信号周期性如何快速检测。
1、确定性周期信号的周期检测
已知这样的一组周期性信号,,该信号具有固定的周期,也就是该信号以时间间隔为周期重复出现。
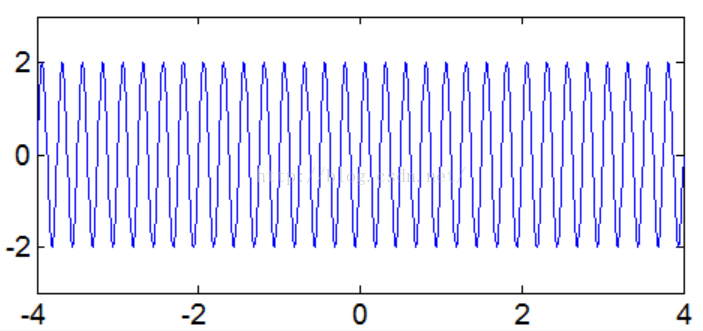
Figure1 周期信号时域图
在仅仅知道信号数据但是不知道确切数学表达式的情况下,确定一组信号的周期,通常采用信号分析的方法可以确定信号的周期,利用傅里叶变换可以确定信号周期如下图2,计算得到其频率,也就探测到了信号的周期。
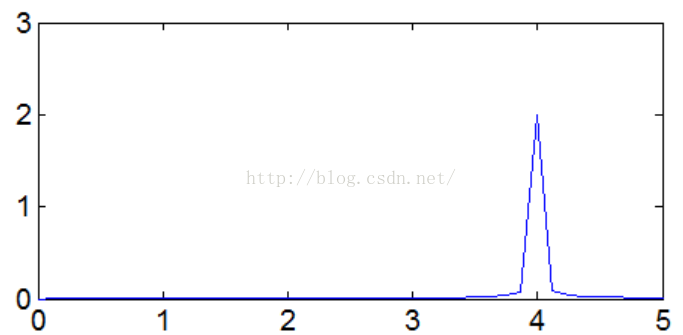
Figure2 仿真信号的傅里叶变换
当然根据信号在时域中的特征,我们可以知道,信号的一个周期就是相邻极大值到极大值(极小值到极限值)的区间。如下图3,分析图中曲线的特点,一个信号的周期检测只需要探测到相邻两个极大值(极限值)就能确定信号的周期,所以,这个问题可以表达为检测信号的极大值和极限值问题。当然极值点检测在Matlab中可以有max和min函数实现。找到极值点就能确定信号的周期,这也是经验模态分解(EMD)方法在对信号进行筛分的过程中也对信号极值进行检测的原因。
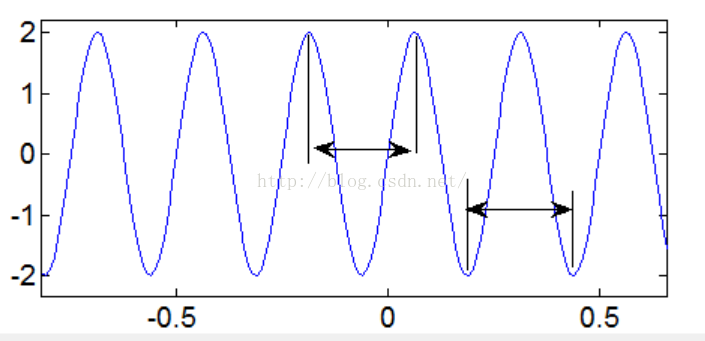
Figure3 极值间的周期表达
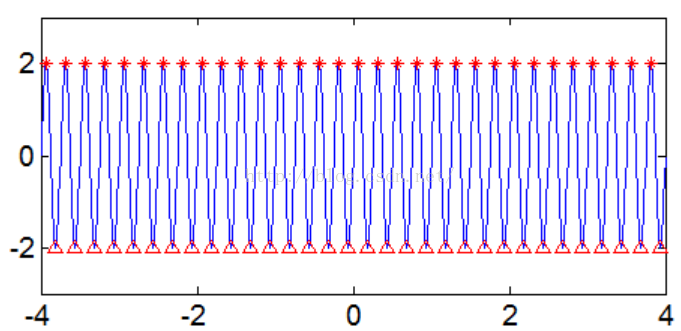
Figure4 周期信号的极值点检测
2、含噪确定性周期信号的周期检测
如果一个信号中存在噪声(实际工程运用中,几乎所有信号均含有噪声),利用极值查找方法基本都是不能有效检测信号周期的。当然用傅里叶分析进行周期性检测在本组信号中还是能得到良好结果。但是傅里叶分析仅仅适合平稳周期信号,对于非平稳信号进行周期性检测很难得到良好结果。
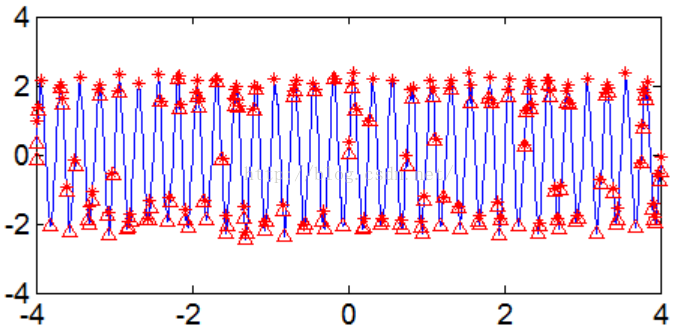
Figure5 含噪信号极值点周期性检测
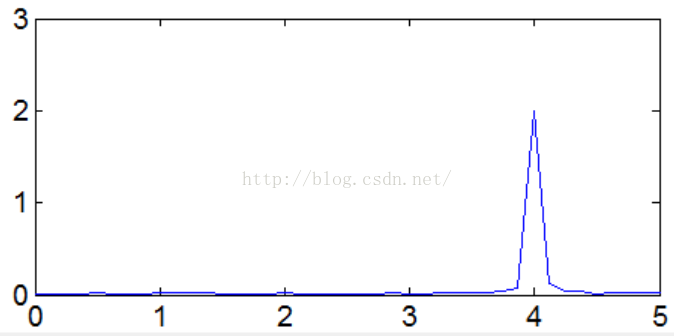
Figure6 傅里叶分析结果
对于信号,傅里叶分析很难检测到信号的一个变化周期(假设相邻两个极大值点为一个变化周期)。而极值点检测方法还是能有效检测到信号周期性变化(周期越来越小,频率越来越大)。当然对于含噪信号,极值点检测依然无能为力。
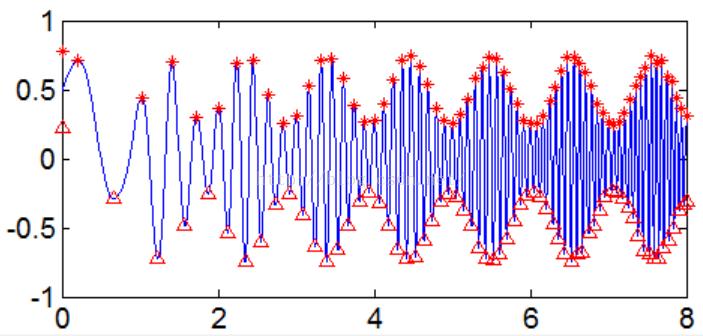
Figure7 调幅-调频信号变化周期检测
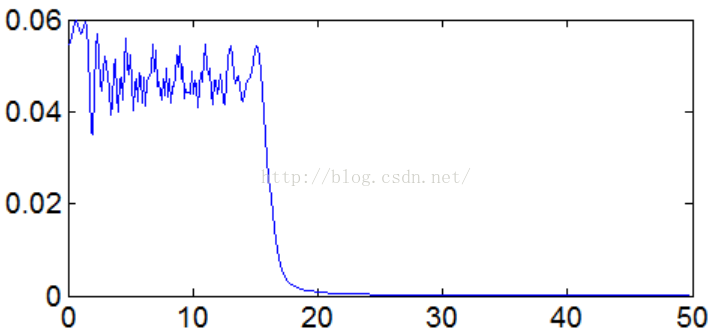
Figure8 调幅-调频信号的傅里叶周期检测
3、动态信号周期性检测
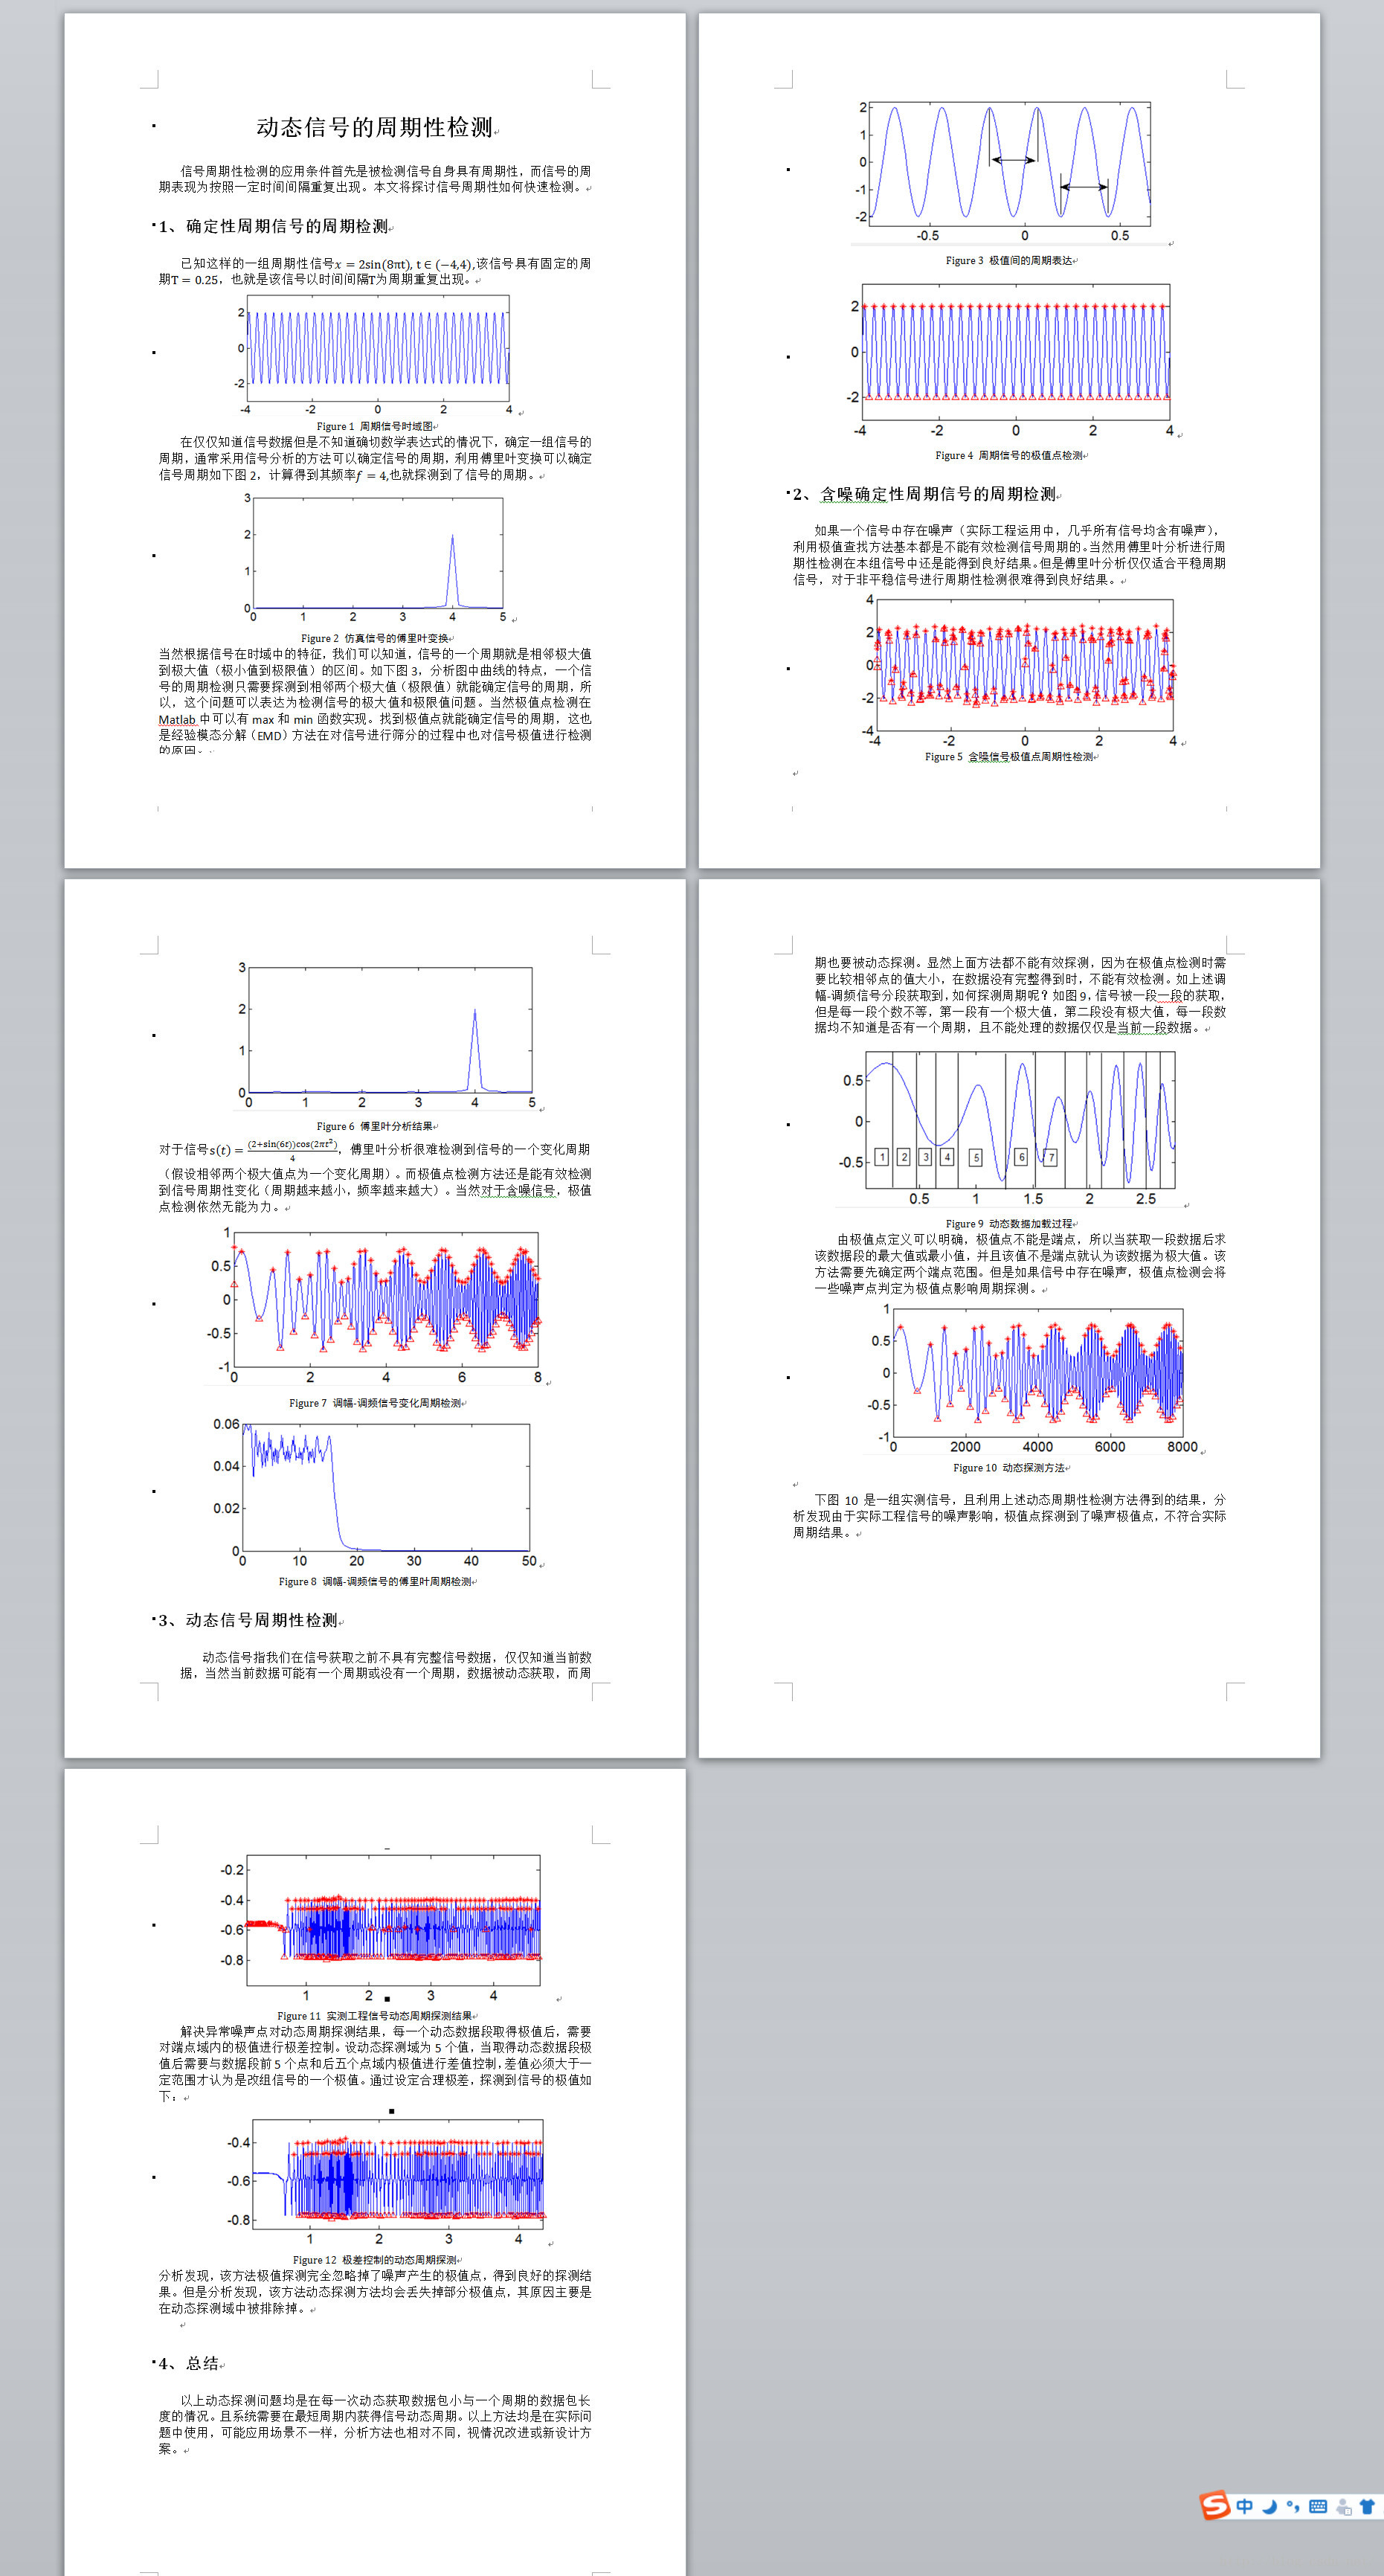
动态信号指我们在信号获取之前不具有完整信号数据,仅仅知道当前数据,当然当前数据可能有一个周期或没有一个周期,数据被动态获取,而周期也要被动态探测。显然上面方法都不能有效探测,因为在极值点检测时需要比较相邻点的值大小,在数据没有完整得到时,不能有效检测。如上述调幅-调频信号分段获取到,如何探测周期呢?如图9,信号被一段一段的获取,但是每一段个数不等,第一段有一个极大值,第二段没有极大值,每一段数据均不知道是否有一个周期,且不能处理的数据仅仅是当前一段数据。
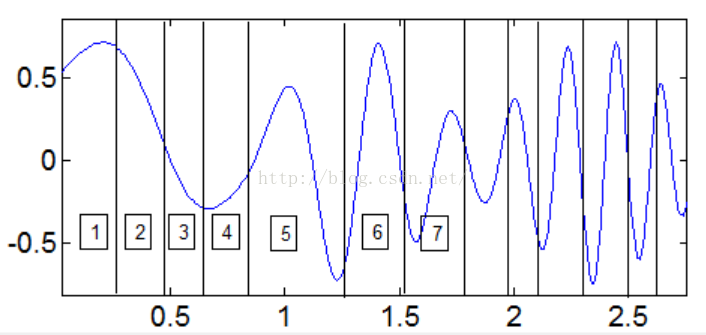
Figure9 动态数据加载过程
由极值点定义可以明确,极值点不能是端点,所以当获取一段数据后求该数据段的最大值或最小值,并且该值不是端点就认为该数据为极大值。该方法需要先确定两个端点范围。但是如果信号中存在噪声,极值点检测会将一些噪声点判定为极值点影响周期探测。
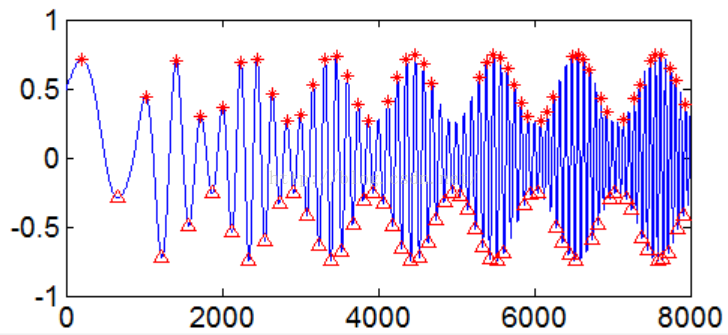
Figure10 动态探测方法
下图10是一组实测信号,且利用上述动态周期性检测方法得到的结果,分析发现由于实际工程信号的噪声影响,极值点探测到了噪声极值点,不符合实际周期结果。
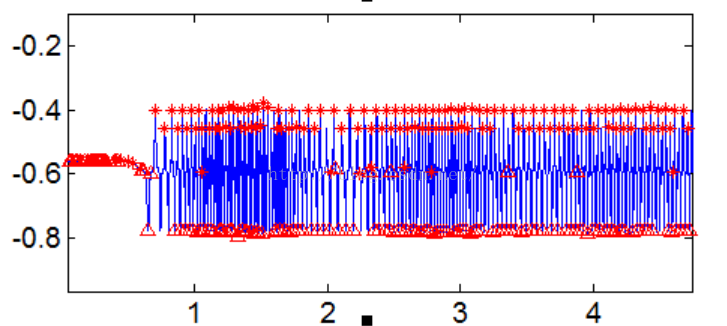
Figure11 实测工程信号动态周期探测结果
解决异常噪声点对动态周期探测结果,每一个动态数据段取得极值后,需要对端点域内的极值进行极差控制。设动态探测域为5个值,当取得动态数据段极值后需要与数据段前5个点和后五个点域内极值进行差值控制,差值必须大于一定范围才认为是改组信号的一个极值。通过设定合理极差,探测到信号的极值如下:
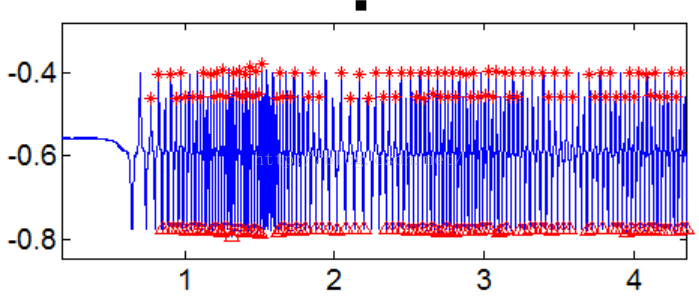
Figure12 极差控制的动态周期探测
分析发现,该方法极值探测完全忽略掉了噪声产生的极值点,得到良好的探测结果。但是分析发现,该方法动态探测方法均会丢失掉部分极值点,其原因主要是在动态探测域中被排除掉。
4、总结
以上动态探测问题均是在每一次动态获取数据包小与一个周期的数据包长度的情况。且系统需要在最短周期内获得信号动态周期。以上方法均是在实际问题中使用,可能应用场景不一样,分析方法也相对不同,视情况改进或新设计方案。
clc,clear all;
close all;
t=-4:0.01:4;

x=2*sin(8*pi*t);

figure
plot(t,x)
axis([-4,4,-3,3])

fs=100;
y=abs(fft(x))*2/length(x);
ff=(fs/length(x))*(0:1:(length(x)-1));
figure
plot(ff(1:length(x)/2),y(1:length(x)/2))
axis([0,5,0,3])

figure
plot(t,x)
axis([-4,4,-3,3])
hold on

maxitem=find(x>=max(x)-0.01);
minitem=find(x<=min(x)+0.01);
plot(t(maxitem),x(maxitem),'r*')
plot(t(minitem),x(minitem),'r^')
hold off

xx=x+0.2*randn(1,length(x))
figure
plot(t,xx)
[spmax,spmin]=extrema(xx);
hold on
plot(t(spmax(:,1)),spmax(:,2),'r*')
plot(t(spmin(:,1)),spmin(:,2),'r^')
hold off

yy=abs(fft(xx))*2/length(xx);
figure
plot(ff(1:length(xx)/2),yy(1:length(xx)/2))
axis([0,5,0,3])


t2=0:0.01:8;
x1=((2+sin(6*t2)).*cos(2*pi*t2.^2))/4;
figure
plot(t2,x1)
[spmax,spmin]=extrema(x1);
hold on
plot(t2(spmax(:,1)),spmax(:,2),'r*')
plot(t2(spmin(:,1)),spmin(:,2),'r^')
hold off

y1=abs(fft(x1))*2/length(x1);
f1=(fs/length(x1))*(0:1:(length(x1)-1));
figure
plot(f1(1:length(x1)/2),y1(1:length(x1)/2))
%axis([0,5,0,3])


t3=0:0.001:8;
v2=((2+sin(6*t3)).*cos(2*pi*t3.^2))/4;
num=100;
newnum=2;
newerro=0.0001;
n=0;
m=0;
for i=2:fix(length(v2)/num)

    [maxnum,maxitem]=max(v2(num*(i-1)+1:(num*i)));

    [minnum,minitem]=min(v2(num*(i-1)+1:(num*i)));
    vum=v2((num*(i-1)-2*newnum)+1:(num*i));

    %if (newnum<maxitem) && (maxitem<(num-newnum))%
    if (newnum<maxitem) && (maxitem<(num-newnum) && abs(maxnum-max(max(vum(1:newnum)),max(vum((num-newnum):num))))>newerro)

        n=n+1;
        item1(n)=maxitem+(i-1)*num;
    end

   % if (newnum<minitem) && (minitem<(num-newnum))
    if(newnum<minitem) && (minitem<(num-newnum) && abs(minnum-min(min(vum(1:newnum)),min(vum((num-newnum):num))))>newerro)

        m=m+1;
        item2(m)=minitem+(i-1)*num;
    end

end
figure
plot(1:length(v2),v2)
hold on
plot(item1,v2(item1),'*r')
plot(item2,v2(item2),'^r')
</pre><pre name="code" class="plain">%  function [spmax, spmin, flag]= extrema(in_data)
%
%
%   function [spmax, spmin, flag]= extrema(in_data)
%
% INPUT:
%       in_data: Inputted data, a time series to be sifted;
% OUTPUT:
%       spmax: The locations (col 1) of the maxima and its corresponding
%              values (col 2)
%       spmin: The locations (col 1) of the minima and its corresponding
%              values (col 2)


function [spmax, spmin, flag]= extrema(in_data)


flag=1;
dsize=length(in_data);


%part1.--find local max value and do end process


%start point
%spmax(1,1)-the first 1 means first point max value,the second 1 means first index
%spmax(1,2)-the first 1 means first point max value,the second 2 means first index
%spmax(1,1)-for position of max
%spmax(1,2)-for value    of max


spmax(1,1) = 1;
spmax(1,2) = in_data(1);


%Loop --start find max by compare the values
%when [ (the jj th value > than the jj-1 th value ) AND (the jj th value > than the jj+1 th value )
%the value jj is the position of the max
%the value in_data (jj) is the value of the max
%do the loop by index-jj
%after the max value is found,use index -kk to store in the matrix
%kk=1,the start point
%the last value of kk ,the end point


jj=2;
kk=2;
while jj<dsize,
    if ( in_data(jj-1)<=in_data(jj) & in_data(jj)>=in_data(jj+1) )
        spmax(kk,1) = jj;
        spmax(kk,2) = in_data (jj);
        kk = kk+1;
    end
    jj=jj+1;
end


%end point
spmax(kk,1)=dsize;
spmax(kk,2)=in_data(dsize);


%End point process-please see reference about spline end effect
%extend the slpoe of neighbor 2 max value ---as extend value
%original value of end point -----as original value
%compare extend and original value


if kk>=4
    slope1=(spmax(2,2)-spmax(3,2))/(spmax(2,1)-spmax(3,1));
    tmp1=slope1*(spmax(1,1)-spmax(2,1))+spmax(2,2);
    if tmp1>spmax(1,2)
        spmax(1,2)=tmp1;
    end


    slope2=(spmax(kk-1,2)-spmax(kk-2,2))/(spmax(kk-1,1)-spmax(kk-2,1));
    tmp2=slope2*(spmax(kk,1)-spmax(kk-1,1))+spmax(kk-1,2);
    if tmp2>spmax(kk,2)
        spmax(kk,2)=tmp2;
    end
else
    flag=-1;
end


%these 4 sentence seems useless.
msize=size(in_data);
dsize=max(msize);
xsize=dsize/3;
xsize2=2*xsize;


%part2.--find local min value and do end process
%the syntax are all similar with part1.
%here-explan with beginning local max-find upper starting envelope
%the end process procedure-find out the neighbor 2 local extrema value
%connect those 2 local extrema and extend the line to the end
%make judgement with 1).line extend value  2).original data value
%the bigger value is chosen for upper envelope end control point


%local max
spmin(1,1) = 1;
spmin(1,2) = in_data(1);
jj=2;
kk=2;
while jj<dsize,
    if ( in_data(jj-1)>=in_data(jj) & in_data(jj)<=in_data(jj+1))
        spmin(kk,1) = jj;
        spmin(kk,2) = in_data (jj);
        kk = kk+1;
    end
    jj=jj+1;
end


%local min
spmin(kk,1)=dsize;
spmin(kk,2)=in_data(dsize);


if kk>=4
    slope1=(spmin(2,2)-spmin(3,2))/(spmin(2,1)-spmin(3,1));
    tmp1=slope1*(spmin(1,1)-spmin(2,1))+spmin(2,2);
    if tmp1<spmin(1,2)
        spmin(1,2)=tmp1;
    end


    slope2=(spmin(kk-1,2)-spmin(kk-2,2))/(spmin(kk-1,1)-spmin(kk-2,1));
    tmp2=slope2*(spmin(kk,1)-spmin(kk-1,1))+spmin(kk-1,2);
    if tmp2<spmin(kk,2)
        spmin(kk,2)=tmp2;
    end
else
    flag=-1;
end


flag=1;
最后
以上就是潇洒苗条最近收集整理的关于动态信号周期性检测动态信号的周期性检测的全部内容,更多相关动态信号周期性检测动态信号内容请搜索靠谱客的其他文章。


发表评论 取消回复