% Power Spectral Density Estimates Using FFT
% pr8_2_1
clear all; clc; close all;
randn('state',0); % 随机数初始化
Fs = 1000; % 采样频率
t = 0:1/Fs:1-1/Fs; % 时间刻度
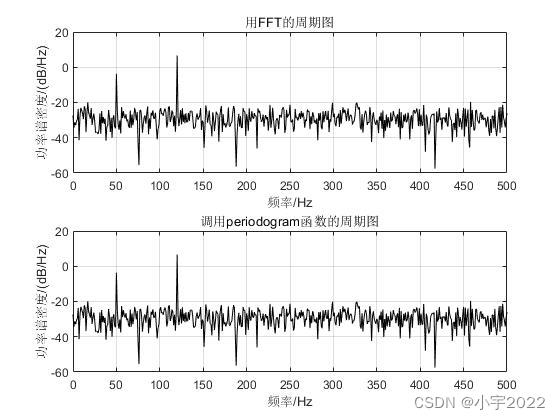
f1=50; f2=120; % 两个正弦分量频率
x=cos(2*pi*f1*t)+3*cos(2*pi*f2*t)+randn(size(t)); % 信号
% 使用FFT
N = length(x); % x长度
xdft = fft(x); % FFT
xdft = xdft(1:N/2+1); % 取正频率
psdx = (1/(Fs*N)) * abs(xdft).^2; % 计算功率谱密度
psdx(2:end-1) = 2*psdx(2:end-1); % 乘2(2:end-1)
freq = 0:Fs/length(x):Fs/2; % 频率刻度
subplot 211
plot(freq,10*log10(psdx),'k') % 取对数作图
grid on; xlim([0 Fs/2]);
title('用FFT的周期图')
xlabel('频率/Hz')
ylabel('功率谱密度/(dB/Hz)')
% 调用periodogram函数
[Pxx,f]=periodogram(x,rectwin(length(x)),N,Fs);
subplot 212
plot(freq,10*log10(Pxx),'k'); % 取对数作图
grid on; xlim([0 Fs/2]);
title('调用periodogram函数的周期图')
xlabel('频率/Hz')
ylabel('功率谱密度/(dB/Hz)')
mxerr = max(psdx'-Pxx) % 求两种方法的最大差值
set(gcf,'color','w');
最后
以上就是虚拟美女最近收集整理的关于Power Spectral Density Estimates Using FFT---MATLAB的全部内容,更多相关Power内容请搜索靠谱客的其他文章。
本图文内容来源于网友提供,作为学习参考使用,或来自网络收集整理,版权属于原作者所有。


发表评论 取消回复