创建简单的图例
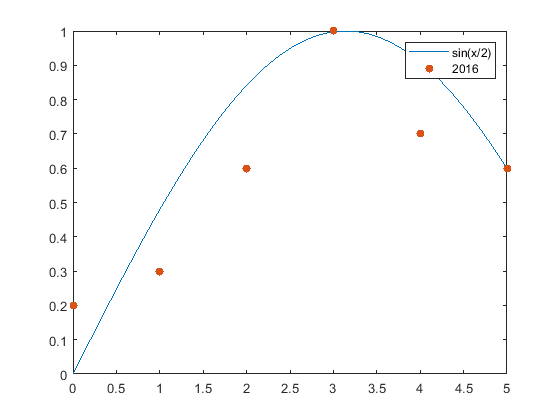
创建一个具有线图和散点图的图窗。为每个图添加具有说明的图例。将图例标签指定为 legend 函数的输入。
figure
x1 = linspace(0,5);
y1 = sin(x1/2);
plot(x1,y1)
hold on
x2 = [0 1 2 3 4 5];
y2 = [0.2 0.3 0.6 1 0.7 0.6];
scatter(x2,y2,'filled')
hold off
legend('sin(x/2)','2016')
使用 DisplayName 指定标签
您也可以使用 DisplayName 属性指定图例标签。调用绘图函数时,将 DisplayName 属性设置为名称-值对组。然后,调用 legend 命令创建图例。
x1 = linspace(0,5);
y1 = sin(x1/2);
plot(x1,y1,'DisplayName','sin(x/2)')
hold on
x2 = [0 1 2 3 4 5];
y2 = [0.2 0.3 0.6 1 0.7 0.6];
scatter(x2,y2,'filled','DisplayName','2016')
legend
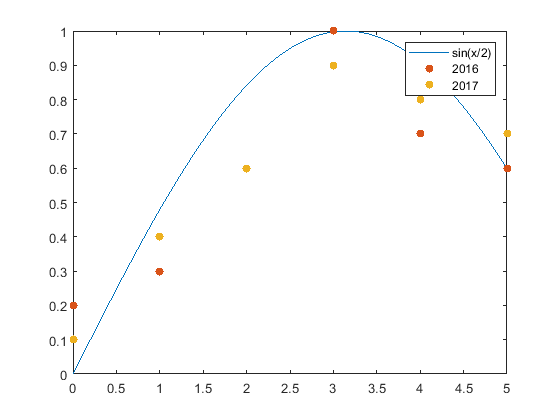
添加或删除数据序列时,图例会自动更新。如果您向坐标区添加更多数据,请使用 DisplayName 属性指定标签。如果不设置 DisplayName 属性,则图例使用 'dataN' 形式的标签。
添加 2017 年数据的散点图。
x3 = [0 1 2 3 4 5];
y3 = [0.1 0.4 0.6 0.9 0.8 0.7];
scatter(x3,y3,'filled','DisplayName','2017')
drawnow
hold off
自定义图例外观
legend 函数会创建一个 Legend 对象。Legend 对象具有可用于自定义图例外观的属性,如 Location、Orientation、FontSize 和 Title 属性。有关完整列表,请参阅Legend 属性。
您可以通过两种方式设置属性:
在 legend 命令中使用名称-值对组。在大多数情况下,当您使用名称-值对组时,必须在元胞数组中指定标签,例如 legend({'label1','label2'},'FontSize',14)。
使用 Legend 对象。您可以将 Legend 对象作为 legend 函数的输出参数返回,例如 lgd = legend。然后,通过圆点表示法使用 lgd 来设置属性,如 lgd.FontSize = 14。
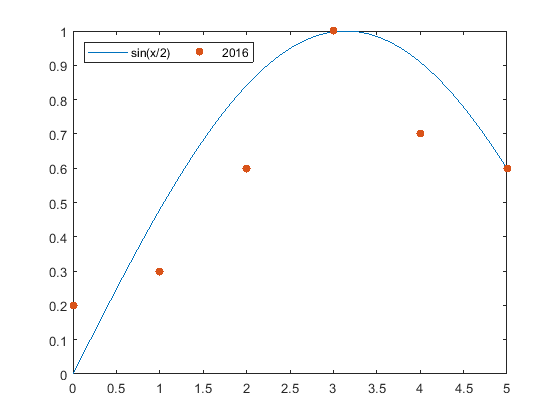
图例位置和方向
通过将 Location 和 Orientation 属性设置为名称-值对组来指定图例的位置和方向。将位置设置为八个基本及斜角方位之一,在本例中为 'northwest'。将方向设置为 'vertical'(默认)或 'horizontal'(在本例中为后者)。以元胞数组形式指定标签。
x1 = linspace(0,5);
y1 = sin(x1/2);
plot(x1,y1)
hold on
x2 = [0 1 2 3 4 5];
y2 = [0.2 0.3 0.6 1 0.7 0.6];
scatter(x2,y2,'filled')
hold off
legend({'sin(x/2)','2016'},'Location','northwest','Orientation','horizontal')
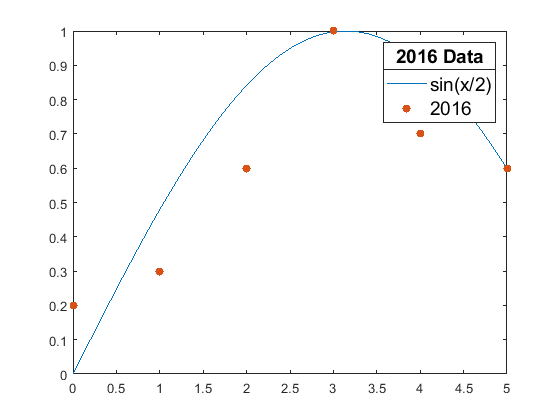
图例字体大小和标题
通过设置 FontSize 和 Title 属性来指定图例字体大小和标题。将 Legend 对象赋给变量 lgd。然后,通过圆点表示法使用 lgd 更改属性。
x1 = linspace(0,5);
y1 = sin(x1/2);
plot(x1,y1,'DisplayName','sin(x/2)')
hold on
x2 = [0 1 2 3 4 5];
y2 = [0.2 0.3 0.6 1 0.7 0.6];
scatter(x2,y2,'filled','DisplayName','2016')
hold off
lgd = legend;
lgd.FontSize = 14;
lgd.Title.String = '2016 Data';
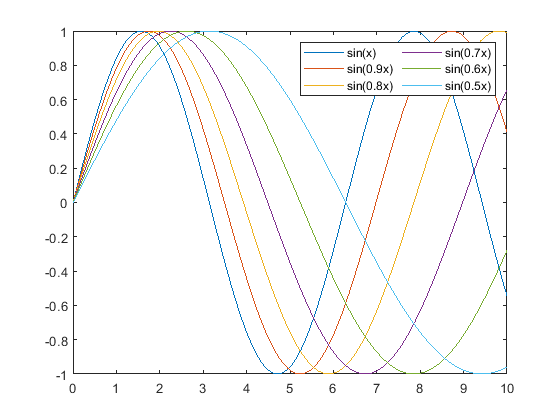
具有多列的图例
创建一个包含六个线图的图。通过将 NumColumns 属性设置为 2 来添加一个具有两列的图例。
x = linspace(0,10);
y1 = sin(x);
y2 = sin(0.9*x);
y3 = sin(0.8*x);
y4 = sin(0.7*x);
y5 = sin(0.6*x);
y6 = sin(0.5*x);
plot(x,y1,'DisplayName','sin(x)')
hold on
plot(x,y2,'DisplayName','sin(0.9x)')
plot(x,y3,'DisplayName','sin(0.8x)')
plot(x,y4,'DisplayName','sin(0.7x)')
plot(x,y5,'DisplayName','sin(0.6x)')
plot(x,y6,'DisplayName','sin(0.5x)')
hold off
lgd = legend;
lgd.NumColumns = 2;
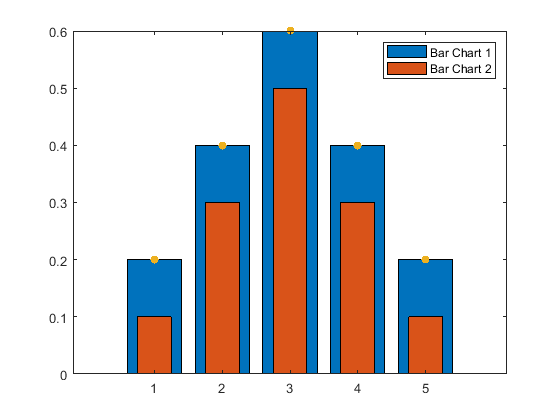
在图例中包含图的子集
合并两个条形图和一个散点图。将 Bar 对象 b1 和 b2 指定为 legend 函数的第一个输入参数,创建一个仅包含条形图的图例。以向量形式指定对象。
x = [1 2 3 4 5];
y1 = [.2 .4 .6 .4 .2];
b1 = bar(x,y1);
hold on
y2 = [.1 .3 .5 .3 .1];
b2 = bar(x,y2,'BarWidth',0.5);
y3 = [.2 .4 .6 .4 .2];
s = scatter(x,y3,'filled');
hold off
legend([b1 b2],'Bar Chart 1','Bar Chart 2')
最后
以上就是老实烤鸡最近收集整理的关于matlab散点图加图例,将图例添加到图 - MATLAB & Simulink - MathWorks 中国的全部内容,更多相关matlab散点图加图例,将图例添加到图 -内容请搜索靠谱客的其他文章。


发表评论 取消回复