1.基本绘图函数
plot(Y):其中输入参数Y就是Y轴的数据,一般习惯性输入向量
plot(X1,Y1,LineSpec,...,Xn,Yn,LineSpec):LineSpec为选项(开关量)字符串,用于设置曲线颜色、线型、数据点等;LineSpec的标准设定值见表1,前7种颜色依序(蓝、绿、红、青、品红、黄、黑)自动着色。
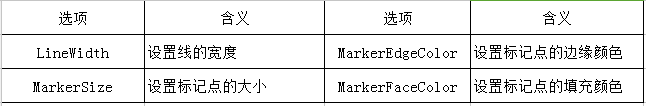
plot(X1,Y1,LineSpec,'PropertyName',PropertyValue):对所有用plot函数创建的图形进行属性值设置,常用属性见表2
h=plot(X1,Y1,LineSpec,'PropertyName',PropertyValue):返回绘制函数的句柄值h
loglog函数、semilogx函数与semilogy函数的用法与plot函数的用法类似。
表1常用的绘图选项
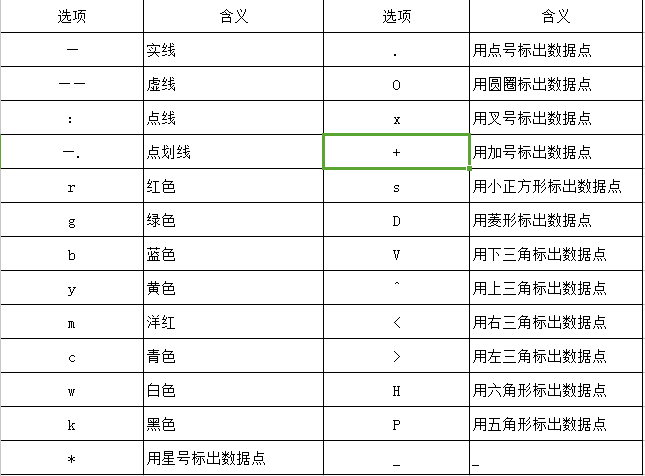
表2 常用属性
2.修饰图形
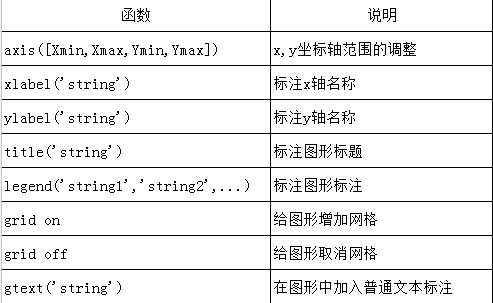
常用的图形修饰函数名称及其说明如表3
表3 常用图形修改函数及其说明
3.实例
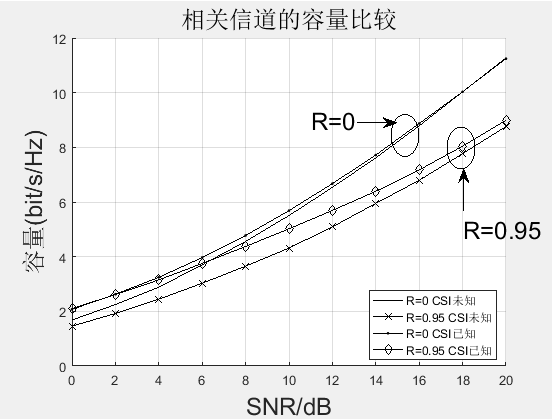
题:相关对MIMO系统容量影响仿真
程序:
clear all;
close all;
clc
M=5000;
R=[0.2 0.95];%相关矩阵
SNR=[0:2:20];
figure;
xlabel('SNR/dB','Fontsize',18);
ylabel('容量(bit/s/Hz)','Fontsize',18);
title('相关信道的容量比较','Fontsize',18)
grid on;
hold on;
for l=1:length(R)
    R_t=eye(2);
    R_r=[1 R(l);R(l) 1];
    for snr_idx=1:length(SNR)
        snr=10^(SNR(snr_idx)/10);
        for m=1:M
            Hw=(randn(2,2)+1i*randn(2,2))/sqrt(2);
            H=R_r^(.5)*Hw*R_t^(.5);
            C(m,snr_idx)=log2((det(eye(2)+snr*H*H'/2)));
        end
        Capacity(snr_idx,l)=mean(C(:,snr_idx));
    end
end
plot(SNR,Capacity(:,1),'k -',SNR, Capacity(:,2),'kx -');

for l=1:length(R)
    R_t=eye(2);
    R_r=[1 R(l);R(l) 1];
    for snr_idx=1:length(SNR)
        snr=10^(SNR(snr_idx)/10);
        for m=1:M
            Hw=(randn(2,2)+1i*randn(2,2))/sqrt(2);
            H=R_r^(.5)*Hw*R_t^(.5);
            [gamma,eigs]=pwr_modes(H,snr);
            C(m,snr_idx)=sum(log2(real(1+eigs.*gamma*snr/2)));
        end
        Capacity(snr_idx,l)=mean(C(:,snr_idx));
    end
end
plot(SNR,Capacity(:,1),'k - .',SNR,Capacity(:,2),'kd -');
legend('R=0 CSI未知','R=0.95 CSI未知','R=0 CSI已知','R=0.95 CSI已知','Location','Best');

dim1=[0.7 0.63 0.05 0.1];
annotation('ellipse',dim1)
annotation('arrow',[0.64 0.71],[0.71 0.71])
text(11,9,'fontsize{18}R=0');

dim2=[0.8 0.6 0.05 0.1];
annotation('ellipse',dim2)
annotation('arrow',[0.83 0.83],[0.5 0.6])
text(18,5,'fontsize{18}R=0.95');
图1 相关信道容量比较图
最后
以上就是单薄丝袜最近收集整理的关于在MATLAB中的图例标注及实例说明的全部内容,更多相关在MATLAB中内容请搜索靠谱客的其他文章。
本图文内容来源于网友提供,作为学习参考使用,或来自网络收集整理,版权属于原作者所有。


发表评论 取消回复