我是靠谱客的博主 纯真短靴,这篇文章主要介绍(AHB VIP为例)Verdi UVM/interactive debug mode简单使用一、编译和仿真相关选项解释:二.使用Verdi UVM/interactive debug mode使用方法一三.使用Verdi UVM/interactive debug mode使用方法二四.UVM的ral和sequencer。五.reverse和breakpoint。其他问题:,现在分享给大家,希望可以做个参考。
一、编译和仿真相关选项解释:
1.dump UVM component波形相关的选项。
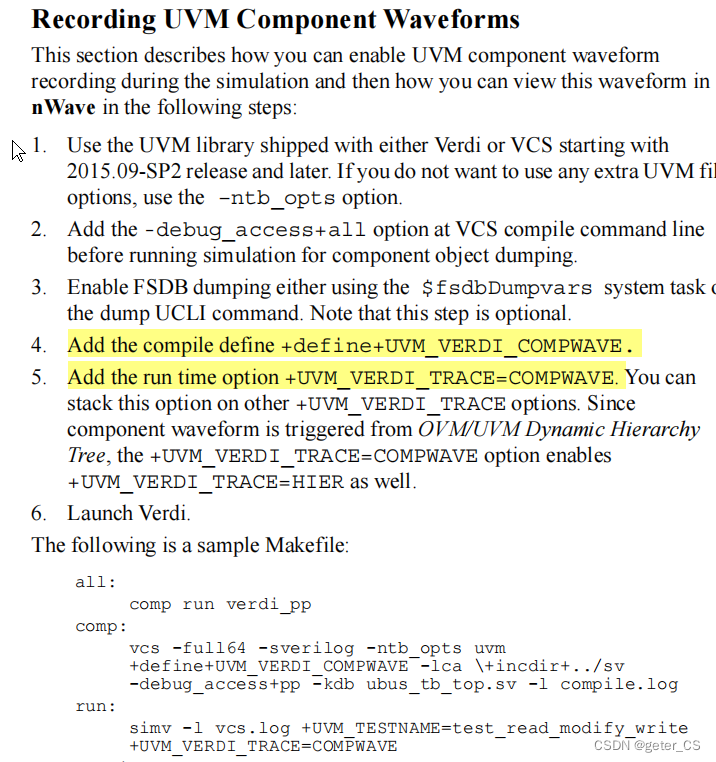
uvm debug guide
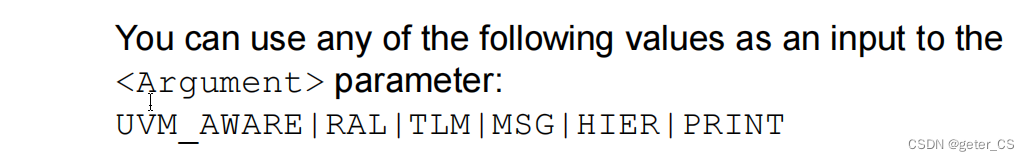
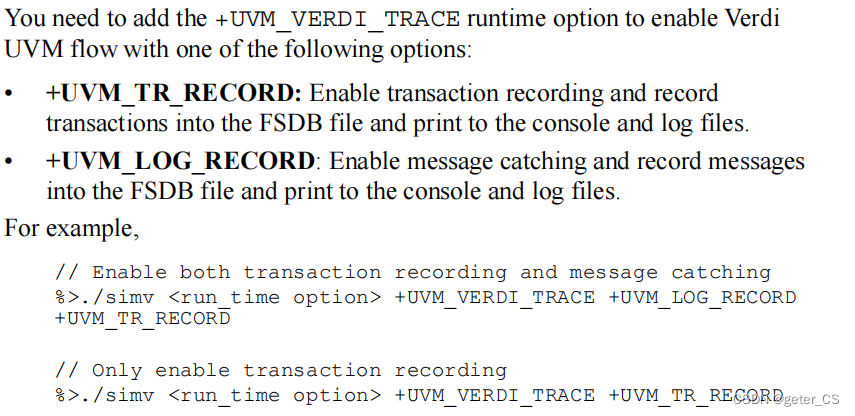
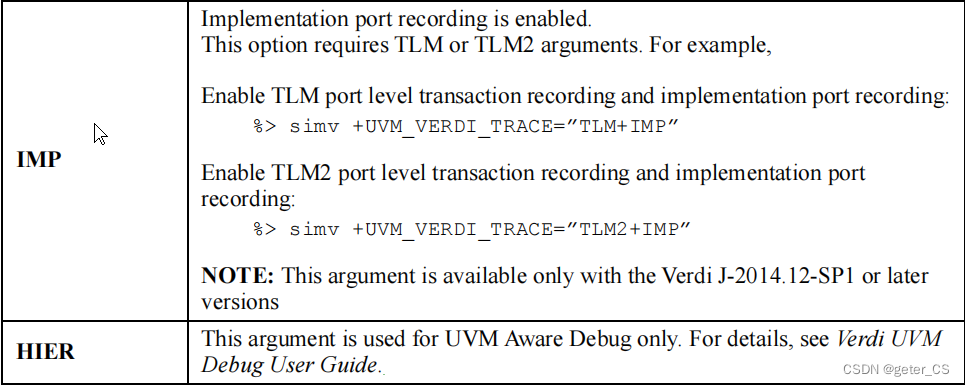
2.run中UVM_VERDI_TRACE可以添加的选项:
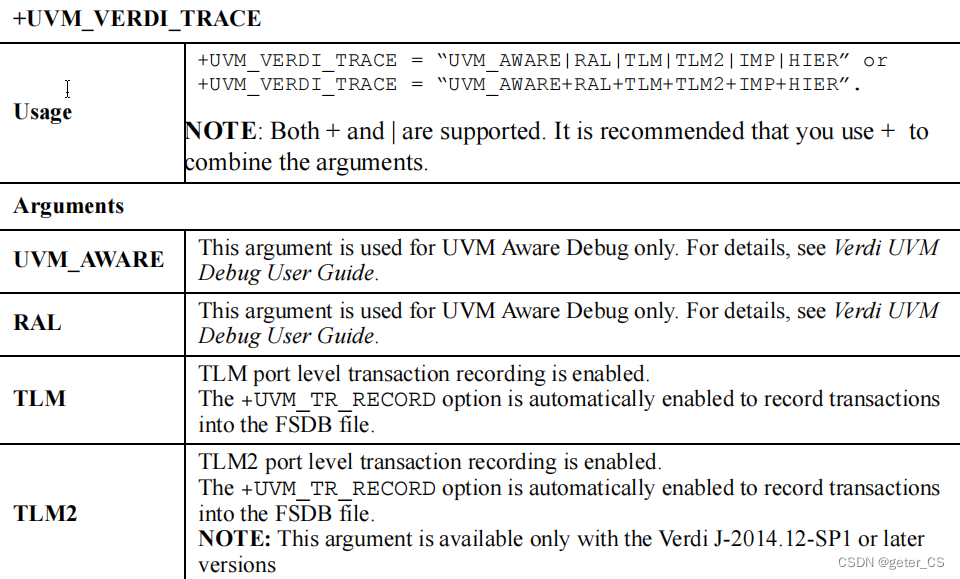
+UVM_VERDI_TRACE=UVM_AWARE+RAL+TLM+TLM1+IMP+MSG+HIER+PRINT+COMPWAVE。
a.COMPWAVE是上面dump波形用的,如果使用COMPWAVE实际上HIER也是enable的。(COMPWAVE这个选项在VCS2020,verdi2020上使用时报错了)
b.UVM_AWARE这个选项,在tool->pref->simu中的UVM Debug box被选上会被使能。
c.HIER使能OVM/UVM的hirechy tree,并且使能对TLM port连接情况的dump。
d.RAL使能对寄存器历史的dump。
from vcs user guide
from trans and pro debug user guide
from trans and pro debug user guide
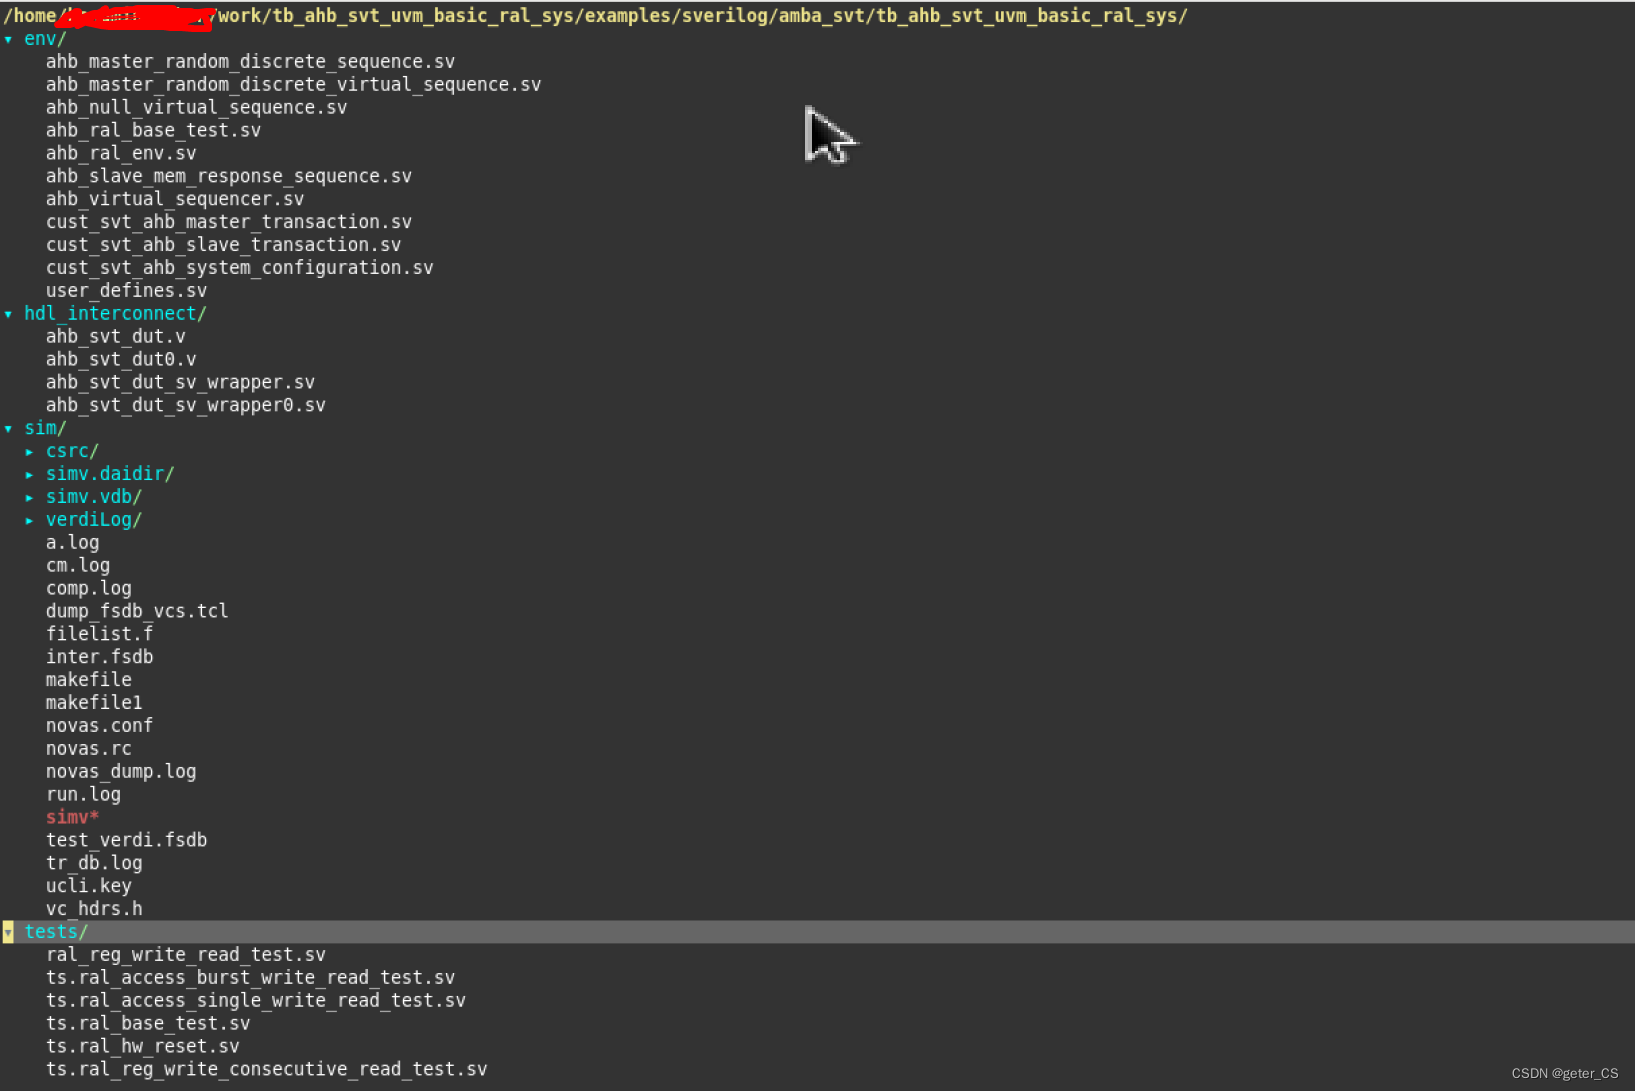
下面例子中使用的环境是AMBA AHB的VIP中example:tb_ahb_svt_uvm_basic_ral_sys。
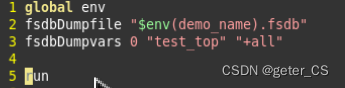
dump tcl:
dir:
二.使用Verdi UVM/interactive debug mode使用方法一
run中不加相关选项,但是注意comp中UVM_VERDI_COMPWAVE和reverse(
reverse目的是为了单步调试时可以进行返回上一步操作)得加上,这样先跑一次make comp,得到结果后(或者说编译后),使用verdi打开(直接verdi -dbdir simv.daidir -nologo &)。或者也可以直接 make,将run一起运行了,接着将结果使用verdi -ssf name.fsdb &打开(因为经常是完整跑完后debug,所以我使用后一种多些)。
此时打开的verdi窗口,会看见。如下没有OVM/UVM HIER,phase view, sequence view等都是灰色。
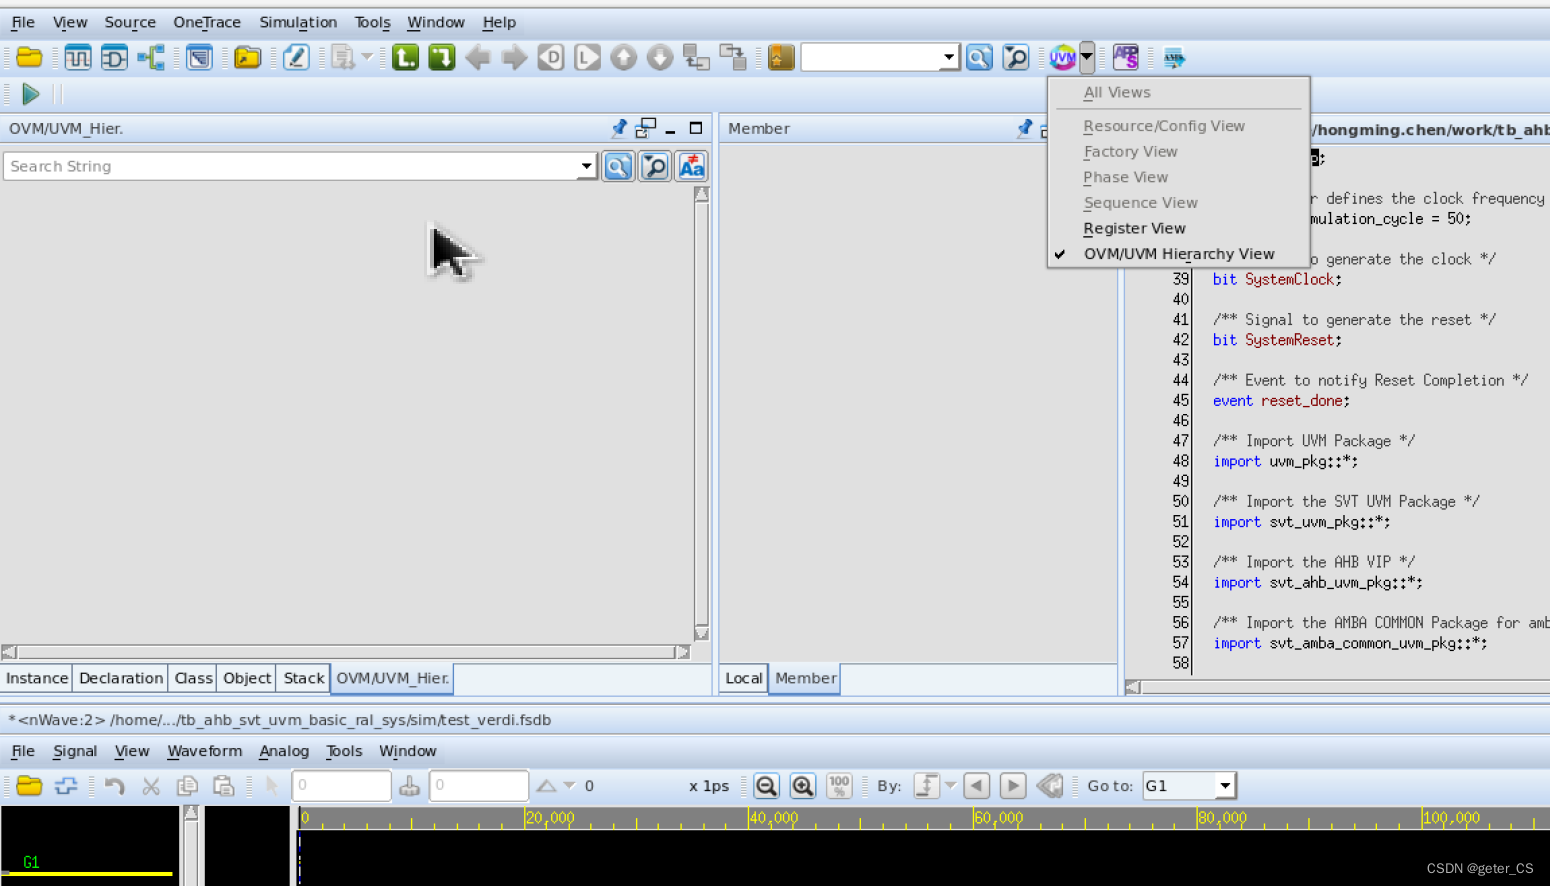
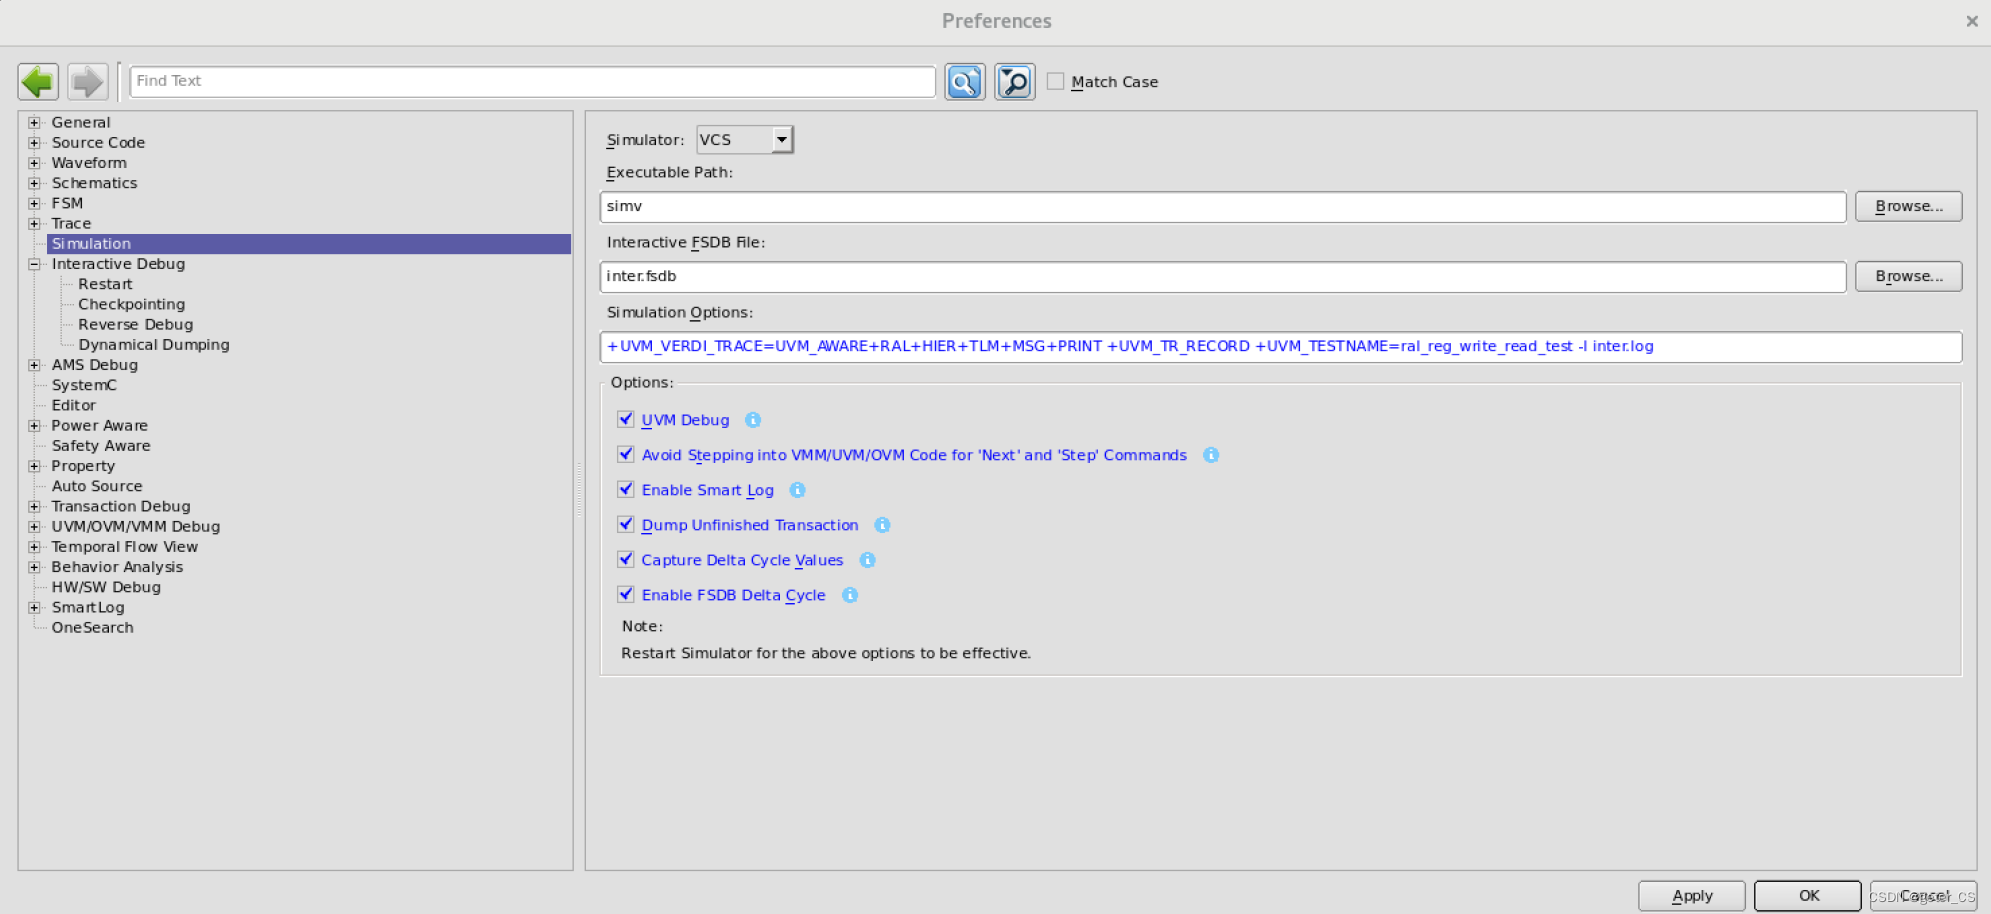
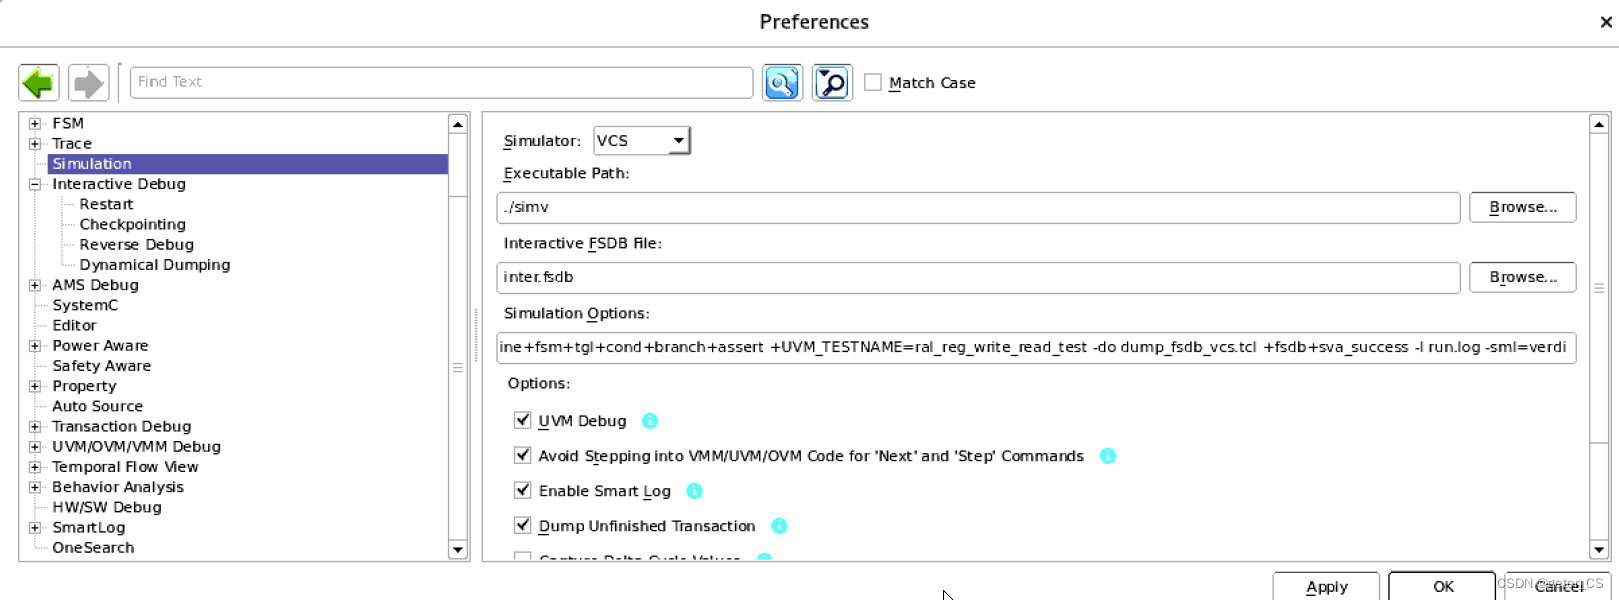
接着可以在tool->prefer->simulation中设置好sim是的相关选项,包括interactive的fsdb文件名(默认是inter.fsdb)以及excutable path。同时根据上面所介绍的将设置sim时的选项(Option)加上。注意一定加上uvm test name。不然找不到simulation的test。simulator设置为vcs。并且设置-l inter.log保存simulation的log。然后apply之后点ok保存。
接着点击wimdows->interactive debug mode,进入debug mode模式。接着点击绿色的三角按钮进入simulation。
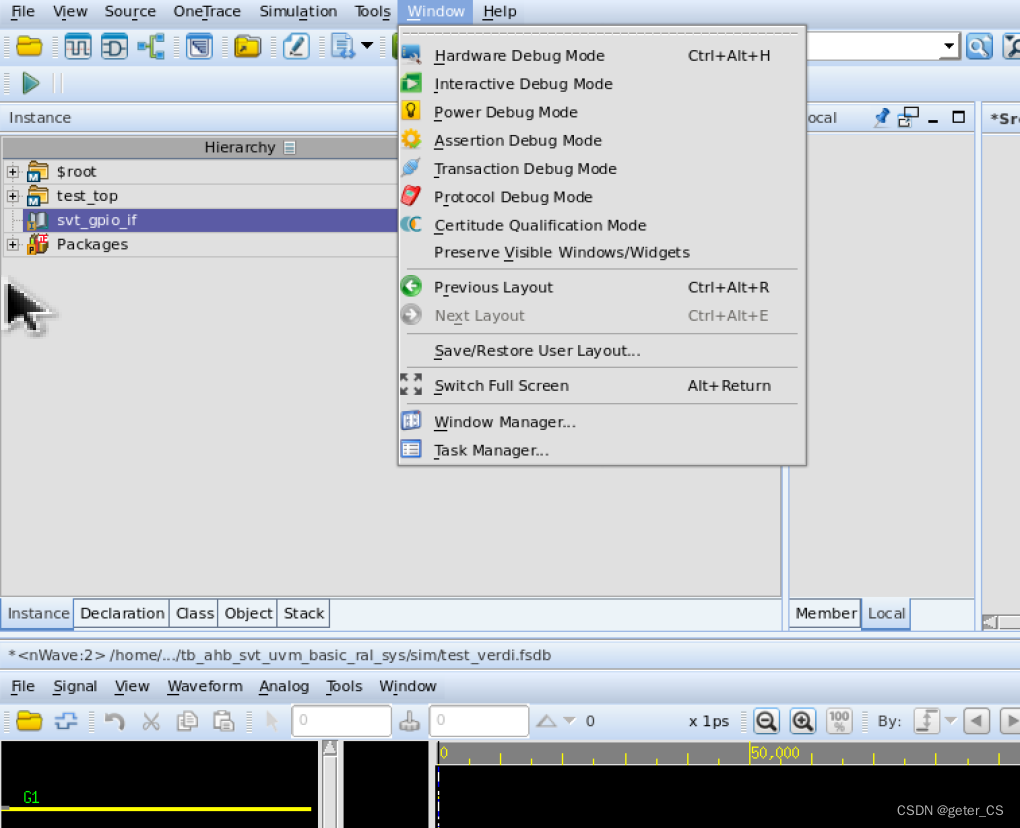
此时UVM按钮里面所有选项都是黑色了,然后再点击绿色的箭头,就开始进行simulation了。如果没有设置断点什么的,会直接仿真完。
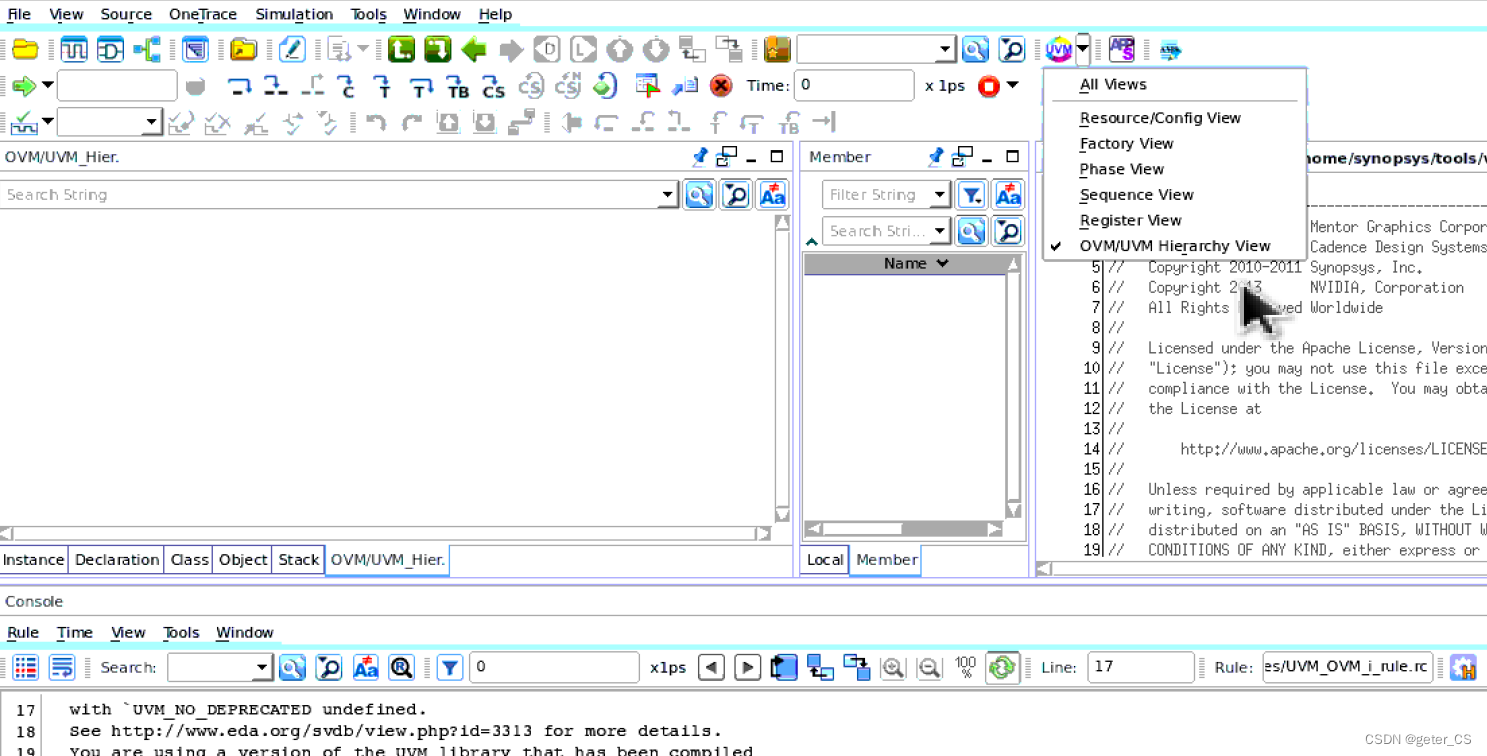
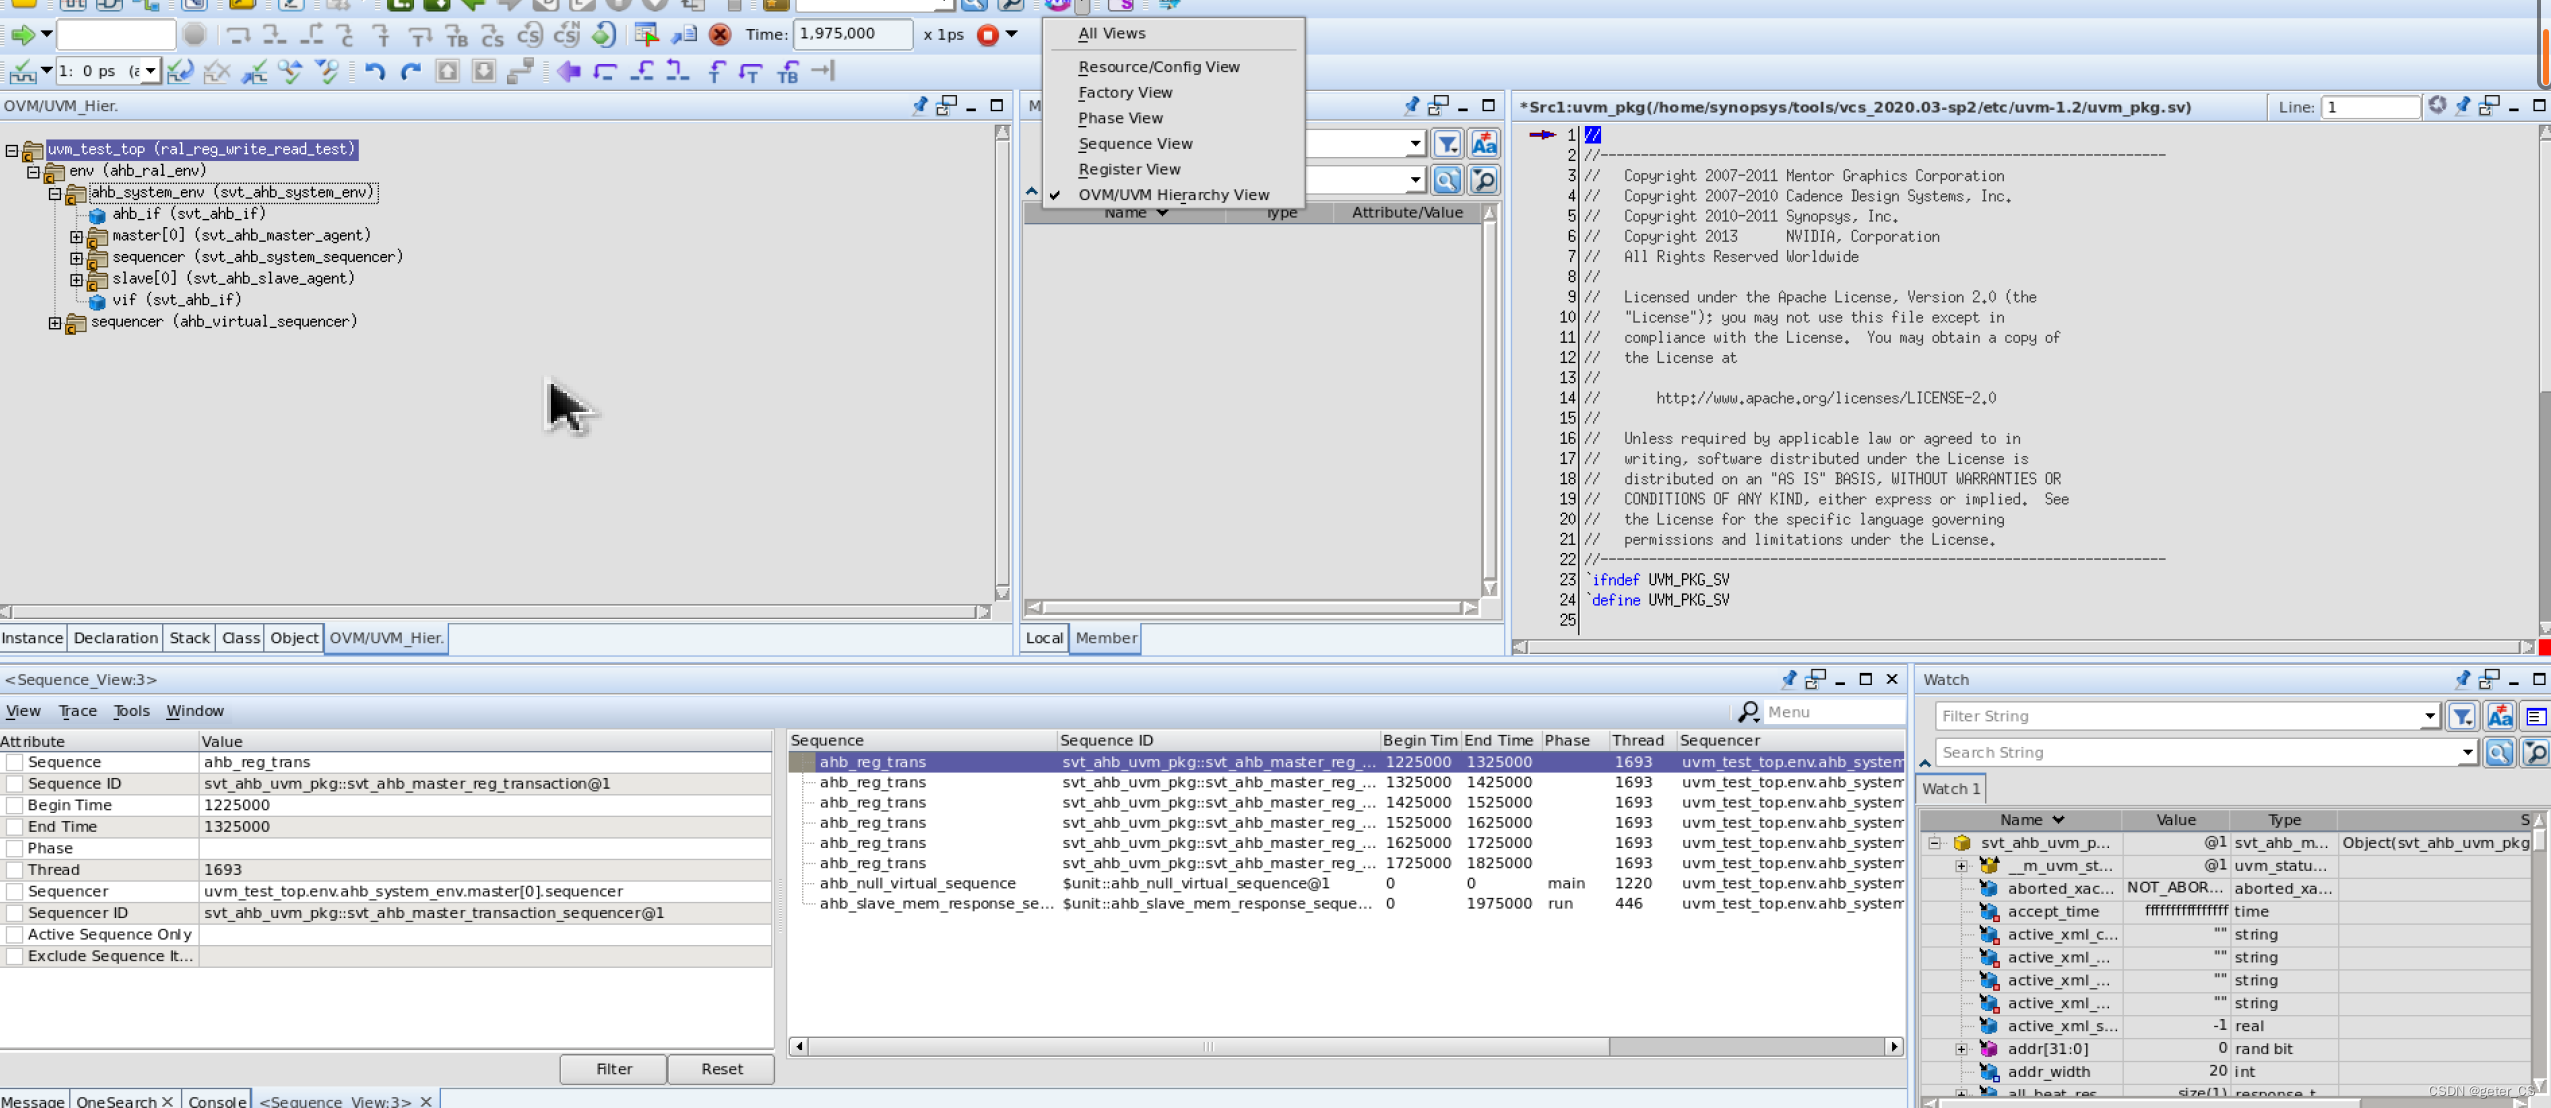
当simulation后,再看ovm/uvm heir就会显示出来。
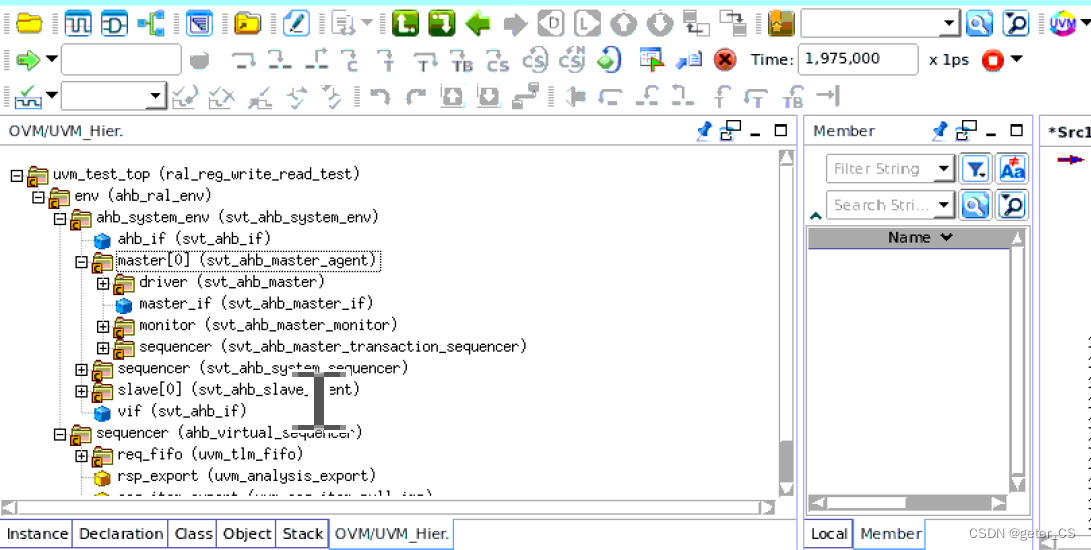
三.使用Verdi UVM/interactive debug mode使用方法二
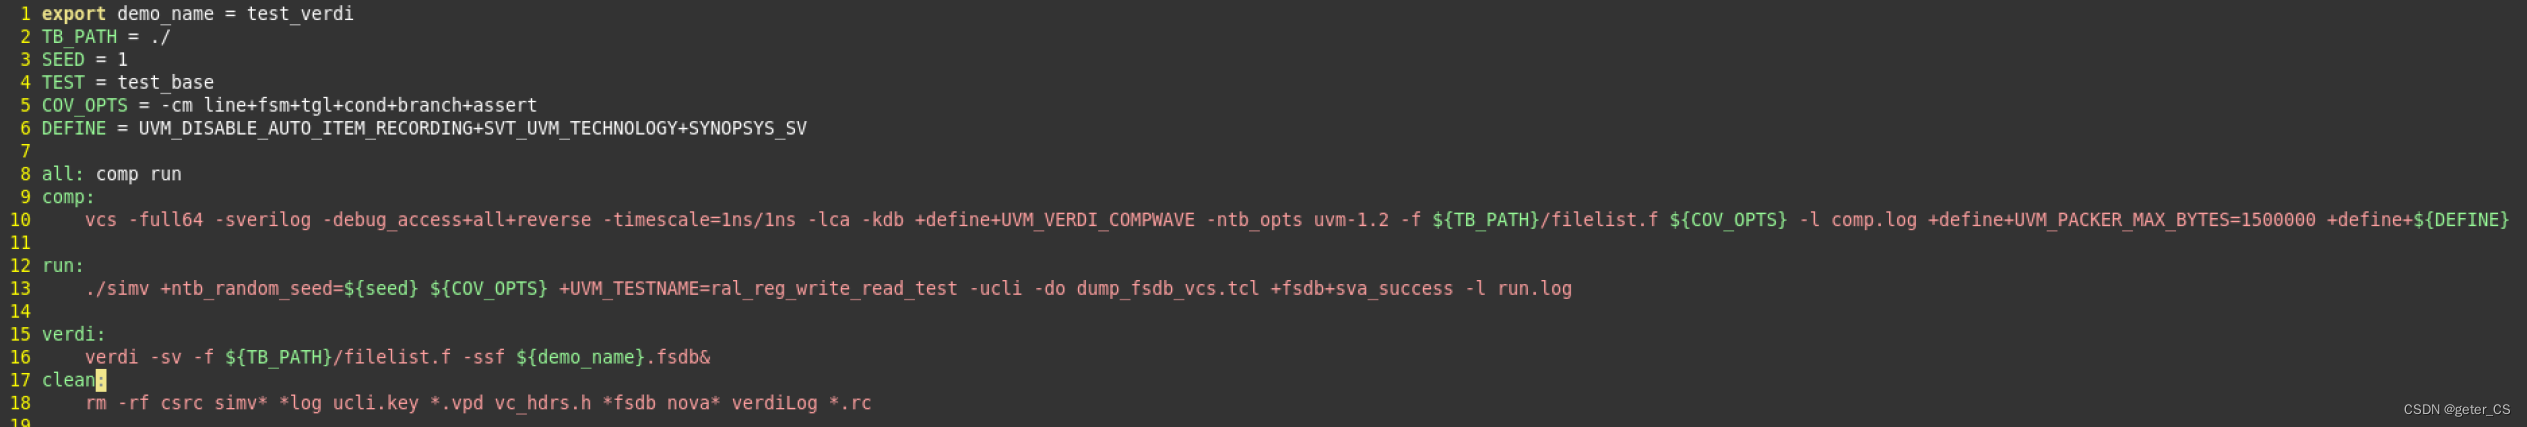
直接在makefile中run中加上-verdi,并且把方法一中介绍的simulation中的option中内容加上。这样makefile修改成如下这样。
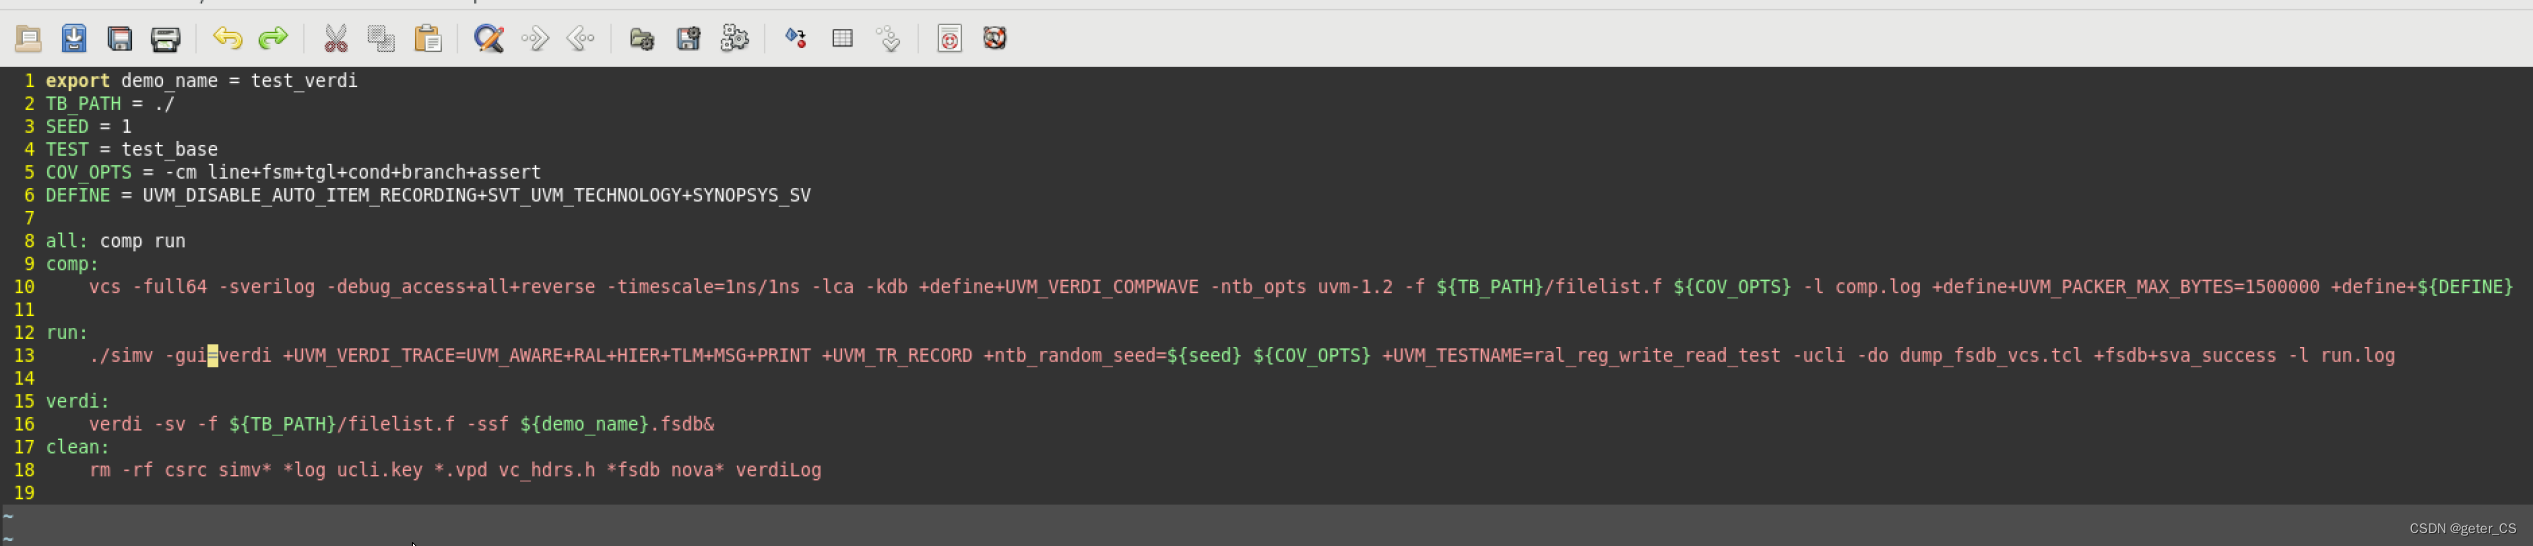
然后直接make就可以打开verdi的交互模式。此时simulation中的option已经按照run中的设置给设好了。但是注意option下面的选项也需要勾选上。
四.UVM的ral和sequencer。
按照上面设置并进行simulation后,此时:
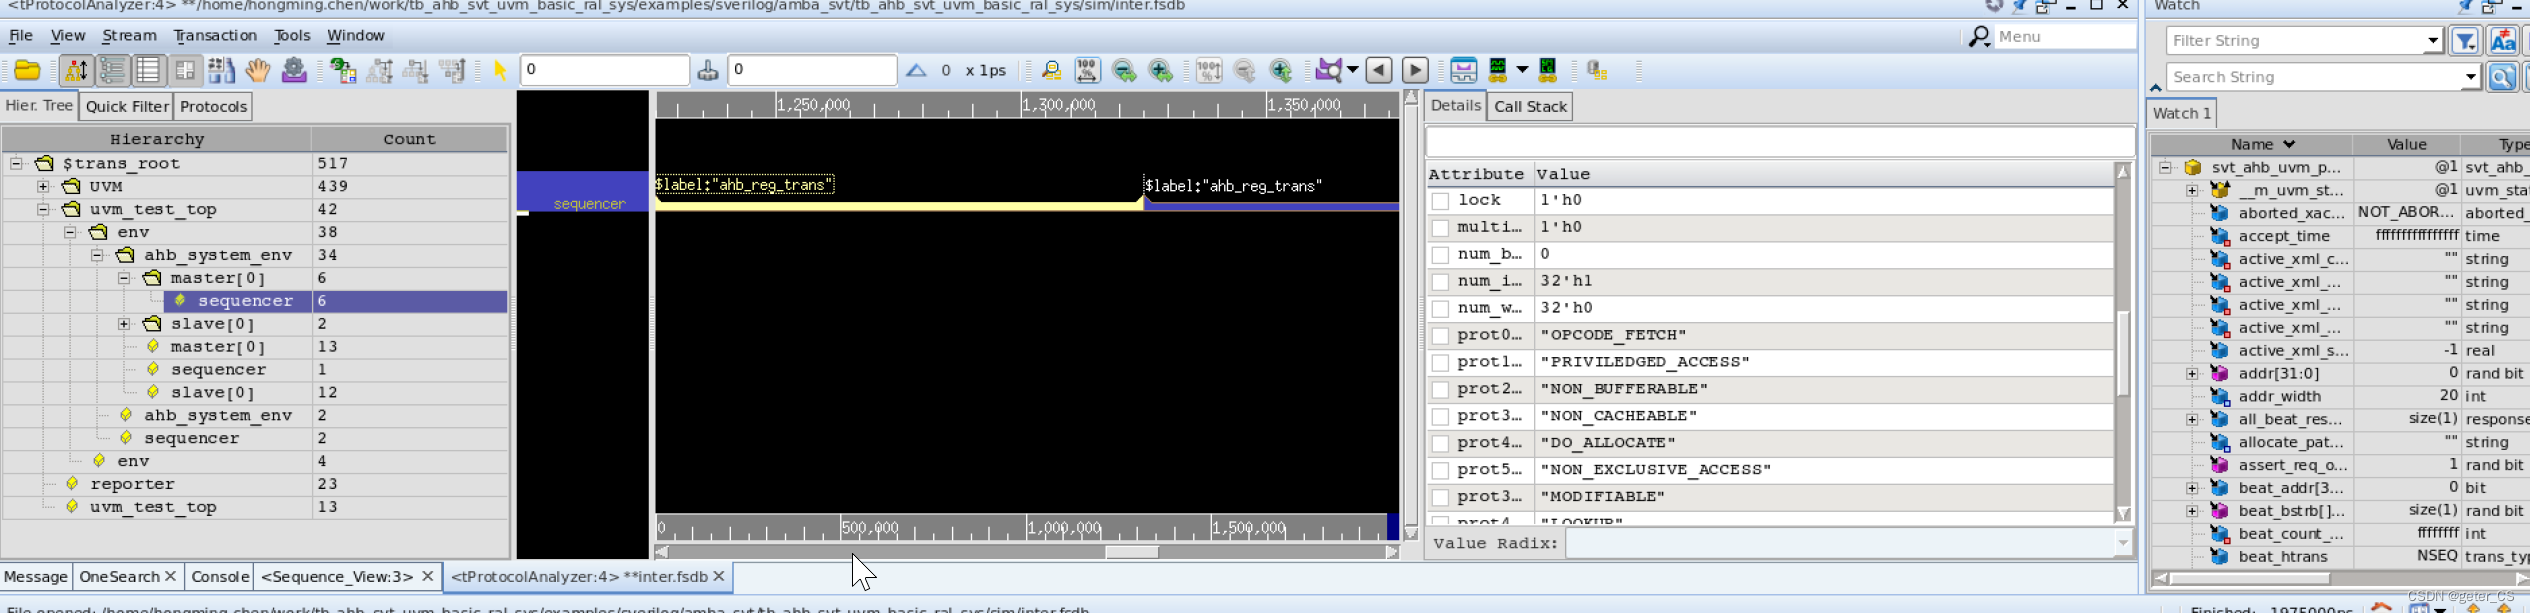
1.可以直接从hier里将相关组件添加到波形中,并展开。比如下图中将sequencer拉倒波形中去。(当然也可以将其他组件拉入比如driver等)
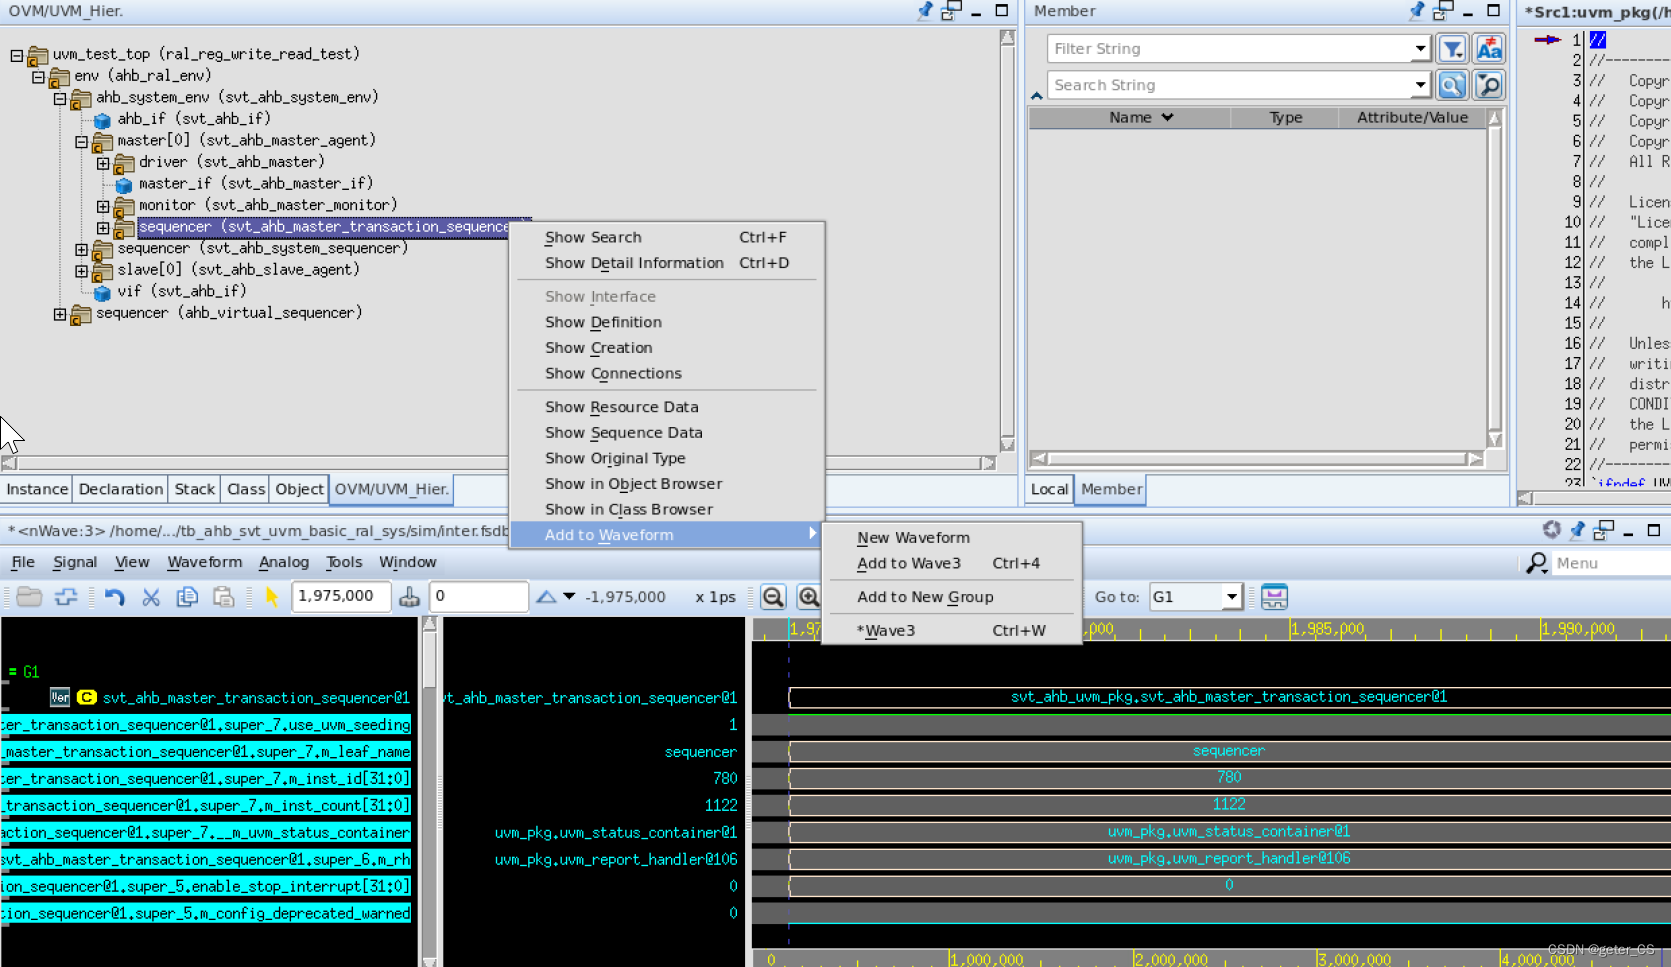
2.点击UVM->sequencer,可以显示出transaction。选中其中一个点击右键可以添加到watch窗口中进行观察。
另外可以选中之后点击右键->add sequence to transaction brower会出现如下更加形象的窗口。可以观察transaction的详细内容以及开始和结束时间。
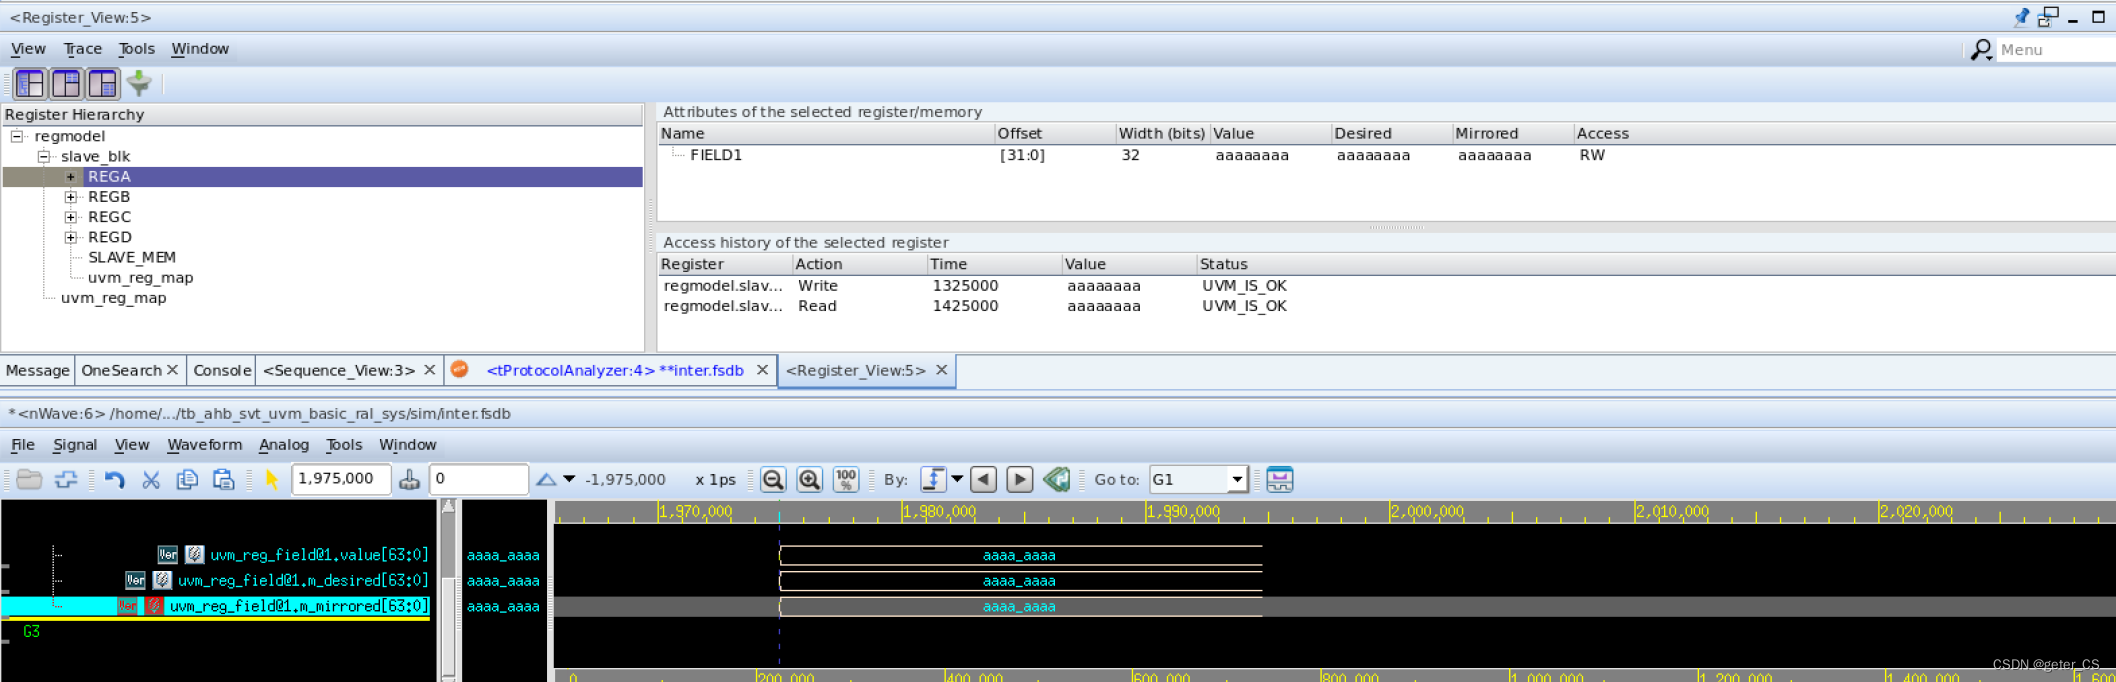
2.register view也是一样,可以点击右键将register添加到波形上进行观察。
五.reverse和breakpoint。
a.断点设置就是直接在代码行号边上点右键,添加breakpoint就可以。也可以在manage breakpoint中对breakpoint进行管理。我们想观察某个变量,可以在代码中选中,点击右键添加到watch中,就可以观察其变化。
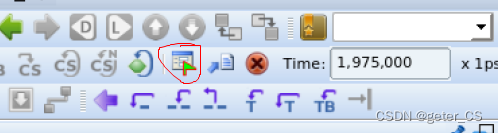
b.要想在单步调试时,使用返回上一步操作。还需要将reverse debug勾选上。
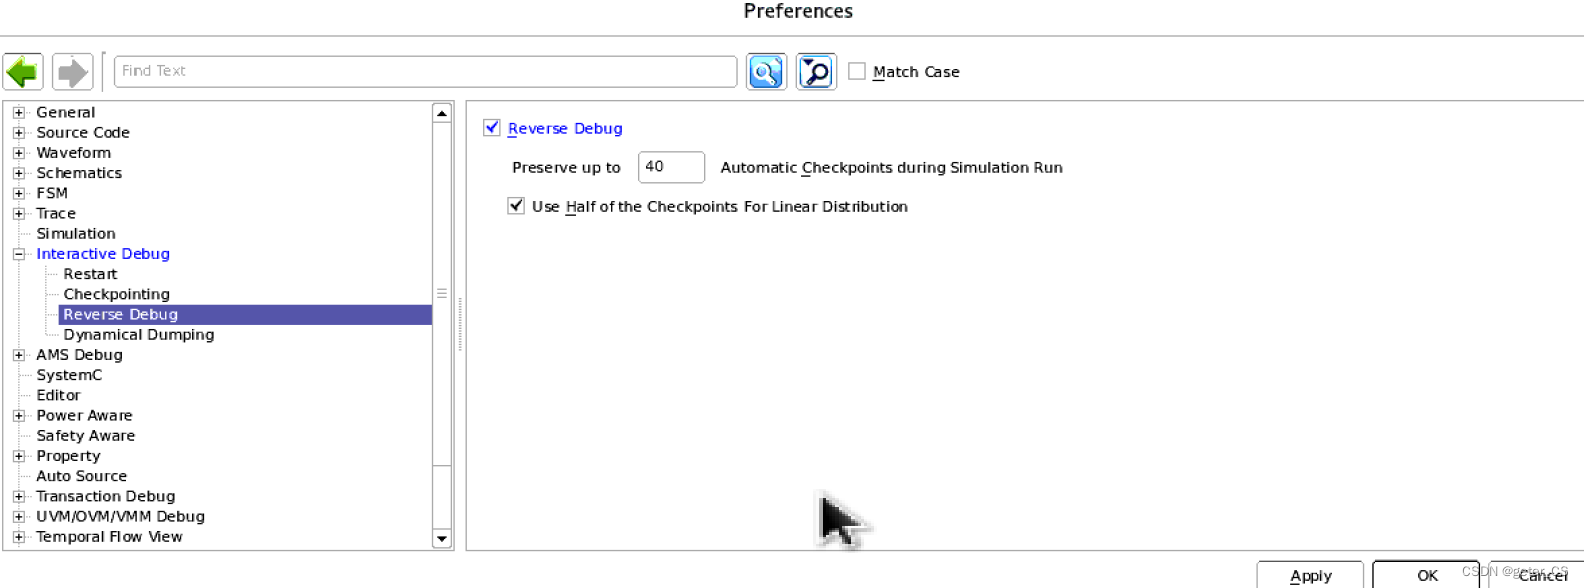
勾选上之后,就可以使用紫色的这些reverse按钮。
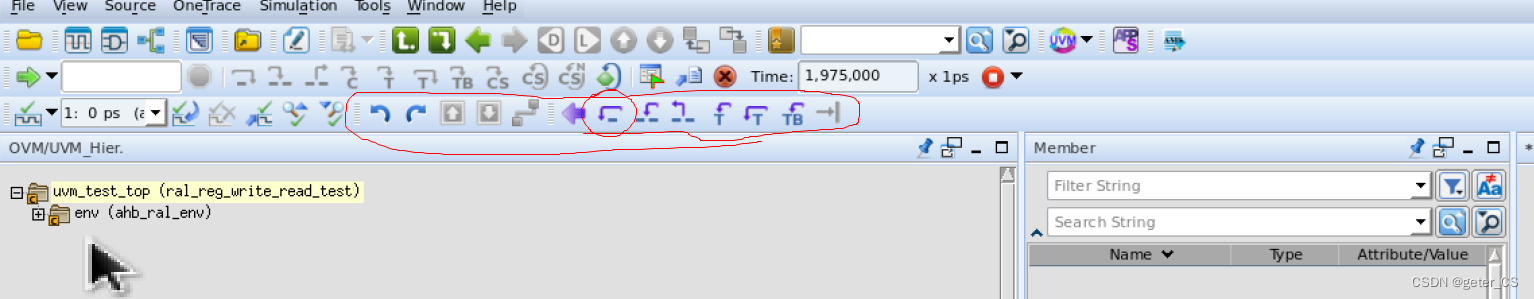
然后配合着breakpoint,加上这些蓝色的箭头按钮进行单步调试了。

其他问题:
为甚么子系统的使用interactive mode的时候在simulation的option选项中不需要指定case,因为其将case class定义包含在了module中(module和class同名),但是使用UVM_TEST_NAME指定的case时指定就是module名,所以verdi加载时按照fileist一定会把module加载上去。并且module中也指定了启动此cass class。所以运行simulation时,module按照顺序执行到对应的case,不用再次在option中指定case,但是如果想要进行UVM debug那么还是需要在option中添加相关选项的。而通常指将case定义为类的方式就需要因为其没有被module包含起来。(参考
怎样将例化的uvn test包含在verdi的instance中,并将其中变量加入到dump的波形中(方便verdi追test以及debug)_geter_CS的博客-CSDN博客)
出现不显示simulation和interactive debug等各种窗口,可能的原因是license设置是否设置正确,我遇到的问题就是修改license解决的。然后打开波形就是正确的了。
参考:
Verdi
®
Transaction and
Protocol Debug
User Guide
Vcs user guide
Verdi
UVM DEBUG USER Guide.
最后
以上就是纯真短靴最近收集整理的关于(AHB VIP为例)Verdi UVM/interactive debug mode简单使用一、编译和仿真相关选项解释:二.使用Verdi UVM/interactive debug mode使用方法一三.使用Verdi UVM/interactive debug mode使用方法二四.UVM的ral和sequencer。五.reverse和breakpoint。其他问题:的全部内容,更多相关(AHB内容请搜索靠谱客的其他文章。
本图文内容来源于网友提供,作为学习参考使用,或来自网络收集整理,版权属于原作者所有。


发表评论 取消回复