import cv2 as cv
import numpy as np

#读取图片
src = cv.imread('./images/test_lane/11.jpg')
cv.imshow('img',src)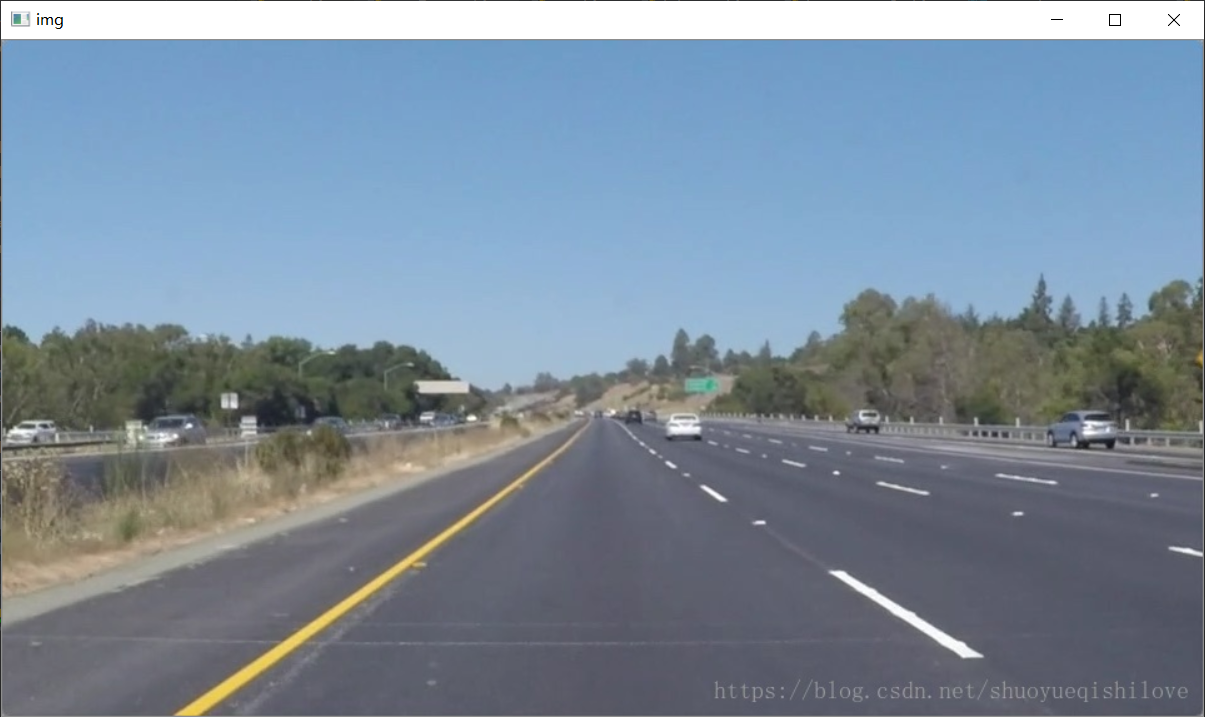
使用高斯模糊对图像进行去噪声处理
# 高斯降噪
src1 = cv.GaussianBlur(src,(5,5),0,0)
cv.imshow('gaosi',src1)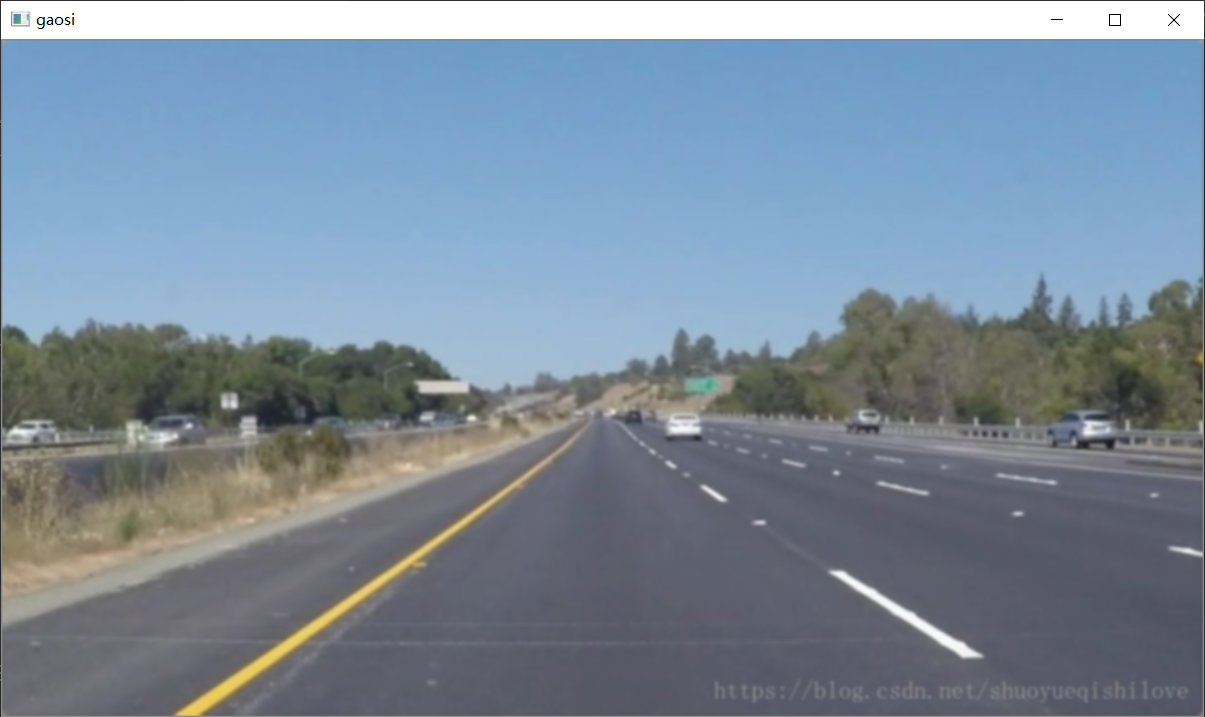
使用opencv中的函数cv2.cvtColor()将图像转化为灰度图像
#灰度处理
src2 = cv.cvtColor(src1,cv.COLOR_BGR2GRAY)
cv.imshow('huidu',src2)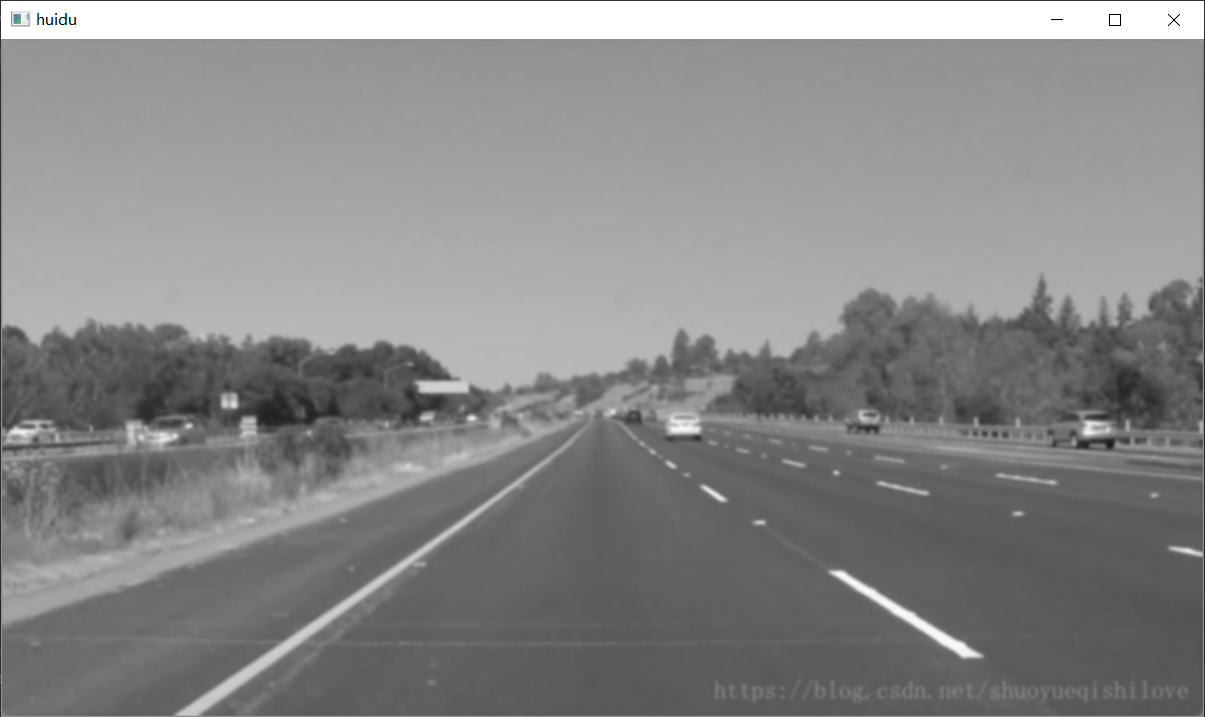
使用cv2.canny()提取图像的轮廓
#边缘检测
lthrehlod = 50
hthrehlod =150
src3 = cv.Canny(src2,lthrehlod,hthrehlod)
cv.imshow('bianyuan',src3)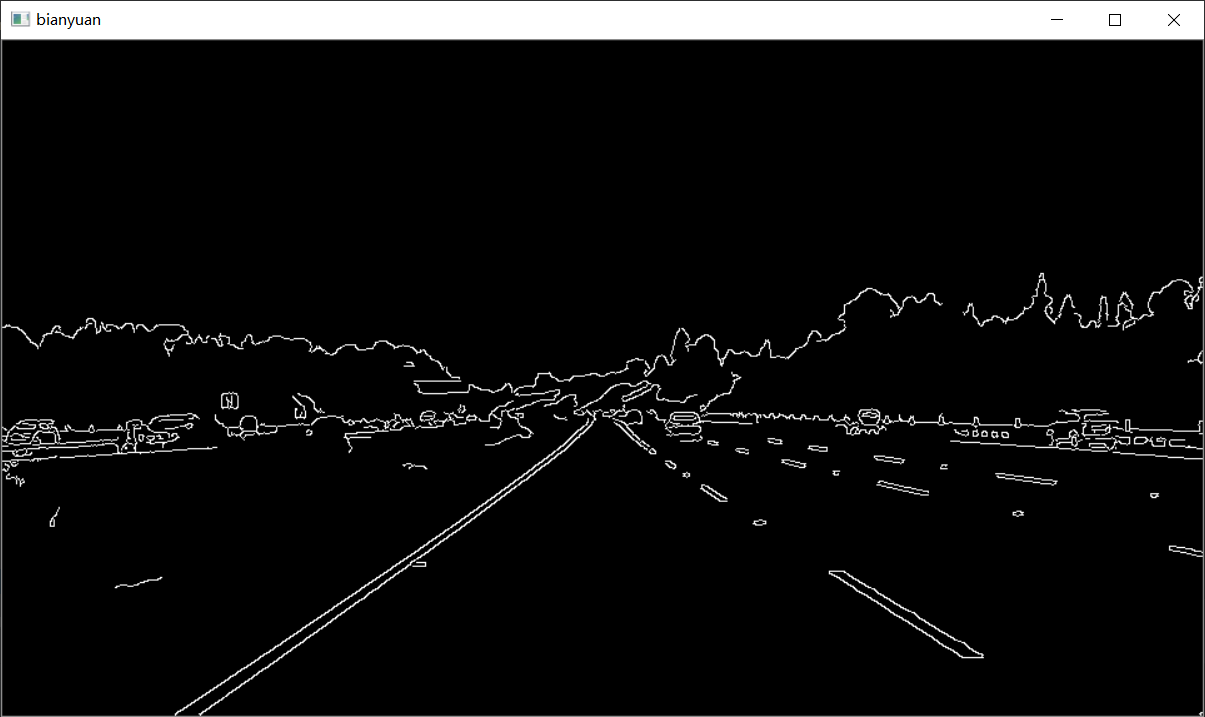
#ROI划定区间,并将非此区间变成黑色
regin = np.array([[(0,src.shape[0]),(460,325),(520,325),(src.shape[1],src.shape[0])]])
mask = np.zeros_like(src3)
mask_color = 255   #src3图像的通道数是1,且是灰度图像,所以颜色值在0-255
cv.fillPoly(mask,regin,mask_color)
src4 = cv.bitwise_and(src3,mask)
cv.imshow('bianyuan',src4)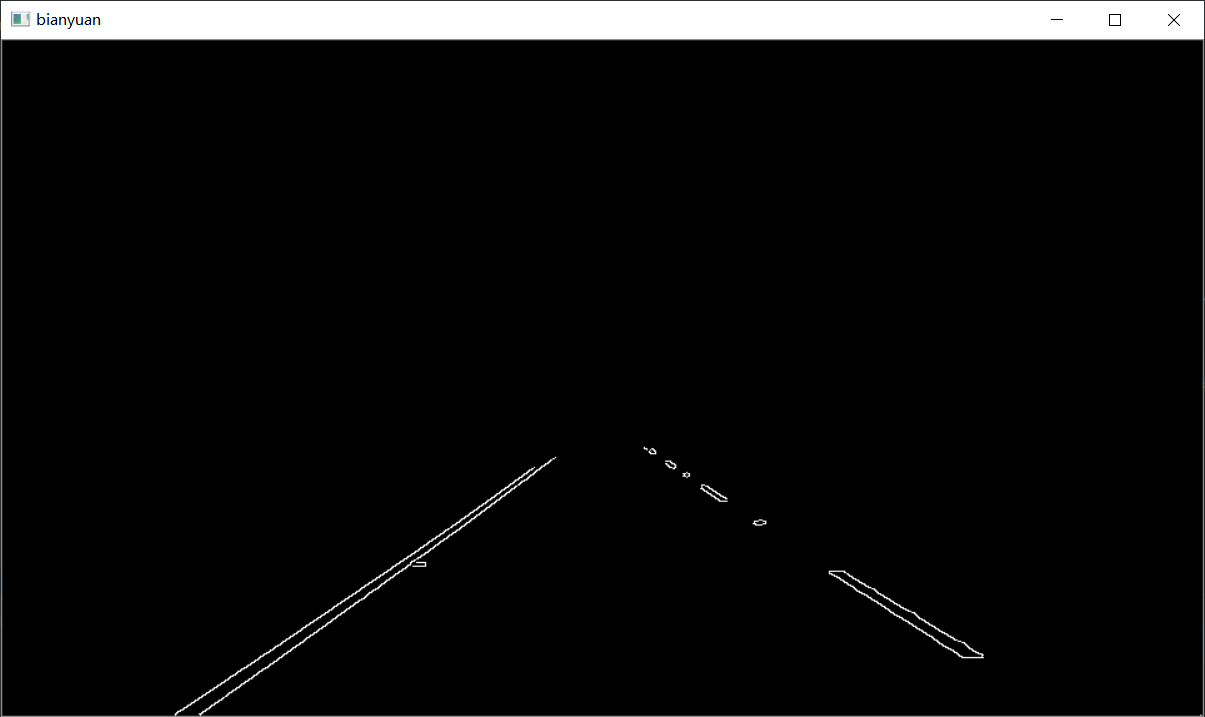
使用霍夫直线检测,提取轮廓图中的直线
这里使用的依然是opencv中的函数:cv2.HoughLinesP()它是一个基于概率的直线检测算法,可以直接输出检测到的直线的点集(一般采用两点表示一条直线),关于这个算法的详情可以参考这个博客:https://blog.csdn.net/on2way/article/details/47028969
#利用霍夫变换原理找出上图中的像素点组成的直线,然后画出来
rho = 1
theta = np.pi/180
threhold =15
minlength = 40
maxlengthgap = 20
lines = cv.HoughLinesP(src4,rho,theta,threhold,np.array([]),minlength,maxlengthgap)
#画线
linecolor =[0,255,255]
linewidth = 4
src5 = cv.cvtColor(src4,cv.COLOR_GRAY2BGR) #转化为三通道的图像
cv.imshow("huofu",src5)
lefts =[]
rights =[]
for line  in lines:
    for x1,y1,x2,y2 in line:
        #cv.line(src5,(x1,y1),(x2,y2),linecolor,linewidth)
        #分左右车道
        k = (y2-y1)/(x2-x1)
        if k<0:
                lefts.append(line)
        else:
                rights.append(line)
对提取后的直线集合进行处理
上一步中提取到了图像中所有直线特征的点集,包含了很多的直线,但是很多事我们不需要的直线,这就需要特别处理–去掉冗余的直线。怎么做呢?作者给出了一个好的办法:首先对直线点集根据斜率的正负分成左右两类直线集;然后在分别对左右直线集进行处理,方法为:每次计算直线集的平均斜率和每条直线的斜率与平均斜率的差值的绝对值,求出其中差值最大的直线,判断该直线的斜率是否大于阈值,如果大于阈值,就将其弹出,然后对剩下的直线继续进行相同的操作,指导满足条件为止。
# 优化处理
def choose_lines(lines, threhold):  # 过滤斜率差别较大的点
    slope = [(y2 - y1) / (x2 - x1) for line in lines for x1, x2, y1, y2 in line]
    while len(lines) > 0:
        mean = np.mean(slope)  # 平均斜率
        diff = [abs(s - mean) for s in slope]
        idx = np.argmax(diff)
        if diff[idx] > threhold:
            slope.pop(idx)
            lines.pop(idx)
        else:
            break

    return lines


def clac_edgepoints(points, ymin, ymax):  # 可以理解成找一条线的端点
    x = [p[0] for p in points]
    y = [p[1] for p in points]

    k = np.polyfit(y, x, 1)
    func = np.poly1d(k)  # 方程是y关于x的函数,因为输入的ymin ymax。要求xmin,xmax

    xmin = int(func(ymin))
    xmax = int(func(ymax))

    return [(xmin, ymin), (xmax, ymax)]


good_leftlines = choose_lines(lefts, 0.1)  # 处理后的点
good_rightlines = choose_lines(rights, 0.1)

leftpoints = [(x1, y1) for left in good_leftlines for x1, y1, x2, y2 in left]
leftpoints = leftpoints + [(x2, y2) for left in good_leftlines for x1, y1, x2, y2 in left]
rightpoints = [(x1, y1) for right in good_rightlines for x1, y1, x2, y2 in right]
rightpoints = rightpoints + [(x2, y2) for right in good_rightlines for x1, y1, x2, y2 in right]

lefttop = clac_edgepoints(leftpoints, 325, src.shape[0])  # 要画左右车道线的端点
righttop = clac_edgepoints(rightpoints, 325, src.shape[0])

src6 = np.zeros_like(src5)

cv.line(src6, lefttop[0], lefttop[1], linecolor, linewidth)
cv.line(src6, righttop[0], righttop[1], linecolor, linewidth)

cv.imshow('onlylane',src6)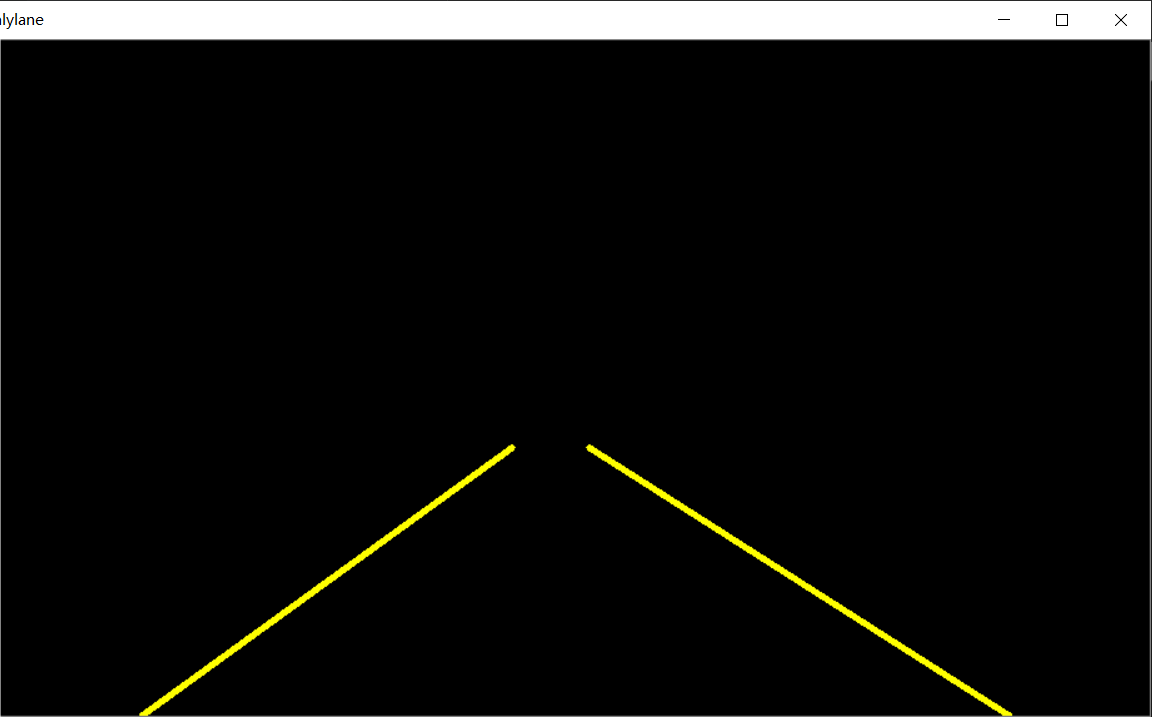
画出车道线
上一步中得到的直线集依然很多(可以看做是点集),但是范围就已经很小了,这里采用最小二乘拟合的方式,将这些到用直线拟合,得到最后的左右车道线。之后在图上绘制出车道线就可以了。
#图像叠加
src7 = cv.addWeighted(src1,0.8,src6,1,0)
cv.imshow('Finally Image',src7)
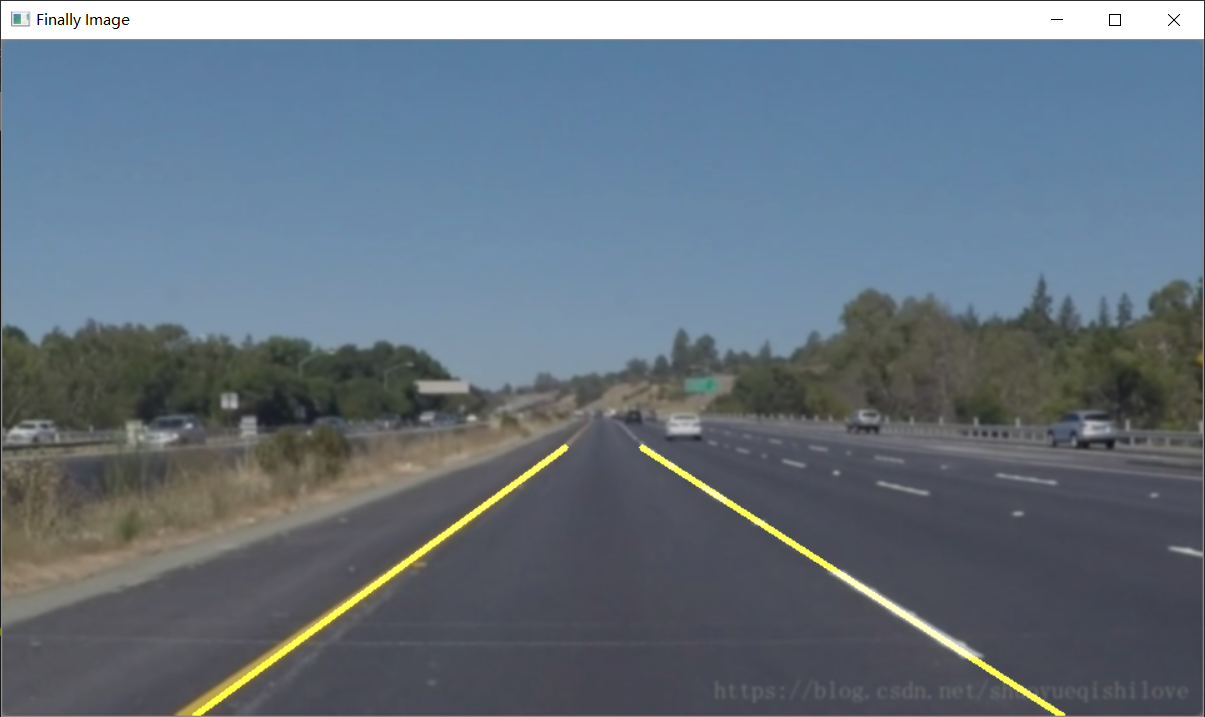
如果换张图片,可能效果不是很好,不具有普遍性,只是帮助理解车道检测的过程。
参考https://blog.csdn.net/qq_23499043/article/details/92844329
https://blog.csdn.net/shuoyueqishilove/article/details/81022965
https://blog.csdn.net/Young_Gy/article/details/75194914
https://blog.csdn.net/linghugoolge/article/details/85802994
最后
以上就是时尚戒指最近收集整理的关于车道线检测的全部内容,更多相关车道线检测内容请搜索靠谱客的其他文章。


发表评论 取消回复