绘制对比箱线图
- 1 单独测试
- 2 封装成函数
- 3 总结
1 单独测试
library(ggplot2)
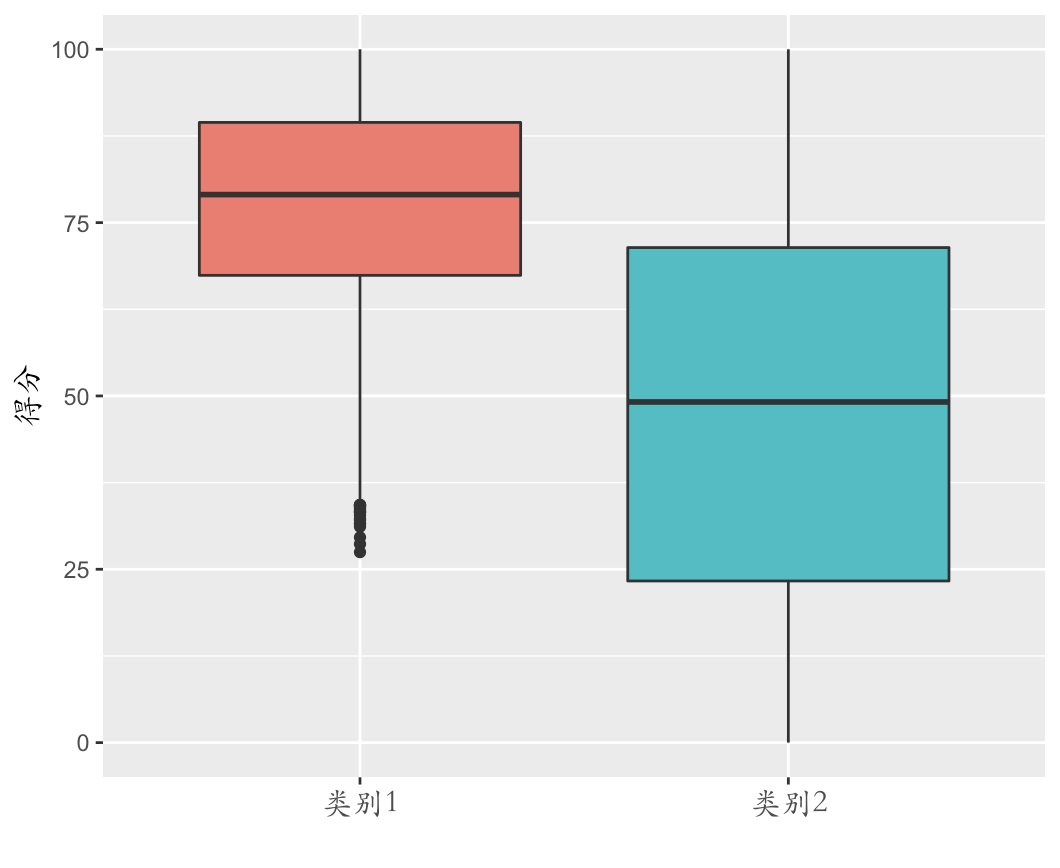
p<-ggplot(data=df_plot, aes(x=label,y=score))+
geom_boxplot(aes(fill=label))+
theme(legend.position = 'none', title = element_text(family = 'STKaiti'), # 设置不要旁边的那个解释框
axis.title.x = element_text(family = 'STKaiti'), # 字体大小格式设置
axis.title.y = element_text(family = 'STKaiti', size = 12, face = 'bold'),
axis.text.x = element_text(family = 'STKaiti', size = 12, face = 'bold'))+
labs(x="",y="得分", main = "")
# 横轴纵轴标题设置
p

2 封装成函数
library(ggplot2)
PlotGGBox = function(df, label, name, y_name){

# df表示数据框
# label表示按这个类别进行分类绘制对比箱线图
# name表示和分类变量对比的数值型变量名称 如果单独不行就带$符号
# y_name表示纵轴的显示

  p<-ggplot(data=df, aes(x=label,y=name))+
    geom_boxplot(aes(fill=label))+
    theme(legend.position = 'none', title = element_text(family = 'STKaiti'),
          axis.title.x = element_text(family = 'STKaiti'),
          axis.title.y = element_text(family = 'STKaiti', size = 12, face = 'bold'),
          axis.text.x = element_text(family = 'STKaiti', size = 12, face = 'bold'))+
    labs(x="",y=y_name)
  p
}
PlotGGBox(df_plot, label, score, "得分")
3 总结
- 主要是记录如何绘制对比箱线图,因为过几天代码就忘了,写在博客记录一下!
最后
以上就是热情含羞草最近收集整理的关于R | 使用ggplot绘制对比箱线图1 单独测试2 封装成函数3 总结的全部内容,更多相关R内容请搜索靠谱客的其他文章。
本图文内容来源于网友提供,作为学习参考使用,或来自网络收集整理,版权属于原作者所有。


发表评论 取消回复