Prometheus 学习之——基于 go 编写一个 exporter
文章目录
- Prometheus 学习之——基于 go 编写一个 exporter
- 前言
- 一、exporter 简介
- 二、基于 Go 客户端编写一个 exporter
- 1. Guage 仪表盘类型
- 2. Count 计数器类型
- 3. Summary 类型
- 4. Histogram 类型
- 三、使用 Prometheus 展示指标
- 总结
前言
Prometheus 是 CNCF 收录的第二个项目,已经成为了云原生时代监控行业的标准。
一、exporter 简介
在很多流行的监控系统中都已经实现了 Prometheus 的监控接口,例如 etcd、Kubernetes、CoreDNS 等,它们可以直接被 Prometheus 监控。但是大多数监控对象都没办法直接提供监控接口,主要原因有:
- 很多系统在 Prometheus 诞生前的很多年就已经发布,例如 MySQL、Redis 等;
- 本身不支持 HTTP 接口,例如对于硬件性能指标,操作系统并没有原生的 HTTP 接口可以获取;
- 考虑到安全性、稳定性及代码耦合等因素的影响,软件作者并不愿意将监控代码加入现有代码中。
这些都导致没法通过一个规范解决所有监控问题。在此背景下,exporter 应运而生。exporter 是一个采集监控数据并通过 Prometheus 监控规范对外提够数据的组件。 除了官方实现的 exporter 如 Node exporter、HAProxy exporter、MySQL server exporter,还有很多第三方实现如 Redis exporter 和 RabbitMQ exporter 等。Prometheus 会周期性地调用这些 exporter 提供的 metrics 数据接口来获取数据。
这些 exporter 将不同规范和格式的监控指标进行转化,输出 Prometheus 能够识别的监控数据格式,从而极大地扩展 Prometheus 采集数据的能力。如果将 Prometheus 比作『天眼』,那么每个 exporter 就是散落在全球的一个个摄像头。Prometheus 正是依靠这些 exporter 监控不同种类的对象的。
二、基于 Go 客户端编写一个 exporter
完整代码地址:https://github.com/LeoNumber1/goExporterDemo
1. Guage 仪表盘类型
package main

import (
	"flag"
	"fmt"
	"log"
	"net/http"
	"time"

	"github.com/prometheus/client_golang/prometheus"
	"github.com/prometheus/client_golang/prometheus/promhttp"
)

//自定义端口
var addr = flag.String("listen-address", ":8080", "The address to listen on for HTTP requests")

var (
	//Gauge 仪表盘类型
	opsQueued = prometheus.NewGauge(prometheus.GaugeOpts{
		Namespace: "our_company",
		Subsystem: "blob_storage",
		Name:      "ops_queued",
		Help:      "Number of blob storage operations waiting to be processed",
	})

	jobsInQueue = prometheus.NewGaugeVec(prometheus.GaugeOpts{
		Name: "job_in_queue",
		Help: "Current number of jobs in the queue",
	}, []string{"job_type"})
)

func init() {
	prometheus.MustRegister(opsQueued, jobsInQueue)
}

func main() {
	flag.Parse()
	jobsInQueue.WithLabelValues("testjob").Add(3)
	go func() {
		for true {
			//每隔一秒加 4
			opsQueued.Add(4)
			time.Sleep(time.Second)
		}
	}()
	http.Handle("/metrics", promhttp.Handler())
	log.Fatal(http.ListenAndServe(*addr, nil))
}
在通过 go build -o test 编译后运行 ./test -listen-address=:8080,启动这个极简的 exporter。通过浏览器访问 http://localhost:8080/metrics 就可以获取如下输出:
# HELP our_company_blob_storage_ops_queued Number of blob storage operations waiting to be processed
# TYPE our_company_blob_storage_ops_queued gauge
our_company_blob_storage_ops_queued 104
并且每隔 1s 下面的指标数值加 4,由于 Guage 指标可增可减,所以 Add() 方法可以接收负值,表示指标下降。
可以借助 Vec 类型的指标为指标添加标签,相应地,在为指标赋值的时候需要添加对应的 value。将产生带有 job_type=“testjob” 标签的指标,如下:
# HELP job_in_queue Current number of jobs in the queue
# TYPE job_in_queue gauge
job_in_queue{job_type="testjob"} 3
2. Count 计数器类型
Count 类型的指标,会采用计数器加 1 的方式,如下:
//Count 计数器类型
taskCounter = prometheus.NewCounter(prometheus.CounterOpts{
	Subsystem: "worker_pool",
	Name:      "completed_tasks_total",
	Help:      "Total number of tasks completed.",
})
同样加入注册,模拟调用 taskCounter.Inc() ,每隔 1s 下面的指标数值加 1。由于 Count 指标只增不减,所以只提供了 Inc() 方法。浏览器获取如下:
# HELP worker_pool_completed_tasks_total Total number of tasks completed.
# TYPE worker_pool_completed_tasks_total counter
worker_pool_completed_tasks_total 25
3. Summary 类型
Summary 类型的指标,需要提供分位点,如下:
//Summary 类型,需要提供分位点
temps = prometheus.NewSummary(prometheus.SummaryOpts{
	Name:       "pond_temperature_celsius",
	Help:       "The temperature of the frog pond.",
	Objectives: map[float64]float64{0.5: 0.05, 0.9: 0.01, 0.99: 0.001},
})
模拟观察数据:
go func() {
	// 模拟观察温度
	for i := 0; i < 1000; i++ {
		temps.Observe(30 + math.Floor(120*math.Sin(float64(i)*0.1))/10)
	}

	// 仅供示范, 让我们通过使用它的 Write 方法检查摘要的状态 (通常只在 Prometheus 内部使用).
	metric := &dto.Metric{}
	temps.Write(metric)
	fmt.Println(proto.MarshalTextString(metric))
}()
浏览器获取如下:
# HELP pond_temperature_celsius The temperature of the frog pond.
# TYPE pond_temperature_celsius summary
pond_temperature_celsius{quantile="0.5"} 31.1
pond_temperature_celsius{quantile="0.9"} 41.3
pond_temperature_celsius{quantile="0.99"} 41.9
pond_temperature_celsius_sum 29969.50000000001
pond_temperature_celsius_count 1000
4. Histogram 类型
Histogram 类型的指标,需要提供 Bucket 大小,如下:
//Histogram 类型,需要提供 Bucket大小
tempsHistogram = prometheus.NewHistogram(prometheus.HistogramOpts{
	Name:        "pond_temperature_histogram_celsius",
	Help:        "The temperature of the frog pond.",
	ConstLabels: nil,
	Buckets:     prometheus.LinearBuckets(20, 5, 5), // 5 个 buckets, 跨度为 5 摄氏度.
	//Buckets:     []float64{20, 25, 30, 35, 40}, //等价于这个
})
由于填写一串 Bucket 过于繁琐,所以 Prometheus 还提供了便捷的生成方法:
- LinearBuckets 用于创建等差数列;
- ExponentialBucket 用于创建等比数列。
模拟观察数据:
go func() {
	// 模拟观察温度
	for i := 0; i < 1000; i++ {
		tempsHistogram.Observe(30 + math.Floor(120*math.Sin(float64(i)*0.1))/10)
	}

	// 仅供示范, 让我们通过使用它的 Write 方法检查摘要的状态 (通常只在 Prometheus 内部使用).
	metric := &dto.Metric{}
	tempsHistogram.Write(metric)
	fmt.Println(proto.MarshalTextString(metric))
}()
浏览器获取如下:
# HELP pond_temperature_histogram_celsius The temperature of the frog pond.
# TYPE pond_temperature_histogram_celsius histogram
pond_temperature_histogram_celsius_bucket{le="20"} 192
pond_temperature_histogram_celsius_bucket{le="25"} 366
pond_temperature_histogram_celsius_bucket{le="30"} 501
pond_temperature_histogram_celsius_bucket{le="35"} 638
pond_temperature_histogram_celsius_bucket{le="40"} 816
pond_temperature_histogram_celsius_bucket{le="+Inf"} 1000
pond_temperature_histogram_celsius_sum 29969.50000000001
pond_temperature_histogram_celsius_count 1000
三、使用 Prometheus 展示指标
本地安装好 prometheus(或者用 docker),修改 prometheus.yml 文件,将我们编写的 exporter 的 metrics 地址加进去:
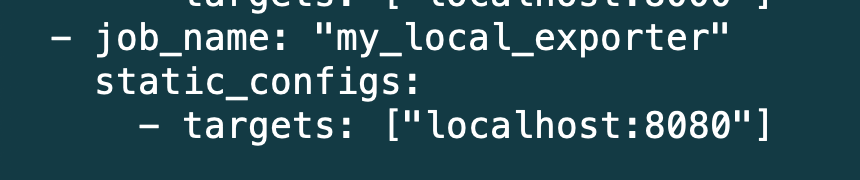
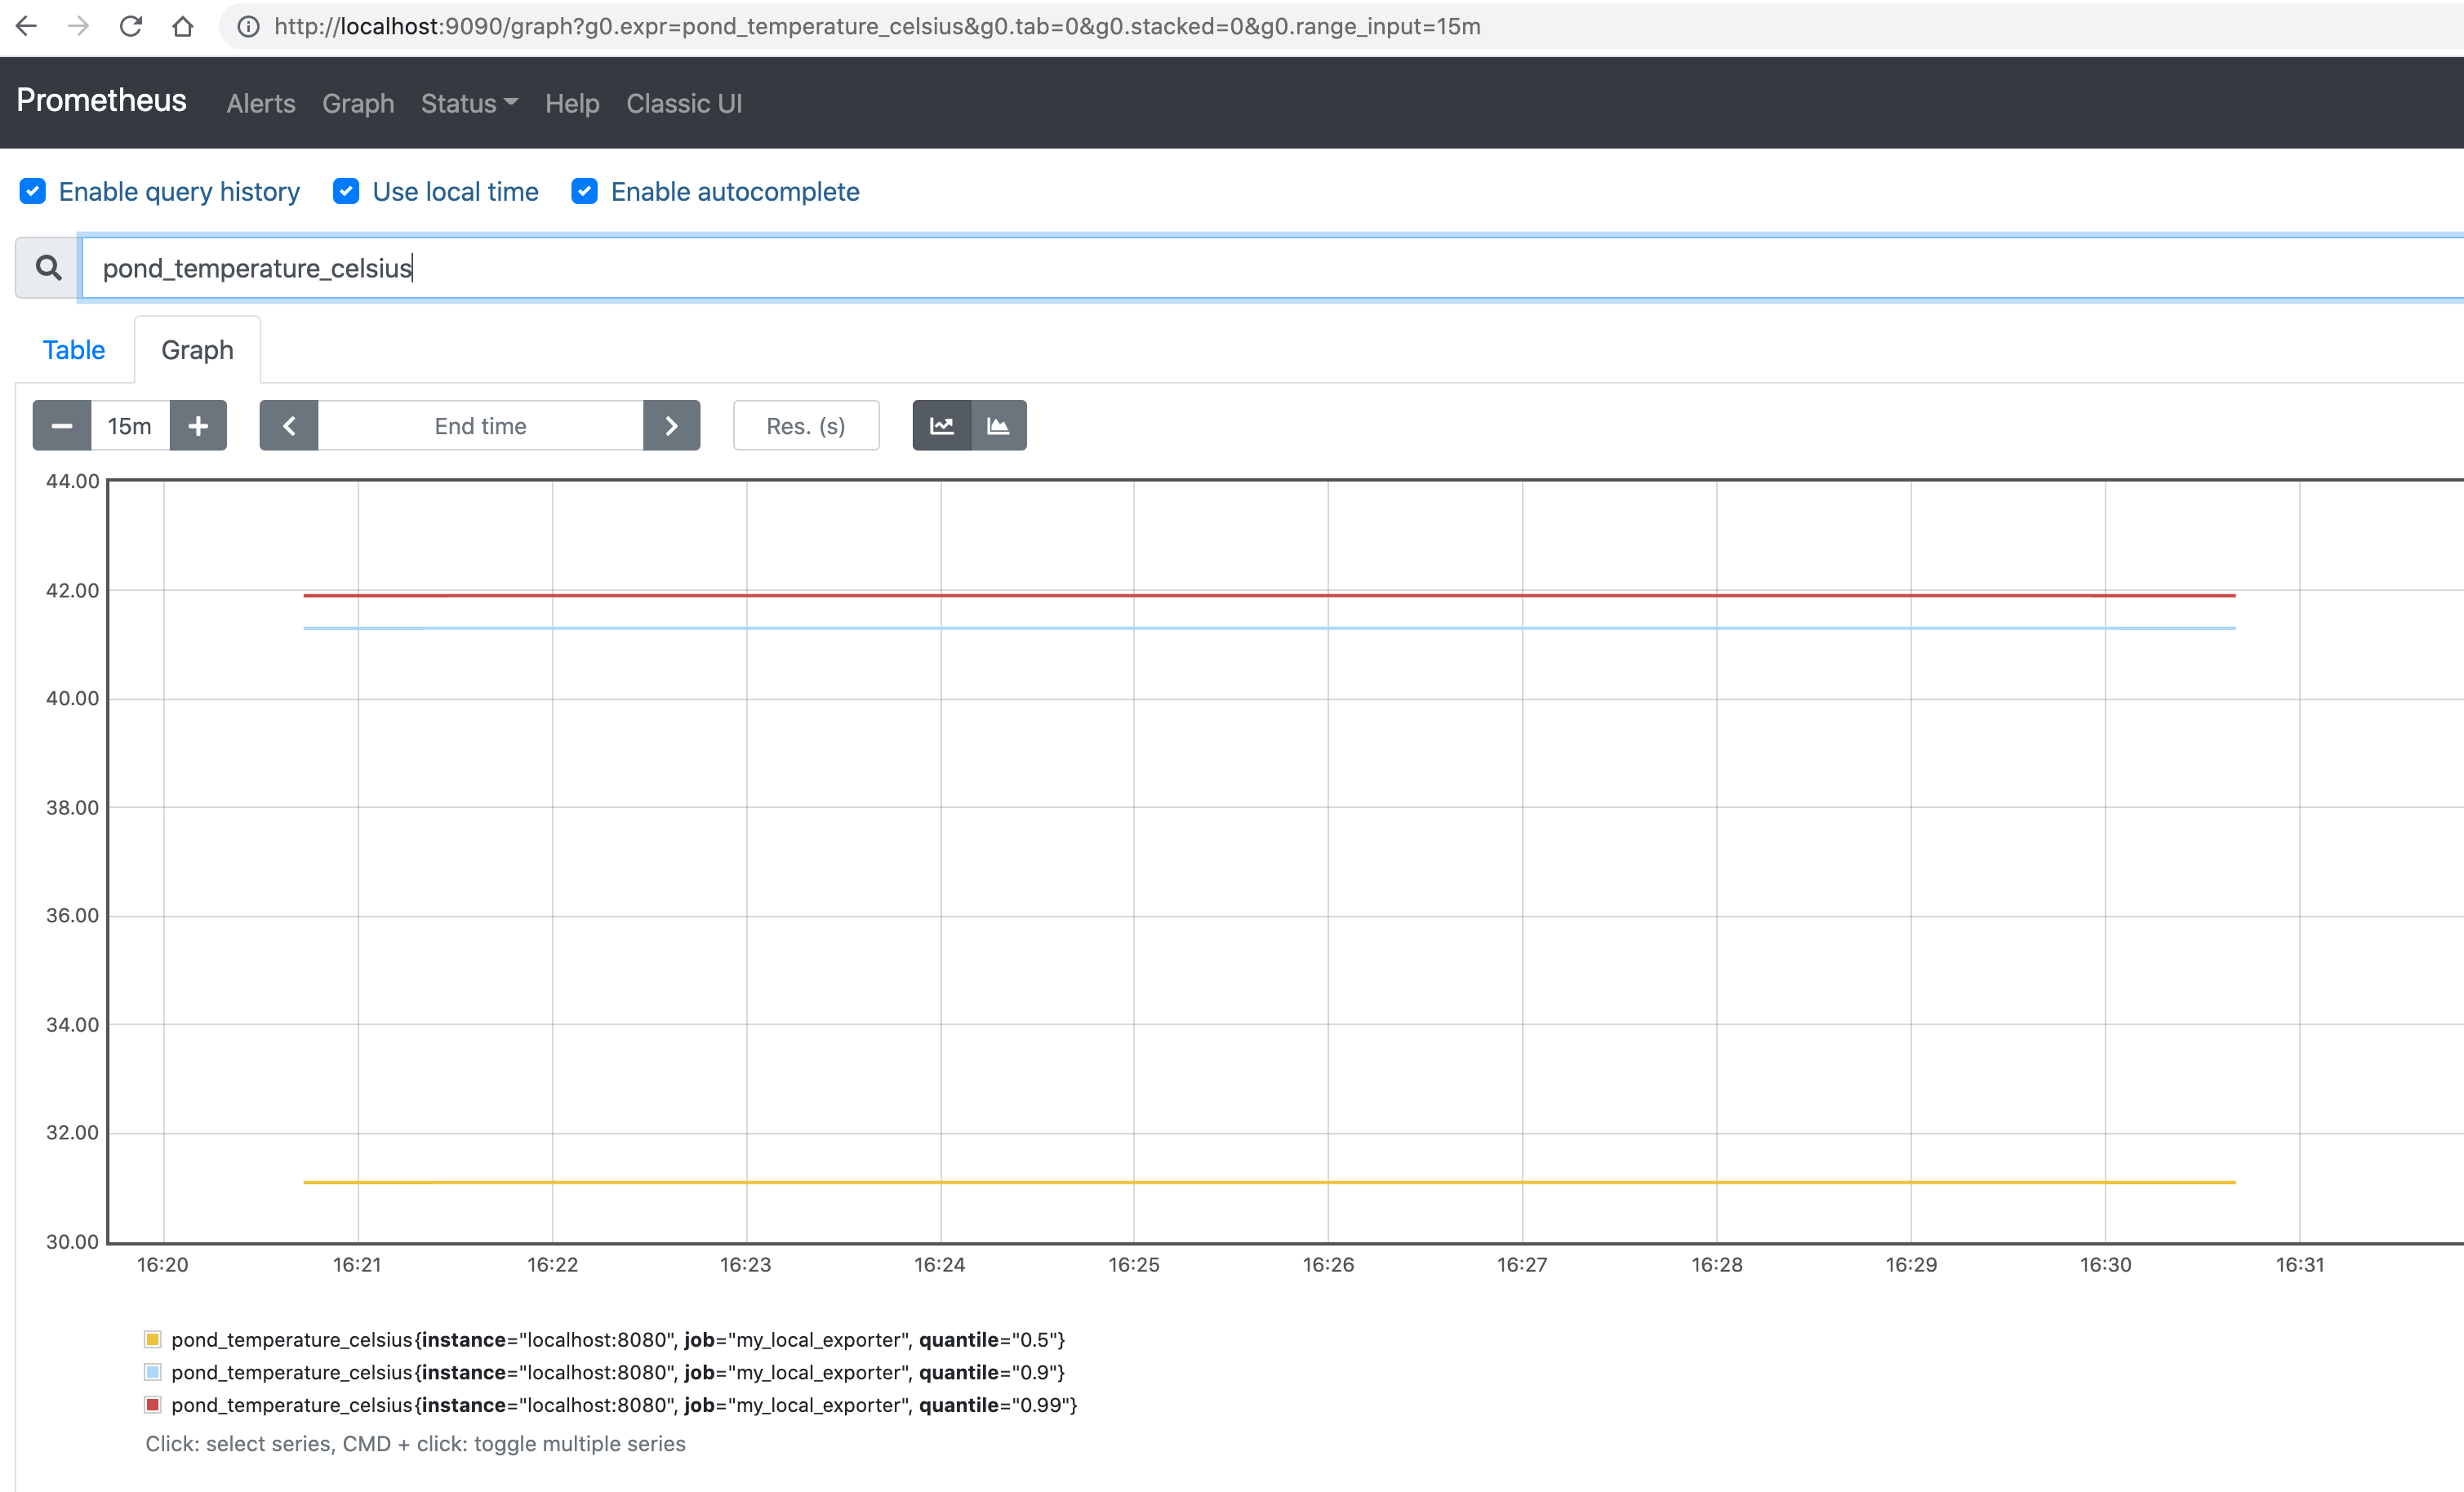
启动 prometheus,打开自带的页面 http://localhost:9090 ,输入我们编写的 exporter 的指标查询,可以看到 prometheus 已经可以正常抓取 exporter 的指标了:
总结
本文使用 Go 客户端编写了一个极简的 exporter,并对 4 种类型的指标作了简单的介绍。具体使用的时候,墙裂建议多阅读官方文档,选取最适合自己系统的指标。
最后
以上就是害羞信封最近收集整理的关于Prometheus 学习之——基于 go 编写一个 exporterPrometheus 学习之——基于 go 编写一个 exporter前言一、exporter 简介二、基于 Go 客户端编写一个 exporter三、使用 Prometheus 展示指标总结的全部内容,更多相关Prometheus内容请搜索靠谱客的其他文章。


发表评论 取消回复